
CoinAdvisor
1.1k Paylaşımlar

CoinAdvisor
Şikayət et
İstifadəçini blokla
Professional trader & market researcher. My own scanner watches the whole futures board 24/7. I publish measurements - plus a weekly scorecard with misses.
8 İzlənilir
709 İzləyicilər
1.2K+ Bəyəndi
Postlar
·
--
Tərcüməyə bax
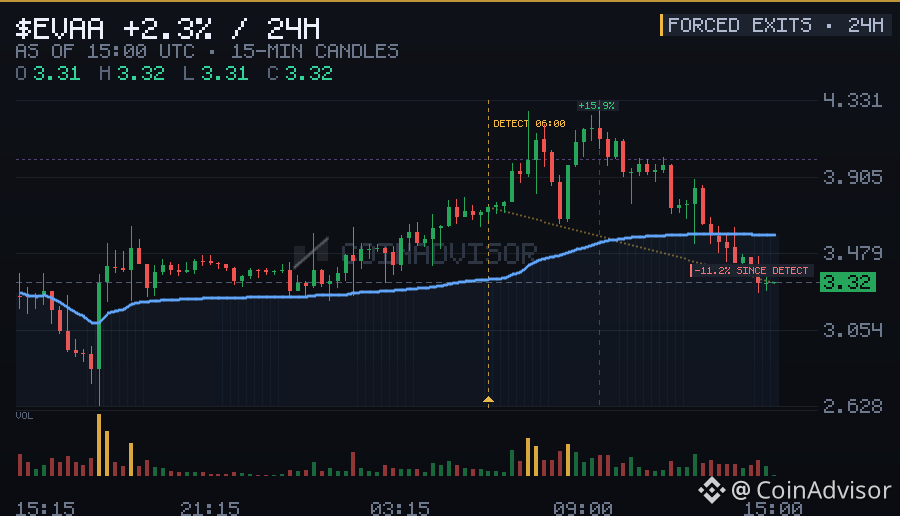
🩸 Today’s forced-exit scoreboard:
EVAA → $407K wiped (mostly shorts)
BTW → $140K wiped (mostly longs)
Rolling 24h window. Measured 15:00 UTC.
Forced flow is the only flow that can’t bluff: it must trade, now, at any price.
$EVAA $BTW #Write2Earn
🩸 Today’s forced-exit scoreboard:
EVAA → $407K wiped (mostly shorts)
BTW → $140K wiped (mostly longs)
Rolling 24h window. Measured 15:00 UTC.
Forced flow is the only flow that can’t bluff: it must trade, now, at any price.
$EVAA $BTW #Write2Earn
EVAA → $407K wiped (mostly shorts)
BTW → $140K wiped (mostly longs)
Rolling 24h window. Measured 15:00 UTC.
Forced flow is the only flow that can’t bluff: it must trade, now, at any price.
$EVAA $BTW #Write2Earn
2
·
--
Tərcüməyə bax
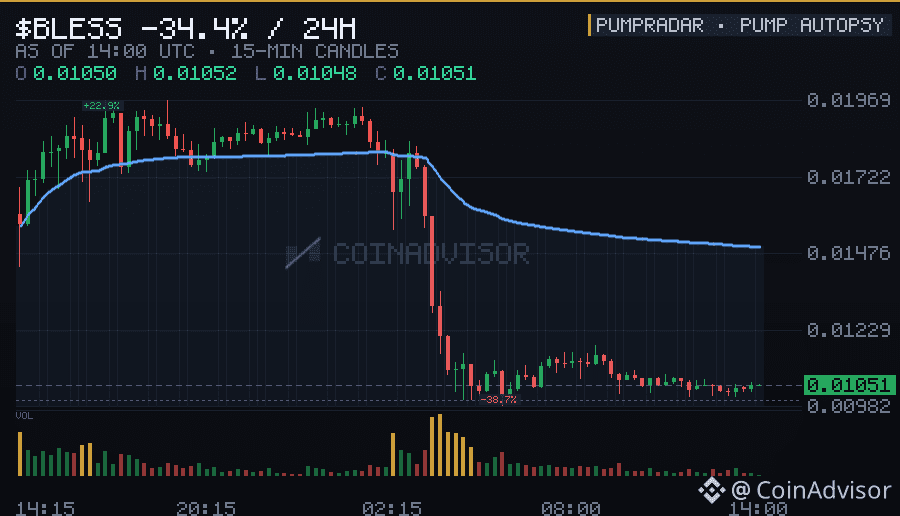
🔬 Dissection table — today’s specimen: BLESS
Detected at +8.2%/1h on $15M daily volume at the time of detection.
Peak: +93% (486 min after detection). Low after: -2%.
Open interest grew ×2.93 during the move — leverage piled in.
Liquidations on the way: $2,148,921 shorts vs $2,164,281 longs.
Classic lifecycle: vertical run, leverage chase, fade. PumpRadar had the full picture minute by minute.
$BLESS #Write2Earn
🔬 Dissection table — today’s specimen: BLESS
Detected at +8.2%/1h on $15M daily volume at the time of detection.
Peak: +93% (486 min after detection). Low after: -2%.
Open interest grew ×2.93 during the move — leverage piled in.
Liquidations on the way: $2,148,921 shorts vs $2,164,281 longs.
Classic lifecycle: vertical run, leverage chase, fade. PumpRadar had the full picture minute by minute.
$BLESS #Write2Earn
Detected at +8.2%/1h on $15M daily volume at the time of detection.
Peak: +93% (486 min after detection). Low after: -2%.
Open interest grew ×2.93 during the move — leverage piled in.
Liquidations on the way: $2,148,921 shorts vs $2,164,281 longs.
Classic lifecycle: vertical run, leverage chase, fade. PumpRadar had the full picture minute by minute.
$BLESS #Write2Earn
19
·
--
Tərcüməyə bax
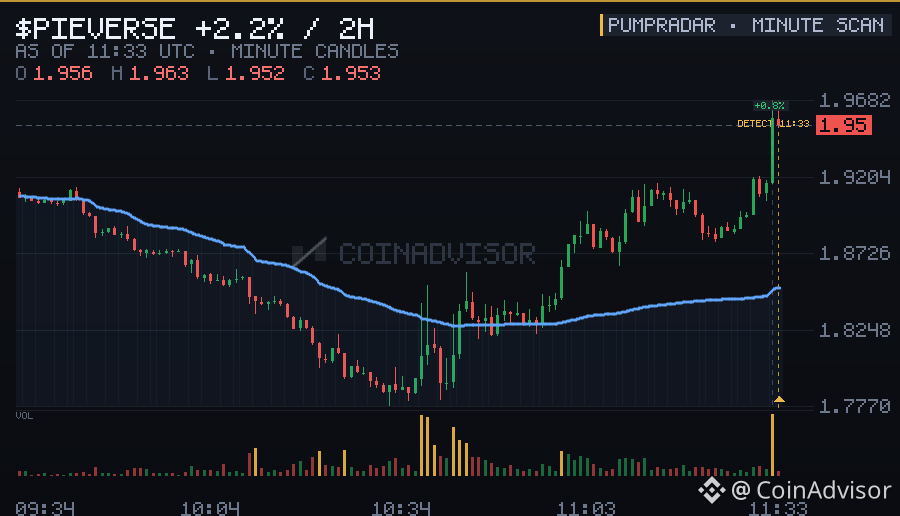
🔥 Live heat on Binance Futures this hour:
PIEVERSE +9.4% (1h) → $38M 24h volume
↳ 11th spike this month
Hourly moves from Binance 1-minute candles. Measured 11:33 UTC.
PumpRadar doesn’t follow watchlists — it follows the whole exchange, minute by minute.
$PIEVERSE #Write2Earn
🔥 Live heat on Binance Futures this hour:
PIEVERSE +9.4% (1h) → $38M 24h volume
↳ 11th spike this month
Hourly moves from Binance 1-minute candles. Measured 11:33 UTC.
PumpRadar doesn’t follow watchlists — it follows the whole exchange, minute by minute.
$PIEVERSE #Write2Earn
PIEVERSE +9.4% (1h) → $38M 24h volume
↳ 11th spike this month
Hourly moves from Binance 1-minute candles. Measured 11:33 UTC.
PumpRadar doesn’t follow watchlists — it follows the whole exchange, minute by minute.
$PIEVERSE #Write2Earn
11
·
--
Tərcüməyə bax
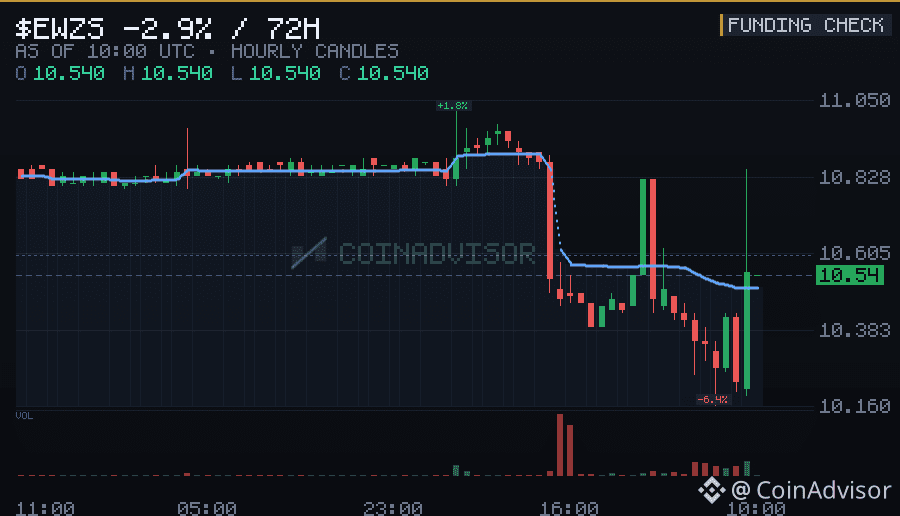
🌡️ Who’s paying to hold, right now:
EWZS -0.49% per 8h → shorts pay, crowd is short
CYPH -0.26% per 8h → shorts pay, crowd is short
Current funding rates. Measured 10:00 UTC.
Funding is the market charging rent on conviction. Extreme rent means a crowded building.
$EWZS $CYPH #Write2Earn
🌡️ Who’s paying to hold, right now:
EWZS -0.49% per 8h → shorts pay, crowd is short
CYPH -0.26% per 8h → shorts pay, crowd is short
Current funding rates. Measured 10:00 UTC.
Funding is the market charging rent on conviction. Extreme rent means a crowded building.
$EWZS $CYPH #Write2Earn
EWZS -0.49% per 8h → shorts pay, crowd is short
CYPH -0.26% per 8h → shorts pay, crowd is short
Current funding rates. Measured 10:00 UTC.
Funding is the market charging rent on conviction. Extreme rent means a crowded building.
$EWZS $CYPH #Write2Earn
2
·
--
Tərcüməyə bax
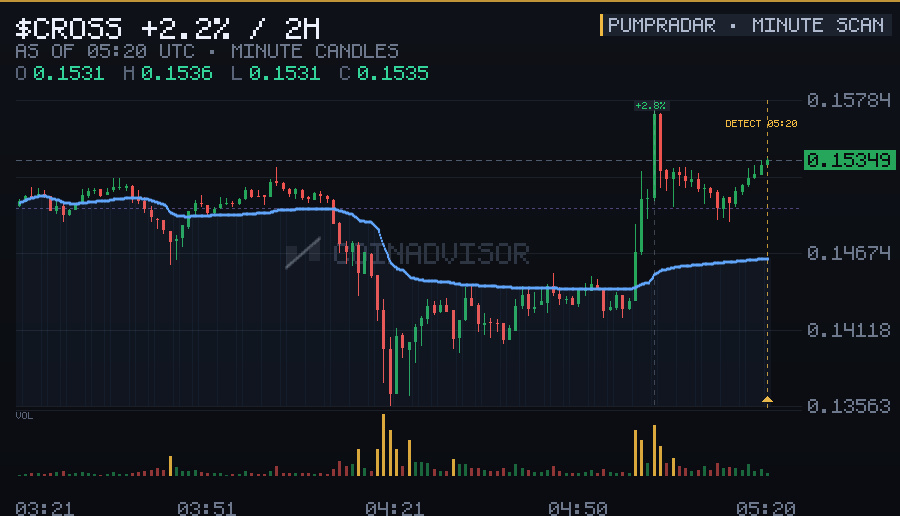
⚡ Right now, these futures pairs are running:
CROSS +12.3% (1h) → $53M 24h volume
↳ 3rd spike this month
SOPH +9.2% (1h) → $54M 24h volume
↳ 21st spike this month
Hourly moves from Binance 1-minute candles. Measured 05:20 UTC.
No watchlist needed: PumpRadar reads all Binance futures pairs every minute and ranks the heat.
$CROSS $SOPH #Write2Earn
⚡ Right now, these futures pairs are running:
CROSS +12.3% (1h) → $53M 24h volume
↳ 3rd spike this month
SOPH +9.2% (1h) → $54M 24h volume
↳ 21st spike this month
Hourly moves from Binance 1-minute candles. Measured 05:20 UTC.
No watchlist needed: PumpRadar reads all Binance futures pairs every minute and ranks the heat.
$CROSS $SOPH #Write2Earn
CROSS +12.3% (1h) → $53M 24h volume
↳ 3rd spike this month
SOPH +9.2% (1h) → $54M 24h volume
↳ 21st spike this month
Hourly moves from Binance 1-minute candles. Measured 05:20 UTC.
No watchlist needed: PumpRadar reads all Binance futures pairs every minute and ranks the heat.
$CROSS $SOPH #Write2Earn
9
·
--
Tərcüməyə bax
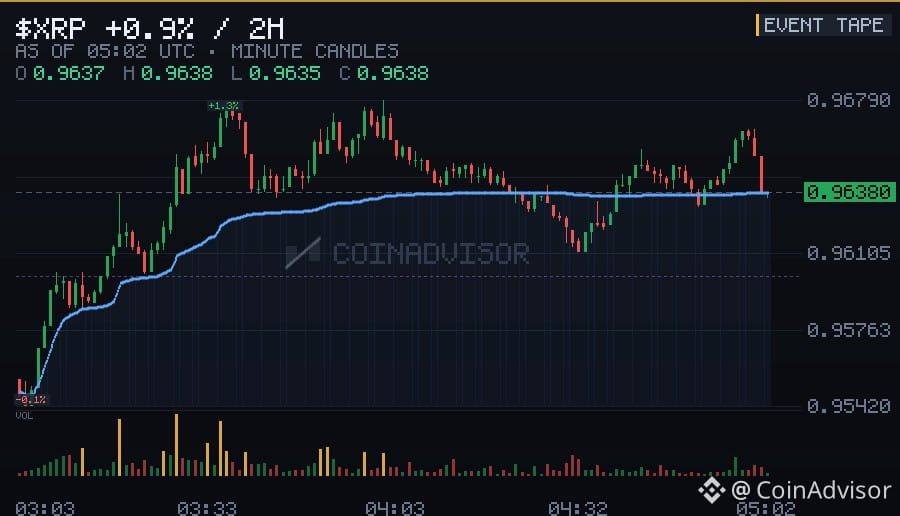
🟢 New listing headlines just hit $XRP — fresh pairs bring forced attention and fresh volatility.
Source: CoinDesk · 05:02 UTC
Headlines fade in minutes; the reaction in price and volume is the durable signal. Watching it now.
$XRP #Write2Earn
🟢 New listing headlines just hit $XRP — fresh pairs bring forced attention and fresh volatility.
Source: CoinDesk · 05:02 UTC
Headlines fade in minutes; the reaction in price and volume is the durable signal. Watching it now.
$XRP #Write2Earn
Source: CoinDesk · 05:02 UTC
Headlines fade in minutes; the reaction in price and volume is the durable signal. Watching it now.
$XRP #Write2Earn
1
·
--
Tərcüməyə bax
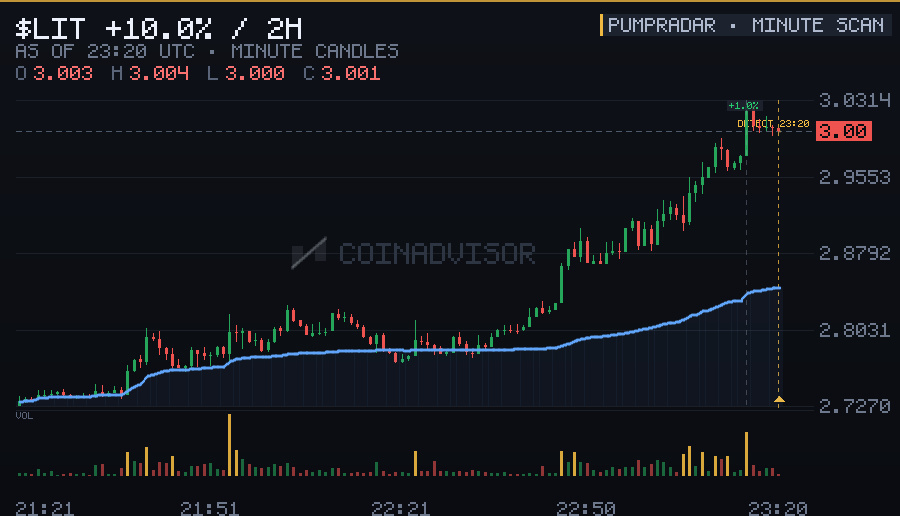
📈 Hourly momentum leaders, Binance Futures:
LIT +8.1% (1h) → $226M 24h volume
↳ 11th spike this month
Hourly moves from Binance 1-minute candles. Measured 23:20 UTC.
Ranked by heat, not by hype: the full futures board, minute by minute.
$LIT #Write2Earn
📈 Hourly momentum leaders, Binance Futures:
LIT +8.1% (1h) → $226M 24h volume
↳ 11th spike this month
Hourly moves from Binance 1-minute candles. Measured 23:20 UTC.
Ranked by heat, not by hype: the full futures board, minute by minute.
$LIT #Write2Earn
LIT +8.1% (1h) → $226M 24h volume
↳ 11th spike this month
Hourly moves from Binance 1-minute candles. Measured 23:20 UTC.
Ranked by heat, not by hype: the full futures board, minute by minute.
$LIT #Write2Earn
·
--
Tərcüməyə bax
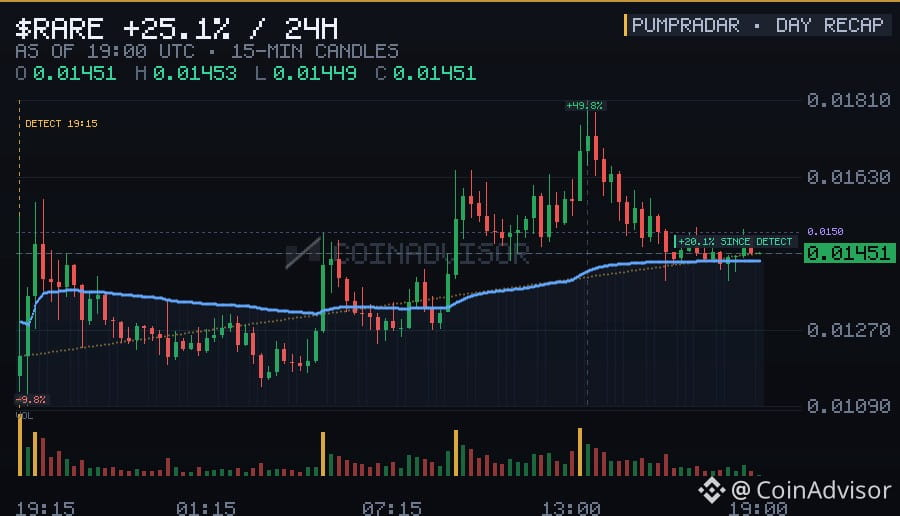
📊 The day on Binance Futures, in numbers: 19 coins went vertical inside a single hour.
Strongest hourly spikes:
RARE +62.4% in an hour → $353M 24h volume
SKR +16.0% in an hour → $76M 24h volume
HUMA +9.4% in an hour → $59M 24h volume
Rolling 24h window. Measured 19:00 UTC.
One day of tape, zero cherry-picking — the scan sees everything or it counts nothing.
$RARE $SKR $HUMA #Write2Earn
📊 The day on Binance Futures, in numbers: 19 coins went vertical inside a single hour.
Strongest hourly spikes:
RARE +62.4% in an hour → $353M 24h volume
SKR +16.0% in an hour → $76M 24h volume
HUMA +9.4% in an hour → $59M 24h volume
Rolling 24h window. Measured 19:00 UTC.
One day of tape, zero cherry-picking — the scan sees everything or it counts nothing.
$RARE $SKR $HUMA #Write2Earn
Strongest hourly spikes:
RARE +62.4% in an hour → $353M 24h volume
SKR +16.0% in an hour → $76M 24h volume
HUMA +9.4% in an hour → $59M 24h volume
Rolling 24h window. Measured 19:00 UTC.
One day of tape, zero cherry-picking — the scan sees everything or it counts nothing.
$RARE $SKR $HUMA #Write2Earn
8
·
--
Tərcüməyə bax
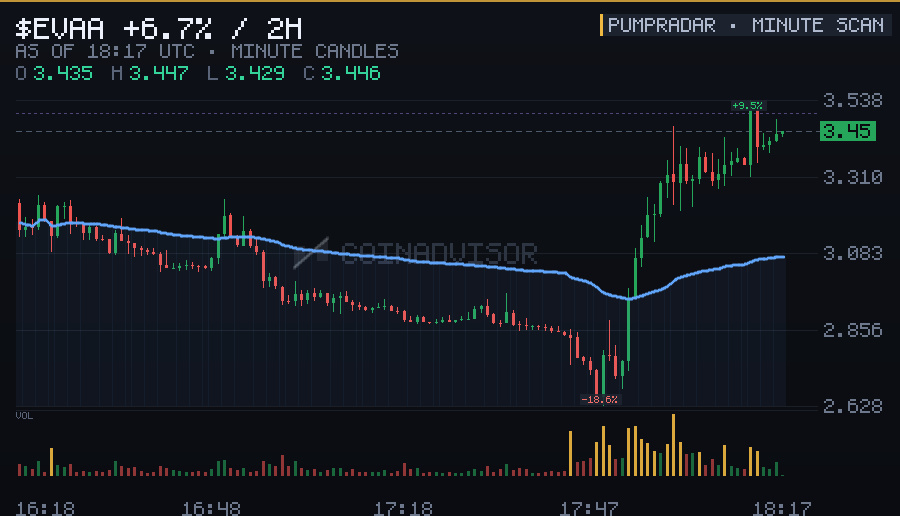
🔥 Moving right now on Binance Futures:
EVAA +18.3% (1h) → $784M 24h volume
↳ 20th spike this month
BULLA +9.1% (1h) → $60M 24h volume
↳ 24th spike this month
SPACE +7.9% (1h) → $48M 24h volume
↳ open interest ×1.36 since detection — leverage piling in
Hourly moves from Binance 1-minute candles. Measured 18:17 UTC.
Minute-level coverage of every futures pair — movers surface while they’re still moving.
$EVAA $BULLA $SPACE #Write2Earn
🔥 Moving right now on Binance Futures:
EVAA +18.3% (1h) → $784M 24h volume
↳ 20th spike this month
BULLA +9.1% (1h) → $60M 24h volume
↳ 24th spike this month
SPACE +7.9% (1h) → $48M 24h volume
↳ open interest ×1.36 since detection — leverage piling in
Hourly moves from Binance 1-minute candles. Measured 18:17 UTC.
Minute-level coverage of every futures pair — movers surface while they’re still moving.
$EVAA $BULLA $SPACE #Write2Earn
EVAA +18.3% (1h) → $784M 24h volume
↳ 20th spike this month
BULLA +9.1% (1h) → $60M 24h volume
↳ 24th spike this month
SPACE +7.9% (1h) → $48M 24h volume
↳ open interest ×1.36 since detection — leverage piling in
Hourly moves from Binance 1-minute candles. Measured 18:17 UTC.
Minute-level coverage of every futures pair — movers surface while they’re still moving.
$EVAA $BULLA $SPACE #Write2Earn
15
·
--
Tərcüməyə bax
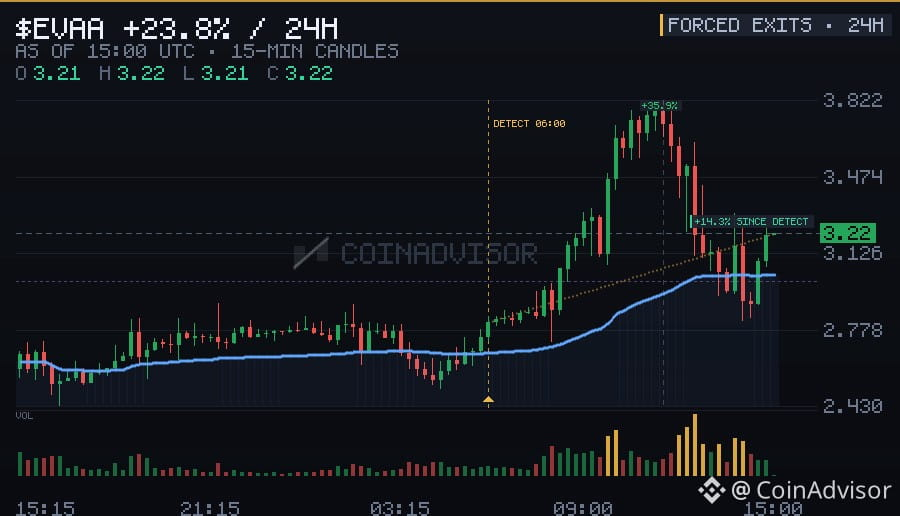
💥 The day’s biggest forced exits among active movers:
EVAA → $437K wiped (mostly shorts)
JCT → $240K wiped (mostly longs)
Rolling 24h window. Measured 15:00 UTC.
Reading the wipes: heavy short liquidations = squeeze fuel, heavy long liquidations = falling knife. Exchange feed caps at one order/second per symbol, so real totals run higher.
$EVAA $JCT #Write2Earn
💥 The day’s biggest forced exits among active movers:
EVAA → $437K wiped (mostly shorts)
JCT → $240K wiped (mostly longs)
Rolling 24h window. Measured 15:00 UTC.
Reading the wipes: heavy short liquidations = squeeze fuel, heavy long liquidations = falling knife. Exchange feed caps at one order/second per symbol, so real totals run higher.
$EVAA $JCT #Write2Earn
EVAA → $437K wiped (mostly shorts)
JCT → $240K wiped (mostly longs)
Rolling 24h window. Measured 15:00 UTC.
Reading the wipes: heavy short liquidations = squeeze fuel, heavy long liquidations = falling knife. Exchange feed caps at one order/second per symbol, so real totals run higher.
$EVAA $JCT #Write2Earn
28
·
--
Tərcüməyə bax
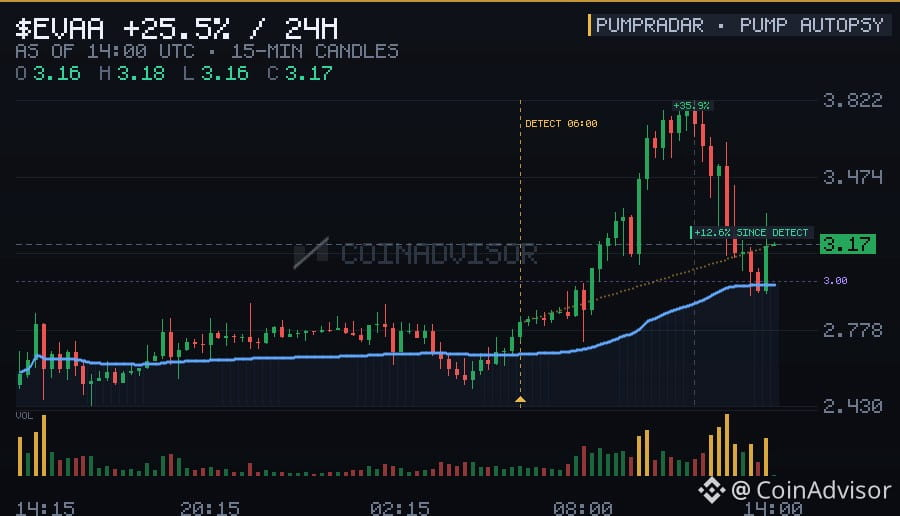
🔬 Pump autopsy: EVAA
Detected at +17.4%/1h on $11M daily volume at the time of detection.
Peak: +100% (1440 min after detection). Low after: -1%.
Open interest grew ×3.01 during the move — leverage piled in.
Liquidations on the way: $1,522,742 shorts vs $660,233 longs.
Every pump thinks it’s special. The minute data says otherwise — the pattern held again.
$EVAA #Write2Earn
🔬 Pump autopsy: EVAA
Detected at +17.4%/1h on $11M daily volume at the time of detection.
Peak: +100% (1440 min after detection). Low after: -1%.
Open interest grew ×3.01 during the move — leverage piled in.
Liquidations on the way: $1,522,742 shorts vs $660,233 longs.
Every pump thinks it’s special. The minute data says otherwise — the pattern held again.
$EVAA #Write2Earn
Detected at +17.4%/1h on $11M daily volume at the time of detection.
Peak: +100% (1440 min after detection). Low after: -1%.
Open interest grew ×3.01 during the move — leverage piled in.
Liquidations on the way: $1,522,742 shorts vs $660,233 longs.
Every pump thinks it’s special. The minute data says otherwise — the pattern held again.
$EVAA #Write2Earn
39
·
--
Tərcüməyə bax
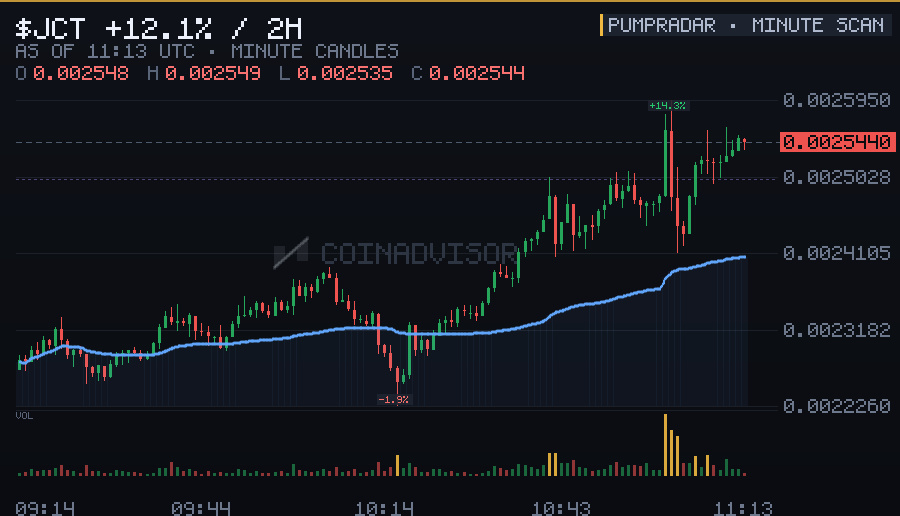
⚡ The tape is moving — hour leaders on Binance Futures:
JCT +10.7% (1h) → $227M 24h volume
↳ 44th spike this month
ARIA +9.3% (1h) → $92M 24h volume
↳ 34th spike this month
AKE +7.8% (1h) → $282M 24h volume
↳ 40th spike this month
BLESS +7.2% (1h) → $47M 24h volume
Hourly moves from Binance 1-minute candles. Measured 11:13 UTC.
By the time a mover trends on social, the tape already told PumpRadar. Minute-level, full board.
$JCT $ARIA $AKE #Write2Earn
⚡ The tape is moving — hour leaders on Binance Futures:
JCT +10.7% (1h) → $227M 24h volume
↳ 44th spike this month
ARIA +9.3% (1h) → $92M 24h volume
↳ 34th spike this month
AKE +7.8% (1h) → $282M 24h volume
↳ 40th spike this month
BLESS +7.2% (1h) → $47M 24h volume
Hourly moves from Binance 1-minute candles. Measured 11:13 UTC.
By the time a mover trends on social, the tape already told PumpRadar. Minute-level, full board.
$JCT $ARIA $AKE #Write2Earn
JCT +10.7% (1h) → $227M 24h volume
↳ 44th spike this month
ARIA +9.3% (1h) → $92M 24h volume
↳ 34th spike this month
AKE +7.8% (1h) → $282M 24h volume
↳ 40th spike this month
BLESS +7.2% (1h) → $47M 24h volume
Hourly moves from Binance 1-minute candles. Measured 11:13 UTC.
By the time a mover trends on social, the tape already told PumpRadar. Minute-level, full board.
$JCT $ARIA $AKE #Write2Earn
64
·
--
Tərcüməyə bax
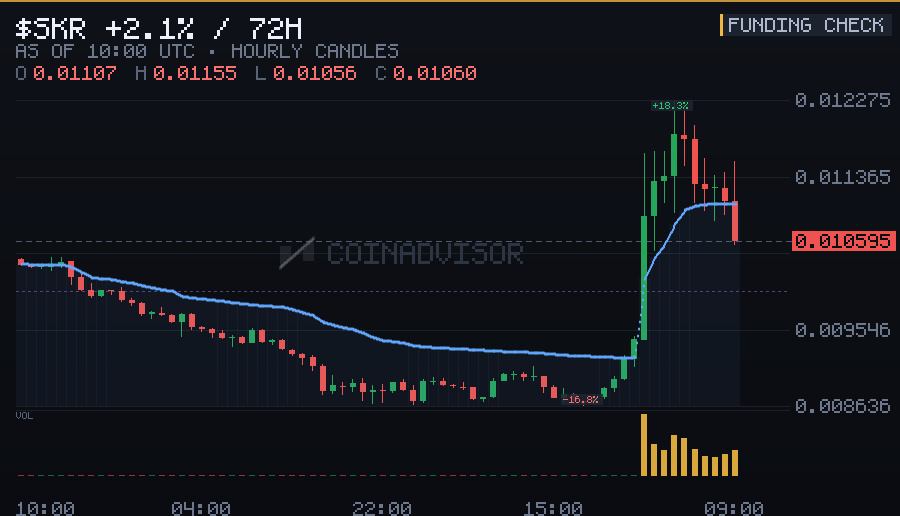
🌡️ Funding extremes right now:
SKR -1.69% per 8h → shorts pay, crowd is short
RARE -1.20% per 8h → shorts pay, crowd is short
BIRB -0.57% per 8h → shorts pay, crowd is short
KAVA -0.36% per 8h → shorts pay, crowd is short
USDEX -0.20% per 8h → shorts pay, crowd is short
Current funding rates. Measured 10:00 UTC.
The side that pays premium is the side that panics first when the tide turns.
$SKR $RARE $BIRB #Write2Earn
🌡️ Funding extremes right now:
SKR -1.69% per 8h → shorts pay, crowd is short
RARE -1.20% per 8h → shorts pay, crowd is short
BIRB -0.57% per 8h → shorts pay, crowd is short
KAVA -0.36% per 8h → shorts pay, crowd is short
USDEX -0.20% per 8h → shorts pay, crowd is short
Current funding rates. Measured 10:00 UTC.
The side that pays premium is the side that panics first when the tide turns.
$SKR $RARE $BIRB #Write2Earn
SKR -1.69% per 8h → shorts pay, crowd is short
RARE -1.20% per 8h → shorts pay, crowd is short
BIRB -0.57% per 8h → shorts pay, crowd is short
KAVA -0.36% per 8h → shorts pay, crowd is short
USDEX -0.20% per 8h → shorts pay, crowd is short
Current funding rates. Measured 10:00 UTC.
The side that pays premium is the side that panics first when the tide turns.
$SKR $RARE $BIRB #Write2Earn
65
·
--
Tərcüməyə bax
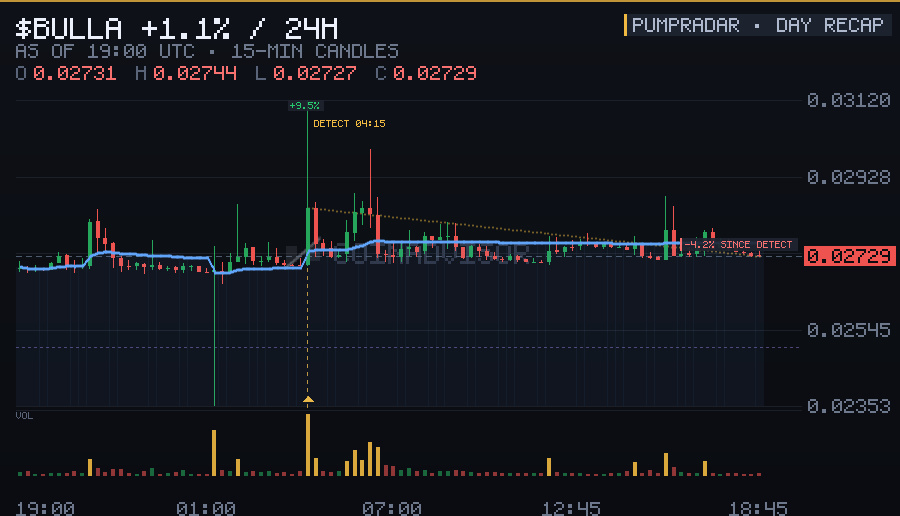
📊 Closing the book on 24 hours of futures tape: 20 coins showed pump-grade hourly momentum.
Strongest hourly spikes:
BULLA +12.7% in an hour → $28M 24h volume
H +10.8% in an hour → $15M 24h volume
SOPH +10.3% in an hour → $204M 24h volume
Rolling 24h window. Measured 19:00 UTC.
Daily stats from PumpRadar — every futures pair, every minute.
$BULLA $H $SOPH #Write2Earn
📊 Closing the book on 24 hours of futures tape: 20 coins showed pump-grade hourly momentum.
Strongest hourly spikes:
BULLA +12.7% in an hour → $28M 24h volume
H +10.8% in an hour → $15M 24h volume
SOPH +10.3% in an hour → $204M 24h volume
Rolling 24h window. Measured 19:00 UTC.
Daily stats from PumpRadar — every futures pair, every minute.
$BULLA $H $SOPH #Write2Earn
Strongest hourly spikes:
BULLA +12.7% in an hour → $28M 24h volume
H +10.8% in an hour → $15M 24h volume
SOPH +10.3% in an hour → $204M 24h volume
Rolling 24h window. Measured 19:00 UTC.
Daily stats from PumpRadar — every futures pair, every minute.
$BULLA $H $SOPH #Write2Earn
21
·
--
Tərcüməyə bax
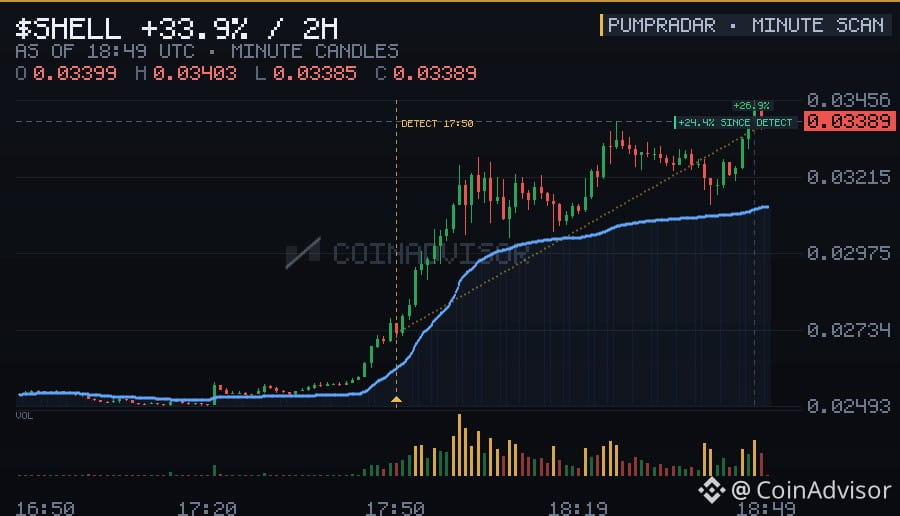
🔥 Heat check, Binance Futures:
SHELL +22.6% (1h) → $78M 24h volume
↳ open interest ×1.33 since detection — leverage piling in
AKE +7.2% (1h) → $395M 24h volume
↳ 40th spike this month
Hourly moves from Binance 1-minute candles. Measured 18:49 UTC.
Ranked by heat, not by hype: the full futures board, minute by minute.
$SHELL $AKE #Write2Earn
🔥 Heat check, Binance Futures:
SHELL +22.6% (1h) → $78M 24h volume
↳ open interest ×1.33 since detection — leverage piling in
AKE +7.2% (1h) → $395M 24h volume
↳ 40th spike this month
Hourly moves from Binance 1-minute candles. Measured 18:49 UTC.
Ranked by heat, not by hype: the full futures board, minute by minute.
$SHELL $AKE #Write2Earn
SHELL +22.6% (1h) → $78M 24h volume
↳ open interest ×1.33 since detection — leverage piling in
AKE +7.2% (1h) → $395M 24h volume
↳ 40th spike this month
Hourly moves from Binance 1-minute candles. Measured 18:49 UTC.
Ranked by heat, not by hype: the full futures board, minute by minute.
$SHELL $AKE #Write2Earn
4
·
--
Tərcüməyə bax
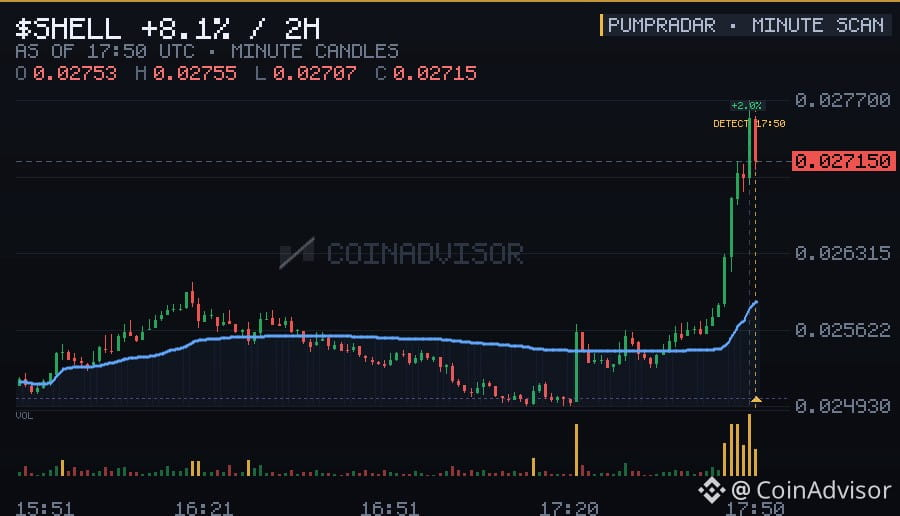
🔥 The hour’s fastest movers on Binance Futures:
SHELL +7.7% (1h) → $57M 24h volume
↳ 6th spike this month
Hourly moves from Binance 1-minute candles. Measured 17:50 UTC.
Minute-level coverage of every futures pair — movers surface while they’re still moving.
$SHELL #Write2Earn
🔥 The hour’s fastest movers on Binance Futures:
SHELL +7.7% (1h) → $57M 24h volume
↳ 6th spike this month
Hourly moves from Binance 1-minute candles. Measured 17:50 UTC.
Minute-level coverage of every futures pair — movers surface while they’re still moving.
$SHELL #Write2Earn
SHELL +7.7% (1h) → $57M 24h volume
↳ 6th spike this month
Hourly moves from Binance 1-minute candles. Measured 17:50 UTC.
Minute-level coverage of every futures pair — movers surface while they’re still moving.
$SHELL #Write2Earn
3
·
--
Tərcüməyə bax
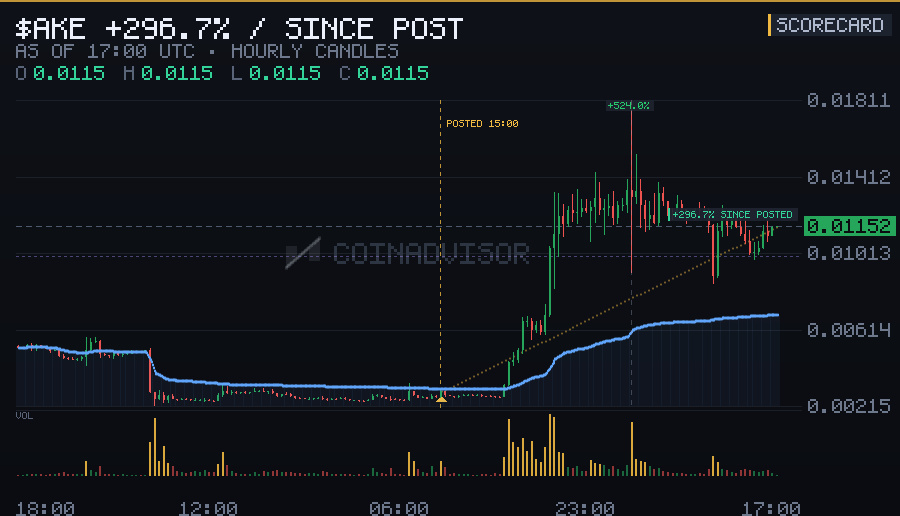
🎯 Grading our own homework — the week’s flagged movers:
AKE — flagged mid-move at +8.7%/1h → peaked +524.0% after the post · now +296.7%
ARIA — flagged mid-move at +9.1%/1h → peaked +83.6% after the post · now +77.3%
SOPH — flagged mid-move at +7.5%/1h → peaked +73.7% after the post · now -19.0%
IDOL — flagged mid-move at +10.9%/1h → peaked +49.4% after the post · now -25.3%
KGEN — flagged mid-move at +9.6%/1h → peaked +20.5% after the post · now -15.4%
ON — flagged mid-move at +8.4%/1h → peaked +15.6% after the post · now +10.2%
SNXX — flagged mid-move at +6.6%/1h → peaked +10.4% after the post · now -12.4%
NVDL — flagged mid-move at +14.8%/1h → peaked +9.9% after the post · now -3.0%
AGT — flagged mid-move at +18.4%/1h → peaked +4.0% after the post · now -61.5%
BTW — flagged mid-move at +5.8%/1h → peaked -2.0% after the post · now -48.8%
Scoreboard: 6/10 truly ran after the flag (peak ≥ +15%), 7/10 have since fallen below the flag price. Momentum is real — and so is the fade. We publish both.
Wins and losses both stay on the record — a radar you can’t audit is just marketing.
$AKE $ARIA $SOPH #Write2Earn
🎯 Grading our own homework — the week’s flagged movers:
AKE — flagged mid-move at +8.7%/1h → peaked +524.0% after the post · now +296.7%
ARIA — flagged mid-move at +9.1%/1h → peaked +83.6% after the post · now +77.3%
SOPH — flagged mid-move at +7.5%/1h → peaked +73.7% after the post · now -19.0%
IDOL — flagged mid-move at +10.9%/1h → peaked +49.4% after the post · now -25.3%
KGEN — flagged mid-move at +9.6%/1h → peaked +20.5% after the post · now -15.4%
ON — flagged mid-move at +8.4%/1h → peaked +15.6% after the post · now +10.2%
SNXX — flagged mid-move at +6.6%/1h → peaked +10.4% after the post · now -12.4%
NVDL — flagged mid-move at +14.8%/1h → peaked +9.9% after the post · now -3.0%
AGT — flagged mid-move at +18.4%/1h → peaked +4.0% after the post · now -61.5%
BTW — flagged mid-move at +5.8%/1h → peaked -2.0% after the post · now -48.8%
Scoreboard: 6/10 truly ran after the flag (peak ≥ +15%), 7/10 have since fallen below the flag price. Momentum is real — and so is the fade. We publish both.
Wins and losses both stay on the record — a radar you can’t audit is just marketing.
$AKE $ARIA $SOPH #Write2Earn
AKE — flagged mid-move at +8.7%/1h → peaked +524.0% after the post · now +296.7%
ARIA — flagged mid-move at +9.1%/1h → peaked +83.6% after the post · now +77.3%
SOPH — flagged mid-move at +7.5%/1h → peaked +73.7% after the post · now -19.0%
IDOL — flagged mid-move at +10.9%/1h → peaked +49.4% after the post · now -25.3%
KGEN — flagged mid-move at +9.6%/1h → peaked +20.5% after the post · now -15.4%
ON — flagged mid-move at +8.4%/1h → peaked +15.6% after the post · now +10.2%
SNXX — flagged mid-move at +6.6%/1h → peaked +10.4% after the post · now -12.4%
NVDL — flagged mid-move at +14.8%/1h → peaked +9.9% after the post · now -3.0%
AGT — flagged mid-move at +18.4%/1h → peaked +4.0% after the post · now -61.5%
BTW — flagged mid-move at +5.8%/1h → peaked -2.0% after the post · now -48.8%
Scoreboard: 6/10 truly ran after the flag (peak ≥ +15%), 7/10 have since fallen below the flag price. Momentum is real — and so is the fade. We publish both.
Wins and losses both stay on the record — a radar you can’t audit is just marketing.
$AKE $ARIA $SOPH #Write2Earn
17
·
--
Tərcüməyə bax
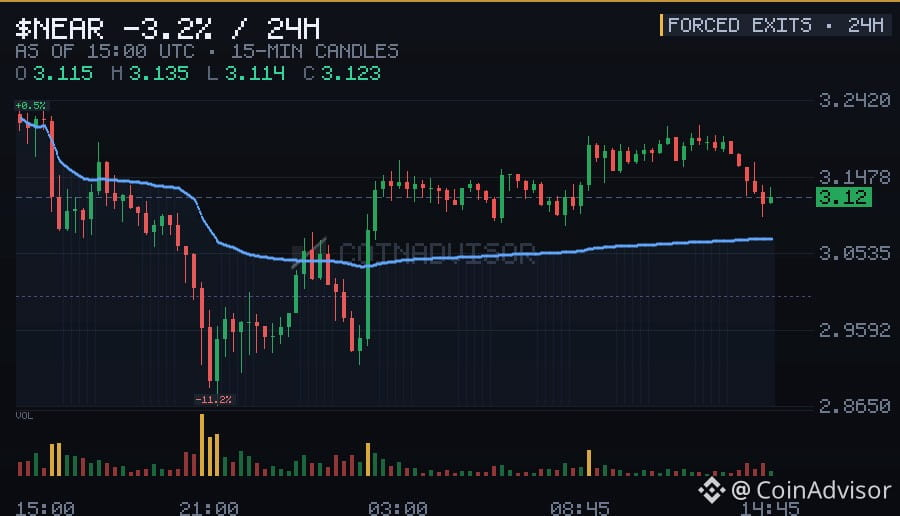
💥 Liquidation hotspots, last 24h (on pumping coins):
NEAR → $3.4M wiped (mostly longs)
UNI → $1.5M wiped (mostly longs)
HYPE → $1.1M wiped (mostly longs)
ENA → $1.1M wiped (mostly longs)
Rolling 24h window. Measured 15:00 UTC.
Reading the wipes: heavy short liquidations = squeeze fuel, heavy long liquidations = falling knife. Exchange feed caps at one order/second per symbol, so real totals run higher.
$NEAR $UNI $HYPE #Write2Earn
💥 Liquidation hotspots, last 24h (on pumping coins):
NEAR → $3.4M wiped (mostly longs)
UNI → $1.5M wiped (mostly longs)
HYPE → $1.1M wiped (mostly longs)
ENA → $1.1M wiped (mostly longs)
Rolling 24h window. Measured 15:00 UTC.
Reading the wipes: heavy short liquidations = squeeze fuel, heavy long liquidations = falling knife. Exchange feed caps at one order/second per symbol, so real totals run higher.
$NEAR $UNI $HYPE #Write2Earn
NEAR → $3.4M wiped (mostly longs)
UNI → $1.5M wiped (mostly longs)
HYPE → $1.1M wiped (mostly longs)
ENA → $1.1M wiped (mostly longs)
Rolling 24h window. Measured 15:00 UTC.
Reading the wipes: heavy short liquidations = squeeze fuel, heavy long liquidations = falling knife. Exchange feed caps at one order/second per symbol, so real totals run higher.
$NEAR $UNI $HYPE #Write2Earn
8
·
--
Tərcüməyə bax
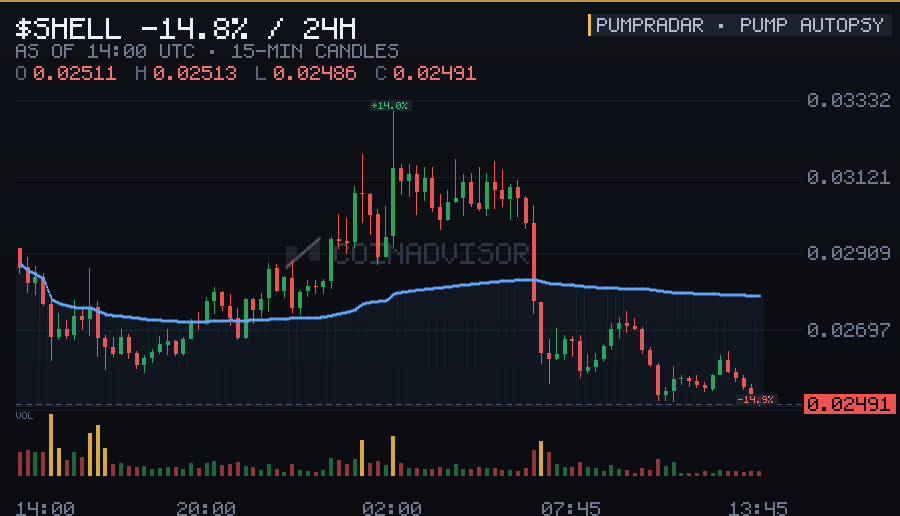
🔬 Pump autopsy: SHELL
Detected at +16.5%/1h on $10M daily volume at the time of detection.
Peak: +99% (204 min after detection). Low after: 0%.
Open interest grew ×3.21 during the move — leverage piled in.
Liquidations on the way: $851,398 shorts vs $468,378 longs.
The names change nightly; the lifecycle doesn’t. PumpRadar archives every act.
$SHELL #Write2Earn
🔬 Pump autopsy: SHELL
Detected at +16.5%/1h on $10M daily volume at the time of detection.
Peak: +99% (204 min after detection). Low after: 0%.
Open interest grew ×3.21 during the move — leverage piled in.
Liquidations on the way: $851,398 shorts vs $468,378 longs.
The names change nightly; the lifecycle doesn’t. PumpRadar archives every act.
$SHELL #Write2Earn
Detected at +16.5%/1h on $10M daily volume at the time of detection.
Peak: +99% (204 min after detection). Low after: 0%.
Open interest grew ×3.21 during the move — leverage piled in.
Liquidations on the way: $851,398 shorts vs $468,378 longs.
The names change nightly; the lifecycle doesn’t. PumpRadar archives every act.
$SHELL #Write2Earn
33
·
--
Tərcüməyə bax
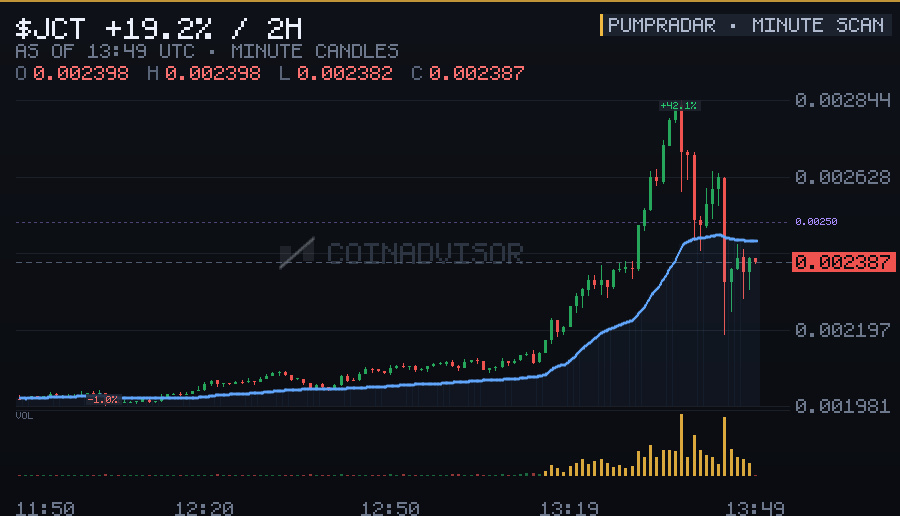
🔥 Live heat on Binance Futures this hour:
JCT +15.2% (1h) → $114M 24h volume
↳ 42nd spike this month
IDOL +8.0% (1h) → $41M 24h volume
↳ 32nd spike this month
Hourly moves from Binance 1-minute candles. Measured 13:49 UTC.
Caught mid-move, not after it — PumpRadar reads the entire futures board every sixty seconds.
$JCT $IDOL #Write2Earn
🔥 Live heat on Binance Futures this hour:
JCT +15.2% (1h) → $114M 24h volume
↳ 42nd spike this month
IDOL +8.0% (1h) → $41M 24h volume
↳ 32nd spike this month
Hourly moves from Binance 1-minute candles. Measured 13:49 UTC.
Caught mid-move, not after it — PumpRadar reads the entire futures board every sixty seconds.
$JCT $IDOL #Write2Earn
JCT +15.2% (1h) → $114M 24h volume
↳ 42nd spike this month
IDOL +8.0% (1h) → $41M 24h volume
↳ 32nd spike this month
Hourly moves from Binance 1-minute candles. Measured 13:49 UTC.
Caught mid-move, not after it — PumpRadar reads the entire futures board every sixty seconds.
$JCT $IDOL #Write2Earn
40
Daha çox kontent araşdırmaq üçün daxil olun
Binance Square-də qlobal kriptovalyuta istifadəçilərinə qoşulun
⚡️ Kriptovalyuta haqqında ən son və faydalı məlumatları əldə edin.
💬 Dünyanın ən böyük kriptovalyuta birjası tərəfindən etibar edilir.
👍 Doğrulanmış yaradıcılardan gələn real məlumatları kəşf edin.
E-poçt/Telefon nömrəsi
Trenddə olan mövzular
NvidiaEarningsTonight:AIStocks’NextMove?
45,841 baxış
Müzakirə edir: 712
Nvidia-nın maliyyə nəticələrinin açıqlanacağı gün: müvəqqəti baş direktorun ilk çıxışı — süni intellekt hekayəsi davam gətirə biləcəkmi?
Binance News
·17 bəyənmə
·7.8k baxış
A Packed Week of Earnings and Data Tests Markets
115,296 baxış
Müzakirə edir: 576
AnthropicIPOTestsInvestorAppetiteForAI
250,178 baxış
Müzakirə edir: 2,446