

Bryne B
28 Paylaşımlar

Bryne B
Şikayət et
İstifadəçini blokla
Açıq ticarət
Təsadüfi treyder
3.3 il
16 İzlənilir
41 İzləyicilər
21 Bəyəndi
Postlar
Portfel
Hamısı
Sitatlar
·
--
Tərcüməyə bax
🚨LATEST: Heads of AI firms warn the UN Security Council that humans could LOSE CONTROL of the future to AI.
OpenAI CEO says AI could advance so quickly that people can no longer understand what is happening or intervene when needed.
“We have unilaterally slowed down in the past. We will do so in the future,” says Sam Altman
Anthropic CEO Dario Amodei echoed the warning, saying poorly managed AI could pose "a risk to humanity as a whole."
“This moment calls for extreme care,” Altman adds.
🚨LATEST: Heads of AI firms warn the UN Security Council that humans could LOSE CONTROL of the future to AI.
OpenAI CEO says AI could advance so quickly that people can no longer understand what is happening or intervene when needed.
“We have unilaterally slowed down in the past. We will do so in the future,” says Sam Altman
Anthropic CEO Dario Amodei echoed the warning, saying poorly managed AI could pose "a risk to humanity as a whole."
“This moment calls for extreme care,” Altman adds.
OpenAI CEO says AI could advance so quickly that people can no longer understand what is happening or intervene when needed.
“We have unilaterally slowed down in the past. We will do so in the future,” says Sam Altman
Anthropic CEO Dario Amodei echoed the warning, saying poorly managed AI could pose "a risk to humanity as a whole."
“This moment calls for extreme care,” Altman adds.
70
·
--
Tərcüməyə bax
.
At 10:00, price suddenly expanded from the flat 1.0000 baseline up to 1.0007, then immediately plunged down to test 0.9994 within the same candle window before instantly snapping back to equilibrium. The entire move was accompanied by a massive volume spike reaching 4.70K which dwarf the surrounding volume bars
Current Price: 1.0000 USDT
24H Change: -0.02%
24H High: 1.0007 USDT
24H Low: 0.9994 USDT
24H Range: 0.0013 USDT (13 bps total spread)
24H Turnover: ~$43.34M USDT
Volume: Current 15m volume sits around 4.70K USDE.
Moving Average Volume Comparison: MA5 Volume is sitting at 23.19K, while MA10 Volume sits at 200.13K. Current volume is roughly 79.7% below the MA5 volume average, showing complete volume drop-off and exhaustion following the spike.
Structure: Compression & Mean Reversion. The chart exhibits absolute horizontal stability with a localized liquidity sweep.
Moving Averages: MA7 (1.0000), MA14 (1.0000), and MA28 (1.0000) have all flattened and merged perfectly into 1.0000. This cluster indicates zero trend momentum and complete equilibrium across short-to-medium intraday horizons.
Rapid arbitrage response: The dip to 0.9994 was aggressively bought up back to the 1.0000 peg instantly, proving strong market maker depth.
High overall turnover ($43.34M) ensuring tight spreads and zero slippage under normal execution.
Volume has completely dried up post-spike (sitting nearly 80% below MA5 volume), offering no momentum.
Resistance: 1.0007 (24H High / Liquidity Wick)
Support: 0.9994 (24H Low / Rejection Floor)
Equilibrium: 1.0000 (Merged MA7, MA14, MA28 alignment
Decision: HARD PASS / NO TRADE
Reasoning: Trading USDE/USDT for directional profit makes no structural sense. The R:R is completely unviable—risking a potential depeg shock down to 0.9994 to target a fraction of a basis point return back to 1.0000 yields an unfavorable trade setup.
Is this temporary wick down to 0.9994 just an isolated market-order slip on Bybit, or are you noticing similar micro-liquidity sweeps across other synthetic stablecoin order books today?
#Bybit #CryptoTrading #USDE
.
At 10:00, price suddenly expanded from the flat 1.0000 baseline up to 1.0007, then immediately plunged down to test 0.9994 within the same candle window before instantly snapping back to equilibrium. The entire move was accompanied by a massive volume spike reaching 4.70K which dwarf the surrounding volume bars
Current Price: 1.0000 USDT
24H Change: -0.02%
24H High: 1.0007 USDT
24H Low: 0.9994 USDT
24H Range: 0.0013 USDT (13 bps total spread)
24H Turnover: ~$43.34M USDT
Volume: Current 15m volume sits around 4.70K USDE.
Moving Average Volume Comparison: MA5 Volume is sitting at 23.19K, while MA10 Volume sits at 200.13K. Current volume is roughly 79.7% below the MA5 volume average, showing complete volume drop-off and exhaustion following the spike.
Structure: Compression & Mean Reversion. The chart exhibits absolute horizontal stability with a localized liquidity sweep.
Moving Averages: MA7 (1.0000), MA14 (1.0000), and MA28 (1.0000) have all flattened and merged perfectly into 1.0000. This cluster indicates zero trend momentum and complete equilibrium across short-to-medium intraday horizons.
Rapid arbitrage response: The dip to 0.9994 was aggressively bought up back to the 1.0000 peg instantly, proving strong market maker depth.
High overall turnover ($43.34M) ensuring tight spreads and zero slippage under normal execution.
Volume has completely dried up post-spike (sitting nearly 80% below MA5 volume), offering no momentum.
Resistance: 1.0007 (24H High / Liquidity Wick)
Support: 0.9994 (24H Low / Rejection Floor)
Equilibrium: 1.0000 (Merged MA7, MA14, MA28 alignment
Decision: HARD PASS / NO TRADE
Reasoning: Trading USDE/USDT for directional profit makes no structural sense. The R:R is completely unviable—risking a potential depeg shock down to 0.9994 to target a fraction of a basis point return back to 1.0000 yields an unfavorable trade setup.
Is this temporary wick down to 0.9994 just an isolated market-order slip on Bybit, or are you noticing similar micro-liquidity sweeps across other synthetic stablecoin order books today?
#Bybit #CryptoTrading #USDE
At 10:00, price suddenly expanded from the flat 1.0000 baseline up to 1.0007, then immediately plunged down to test 0.9994 within the same candle window before instantly snapping back to equilibrium. The entire move was accompanied by a massive volume spike reaching 4.70K which dwarf the surrounding volume bars
Current Price: 1.0000 USDT
24H Change: -0.02%
24H High: 1.0007 USDT
24H Low: 0.9994 USDT
24H Range: 0.0013 USDT (13 bps total spread)
24H Turnover: ~$43.34M USDT
Volume: Current 15m volume sits around 4.70K USDE.
Moving Average Volume Comparison: MA5 Volume is sitting at 23.19K, while MA10 Volume sits at 200.13K. Current volume is roughly 79.7% below the MA5 volume average, showing complete volume drop-off and exhaustion following the spike.
Structure: Compression & Mean Reversion. The chart exhibits absolute horizontal stability with a localized liquidity sweep.
Moving Averages: MA7 (1.0000), MA14 (1.0000), and MA28 (1.0000) have all flattened and merged perfectly into 1.0000. This cluster indicates zero trend momentum and complete equilibrium across short-to-medium intraday horizons.
Rapid arbitrage response: The dip to 0.9994 was aggressively bought up back to the 1.0000 peg instantly, proving strong market maker depth.
High overall turnover ($43.34M) ensuring tight spreads and zero slippage under normal execution.
Volume has completely dried up post-spike (sitting nearly 80% below MA5 volume), offering no momentum.
Resistance: 1.0007 (24H High / Liquidity Wick)
Support: 0.9994 (24H Low / Rejection Floor)
Equilibrium: 1.0000 (Merged MA7, MA14, MA28 alignment
Decision: HARD PASS / NO TRADE
Reasoning: Trading USDE/USDT for directional profit makes no structural sense. The R:R is completely unviable—risking a potential depeg shock down to 0.9994 to target a fraction of a basis point return back to 1.0000 yields an unfavorable trade setup.
Is this temporary wick down to 0.9994 just an isolated market-order slip on Bybit, or are you noticing similar micro-liquidity sweeps across other synthetic stablecoin order books today?
#Bybit #CryptoTrading #USDE
123
·
--
Tərcüməyə bax
🚀 BTCUSDT Update! 📈
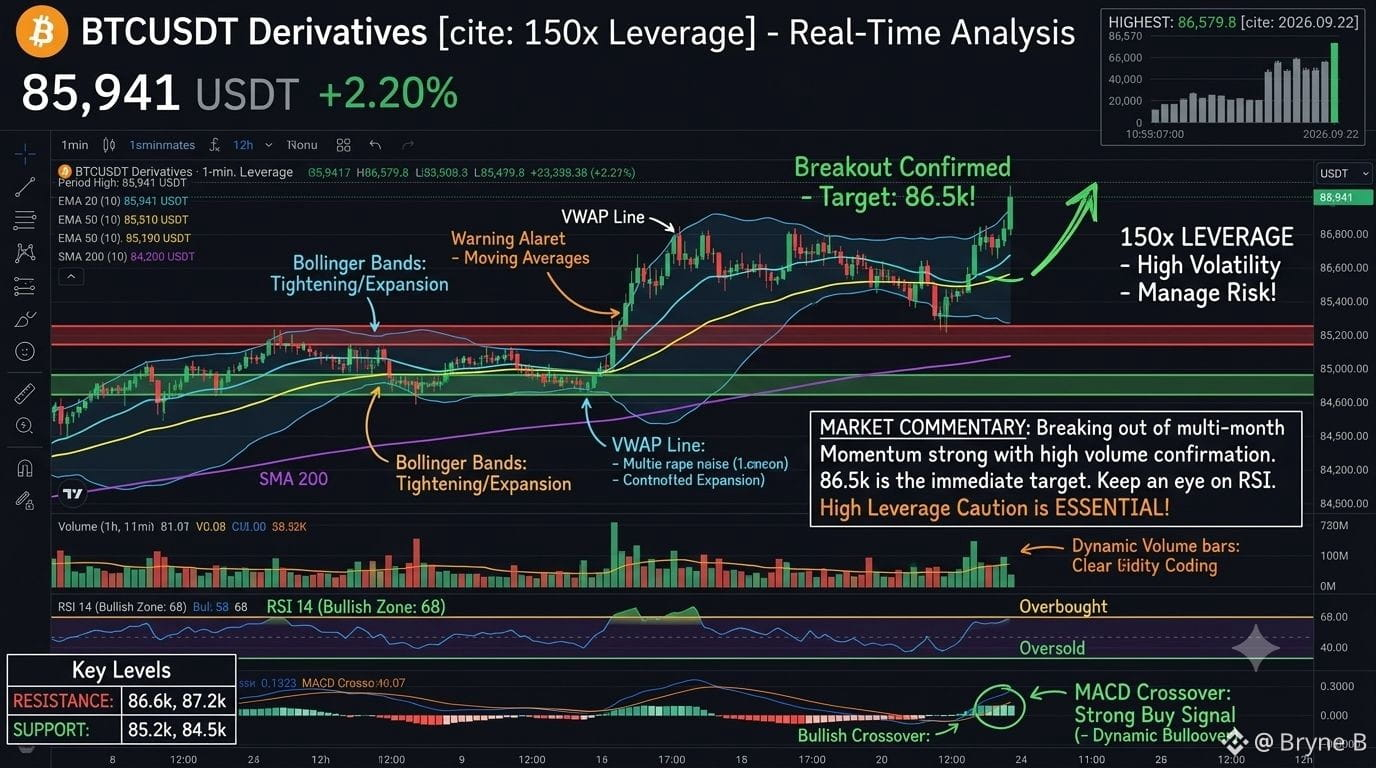
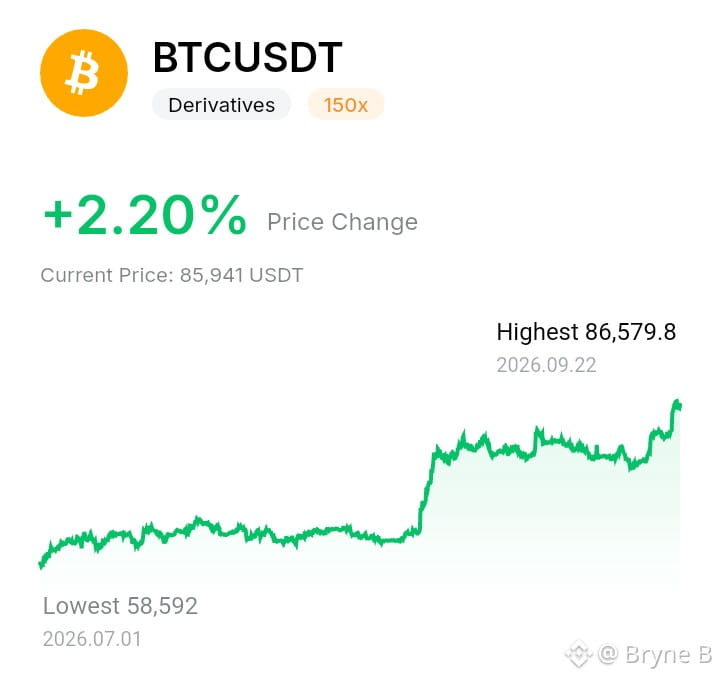
$BTC Bitcoin is showing strong upward momentum! Here are the key highlights from the current price chart:
Current Price: 85,941 USDT (+2.20% Price Change)
Trading Pair: BTCUSDT (Derivatives, 150x Leverage)
Period High: 86,579.8 USDT (Recorded on September 22, 2026)
Period Low: 58,592 USDT (Recorded on July 01, 2026)
After consolidating near the 58k–60k range earlier this summer, Bitcoin staged a massive breakout and is now pressing toward new local highs around $86.5k.
Are you holding long, taking profits, or watching from the sidelines? Let us know your target price for BTC! 💬👇
(Disclaimer: High-leverage derivatives trading like 150x carries extreme risk. Always manage your risk carefully and trade responsibly!)
🚀 BTCUSDT Update! 📈
$BTC Bitcoin is showing strong upward momentum! Here are the key highlights from the current price chart:
Current Price: 85,941 USDT (+2.20% Price Change)
Trading Pair: BTCUSDT (Derivatives, 150x Leverage)
Period High: 86,579.8 USDT (Recorded on September 22, 2026)
Period Low: 58,592 USDT (Recorded on July 01, 2026)
After consolidating near the 58k–60k range earlier this summer, Bitcoin staged a massive breakout and is now pressing toward new local highs around $86.5k.
Are you holding long, taking profits, or watching from the sidelines? Let us know your target price for BTC! 💬👇
(Disclaimer: High-leverage derivatives trading like 150x carries extreme risk. Always manage your risk carefully and trade responsibly!)
$BTC Bitcoin is showing strong upward momentum! Here are the key highlights from the current price chart:
Current Price: 85,941 USDT (+2.20% Price Change)
Trading Pair: BTCUSDT (Derivatives, 150x Leverage)
Period High: 86,579.8 USDT (Recorded on September 22, 2026)
Period Low: 58,592 USDT (Recorded on July 01, 2026)
After consolidating near the 58k–60k range earlier this summer, Bitcoin staged a massive breakout and is now pressing toward new local highs around $86.5k.
Are you holding long, taking profits, or watching from the sidelines? Let us know your target price for BTC! 💬👇
(Disclaimer: High-leverage derivatives trading like 150x carries extreme risk. Always manage your risk carefully and trade responsibly!)
43
·
--
Artım
Tərcüməyə bax
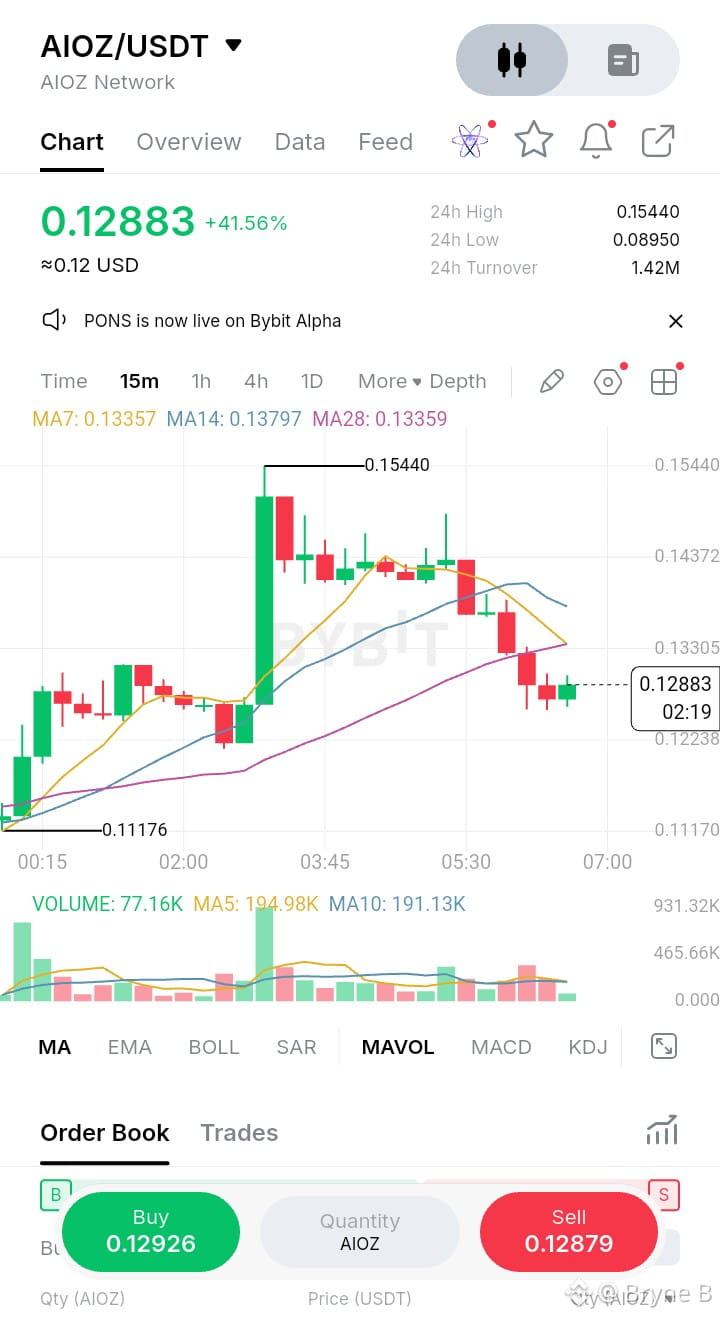
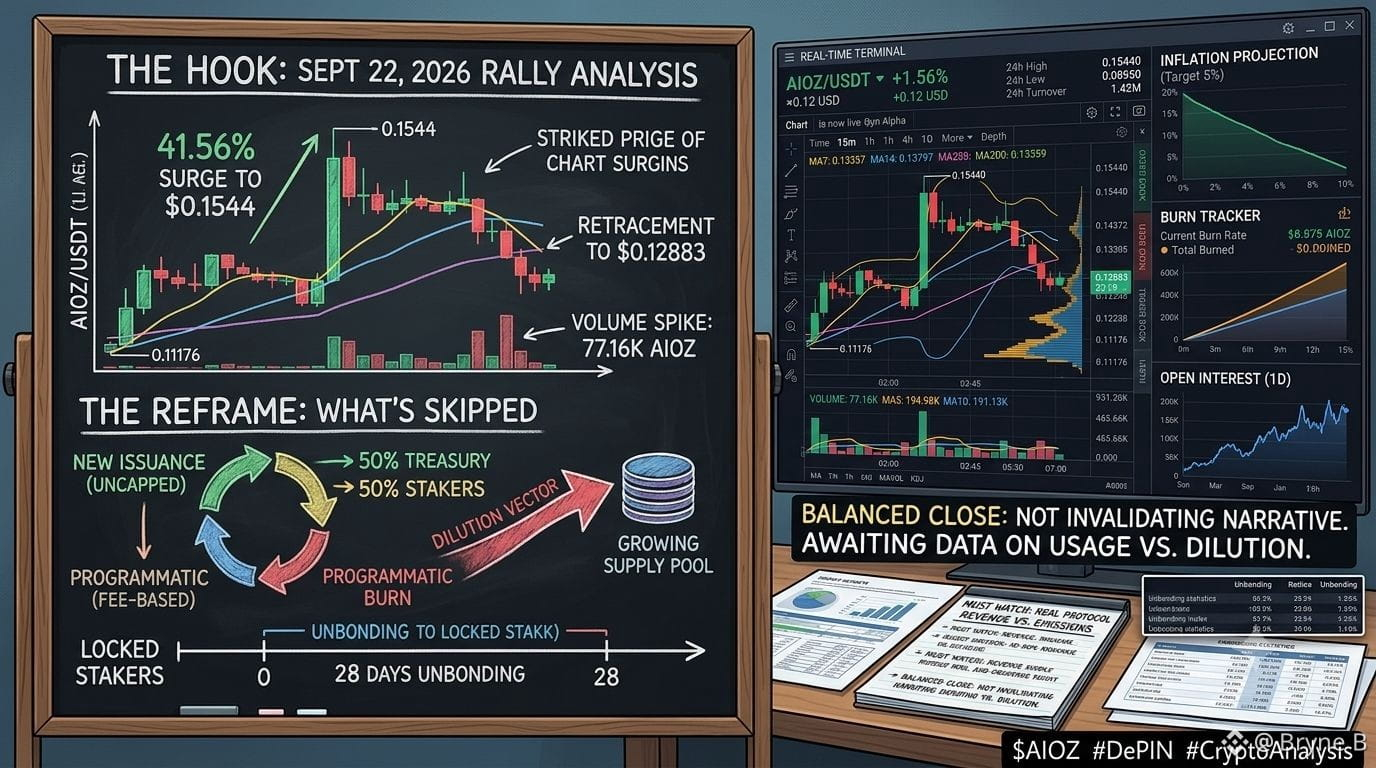
On September 22, 2026, $AIOZ Network surged +41.56% to reach a 24-hour peak of $0.1544 before retracing to $0.1288 on Bybit. The move coincided with a volume spike of 77.16K AIOZ against an average 10-period moving average volume of 191.13K. Market coverage framing the token as a top decentralized AI infrastructure play continues to highlight its target dilution reduction to a 5% inflation rate by late 2026.
Here is the part that gets skipped: supply is not capped. While 50% of base transaction fees are programmatically burned, new issuance is split directly 50/50 between staking validators and the project treasury. Furthermore, locked stakers face a strict 28-day unbonding period. The surface metric treats decreasing inflation as equivalent to net deflation, masking the reality that usage-based fee burns must consistently outpace programmatic emissions to offset continuous dilution.
That gap matters because it highlights a recurring DePIN incentive design: relying on treasury-funded inflation to subsidize node operators while liquid spot trading absorbs the sell pressure. When spot price volatility accelerates—such as today's 41.56% move on Bybit—unstaked holders carry immediate downside exposure while stakers remain locked behind the 28-day queue.
None of this means the underlying utility narrative is invalid. It means token performance remains tethered to whether real network usage fees can scale fast enough to absorb daily supply growth. Will verifiable protocol revenue eventually cross the threshold of daily inflation, or will treasury rewards continue to drive token supply faster than on-chain demand burns it?
$AIOZ #DePIN #CryptoAnalysis
On September 22, 2026, $AIOZ Network surged +41.56% to reach a 24-hour peak of $0.1544 before retracing to $0.1288 on Bybit. The move coincided with a volume spike of 77.16K AIOZ against an average 10-period moving average volume of 191.13K. Market coverage framing the token as a top decentralized AI infrastructure play continues to highlight its target dilution reduction to a 5% inflation rate by late 2026.
Here is the part that gets skipped: supply is not capped. While 50% of base transaction fees are programmatically burned, new issuance is split directly 50/50 between staking validators and the project treasury. Furthermore, locked stakers face a strict 28-day unbonding period. The surface metric treats decreasing inflation as equivalent to net deflation, masking the reality that usage-based fee burns must consistently outpace programmatic emissions to offset continuous dilution.
That gap matters because it highlights a recurring DePIN incentive design: relying on treasury-funded inflation to subsidize node operators while liquid spot trading absorbs the sell pressure. When spot price volatility accelerates—such as today's 41.56% move on Bybit—unstaked holders carry immediate downside exposure while stakers remain locked behind the 28-day queue.
None of this means the underlying utility narrative is invalid. It means token performance remains tethered to whether real network usage fees can scale fast enough to absorb daily supply growth. Will verifiable protocol revenue eventually cross the threshold of daily inflation, or will treasury rewards continue to drive token supply faster than on-chain demand burns it?
$AIOZ #DePIN #CryptoAnalysis
Here is the part that gets skipped: supply is not capped. While 50% of base transaction fees are programmatically burned, new issuance is split directly 50/50 between staking validators and the project treasury. Furthermore, locked stakers face a strict 28-day unbonding period. The surface metric treats decreasing inflation as equivalent to net deflation, masking the reality that usage-based fee burns must consistently outpace programmatic emissions to offset continuous dilution.
That gap matters because it highlights a recurring DePIN incentive design: relying on treasury-funded inflation to subsidize node operators while liquid spot trading absorbs the sell pressure. When spot price volatility accelerates—such as today's 41.56% move on Bybit—unstaked holders carry immediate downside exposure while stakers remain locked behind the 28-day queue.
None of this means the underlying utility narrative is invalid. It means token performance remains tethered to whether real network usage fees can scale fast enough to absorb daily supply growth. Will verifiable protocol revenue eventually cross the threshold of daily inflation, or will treasury rewards continue to drive token supply faster than on-chain demand burns it?
$AIOZ #DePIN #CryptoAnalysis
58
·
--
Məqalə
Tərcüməyə bax
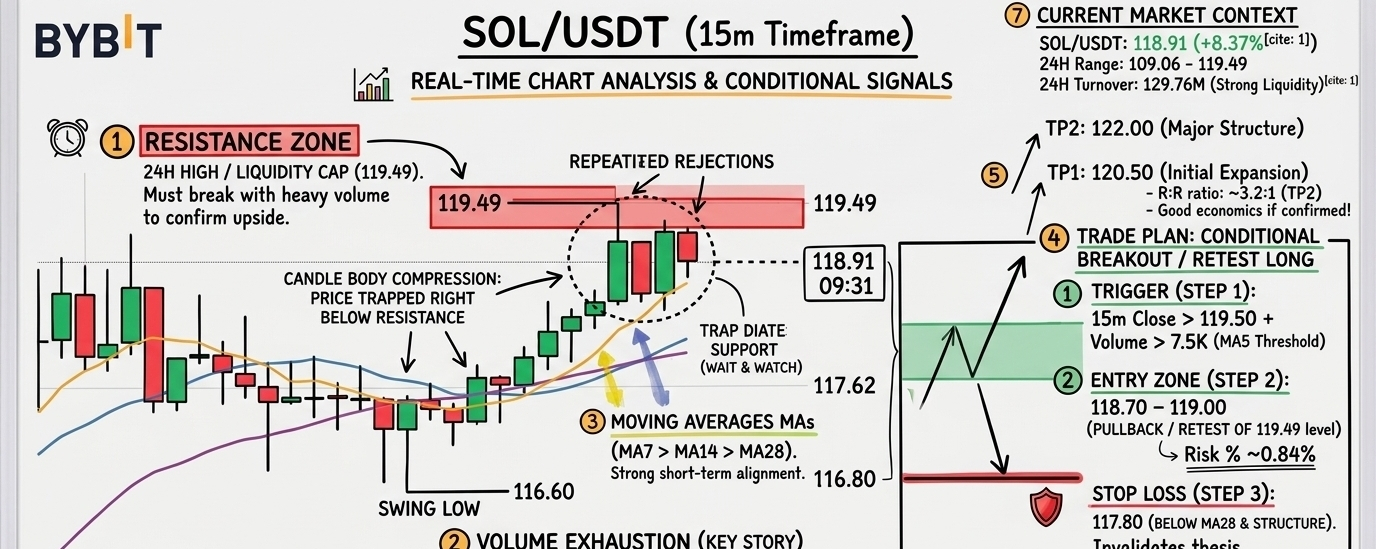
SolI was skimming through the SOL chart expecting a standard consolidation, but the sharp contraction in volume right under the local high caught my attention.
SOL/USDT is currently trading at 118.91, up +8.37% over the last 24 hours. The pair has traded between a 24H low of 109.06 and a high of 119.49, pulling 129.76M USDT in turnover.
Looking at the 15-minute timeframe, price pushed up aggressively from the 116.60 swing low to hit 119.49. Since hitting that peak, candle bodies are compressing tightly right above the moving averages rather than pulling back sharply.
Moving average alignment shows a short-term bullish stack:
MA7: 118.68
MA14: 118.10
MA28: 117.96
Price is holding cleanly above the MA7 (118.68), with MA14 and MA28 fanning out underneath to act as dynamic trailing support.
However, the volume profile demands caution. Current volume sits at 4.23K, which is noticeably below the MA5 volume of 7.48K and MA10 volume of 6.58K. Volume has dropped roughly 43% below its 5-period average during this consolidation. While price compression near highs can precede an expansion, breaking 119.49 without volume participation risks a swift fakeout rejection.
What I Like:
Clean bullish alignment with price staying well above MA7, MA14, and MA28.
Higher low established at 116.60 with rapid recovery.
Deep liquidity and strong 24H turnover (129.76M USDT) ensuring smooth execution.
What I Don't Like:
Volume is actively fading as price sits right under resistance.
Immediate upside is capped by the 119.49 high, offering a tight local range.
Risk of a leverage flush down to test MA28 if buyers get impatient.
Key Levels:
Resistance: 119.49 (24H High / Local Liquidity Cap)
Support: 118.10 – 118.68 (MA7 / MA14 Cluster)
Invalidation: 116.60 (Recent Swing Low)
Trade Plan: CONDITIONAL BREAKOUT / RETEST LONG
Chasing market buys inside this low-volume consolidation offers poor risk/reward. I prefer waiting for explicit confirmation.
Trigger: 15m candle close above 119.50 accompanied by volume crossing above 7.5K (MA5 threshold).
Entry Zone: 118.70 – 119.00 (on pullback/retest of broken resistance)
Target 1 (TP1): 120.50 (Initial expansion zone)
Target 2 (TP2): 122.00 (Major overhead structural level)
Stop Loss (SL): 117.80 (Just below MA28 and local structure)
Risk & Calculations:
Risk: ~0.84% (from ~118.80 entry down to 117.80 SL)
Reward (TP1): ~1.43% | Reward (TP2): ~2.69%
R:R Ratio: ~1.7:1 (TP1) / ~3.2:1 (TP2)
Final View:
Structure remains constructive, but buying straight into resistance on declining volume is a quick way to get chopped up. If volume returns and pushes price past 119.49, the move towards 122.00 opens up quickly. Until then, keeping orders on hold is the disciplined call.
Will buyers step in with real volume to push past 119.49, or are we due for a sweep down to test the MA28 dynamic support?
#Bybit #CryptoTrading #SOL
Sol
I was skimming through the SOL chart expecting a standard consolidation, but the sharp contraction in volume right under the local high caught my attention.
SOL/USDT is currently trading at 118.91, up +8.37% over the last 24 hours. The pair has traded between a 24H low of 109.06 and a high of 119.49, pulling 129.76M USDT in turnover.
Looking at the 15-minute timeframe, price pushed up aggressively from the 116.60 swing low to hit 119.49. Since hitting that peak, candle bodies are compressing tightly right above the moving averages rather than pulling back sharply.
Moving average alignment shows a short-term bullish stack:
MA7: 118.68
MA14: 118.10
MA28: 117.96
Price is holding cleanly above the MA7 (118.68), with MA14 and MA28 fanning out underneath to act as dynamic trailing support.
However, the volume profile demands caution. Current volume sits at 4.23K, which is noticeably below the MA5 volume of 7.48K and MA10 volume of 6.58K. Volume has dropped roughly 43% below its 5-period average during this consolidation. While price compression near highs can precede an expansion, breaking 119.49 without volume participation risks a swift fakeout rejection.
What I Like:
Clean bullish alignment with price staying well above MA7, MA14, and MA28.
Higher low established at 116.60 with rapid recovery.
Deep liquidity and strong 24H turnover (129.76M USDT) ensuring smooth execution.
What I Don't Like:
Volume is actively fading as price sits right under resistance.
Immediate upside is capped by the 119.49 high, offering a tight local range.
Risk of a leverage flush down to test MA28 if buyers get impatient.
Key Levels:
Resistance: 119.49 (24H High / Local Liquidity Cap)
Support: 118.10 – 118.68 (MA7 / MA14 Cluster)
Invalidation: 116.60 (Recent Swing Low)
Trade Plan: CONDITIONAL BREAKOUT / RETEST LONG
Chasing market buys inside this low-volume consolidation offers poor risk/reward. I prefer waiting for explicit confirmation.
Trigger: 15m candle close above 119.50 accompanied by volume crossing above 7.5K (MA5 threshold).
Entry Zone: 118.70 – 119.00 (on pullback/retest of broken resistance)
Target 1 (TP1): 120.50 (Initial expansion zone)
Target 2 (TP2): 122.00 (Major overhead structural level)
Stop Loss (SL): 117.80 (Just below MA28 and local structure)
Risk & Calculations:
Risk: ~0.84% (from ~118.80 entry down to 117.80 SL)
Reward (TP1): ~1.43% | Reward (TP2): ~2.69%
R:R Ratio: ~1.7:1 (TP1) / ~3.2:1 (TP2)
Final View:
Structure remains constructive, but buying straight into resistance on declining volume is a quick way to get chopped up. If volume returns and pushes price past 119.49, the move towards 122.00 opens up quickly. Until then, keeping orders on hold is the disciplined call.
Will buyers step in with real volume to push past 119.49, or are we due for a sweep down to test the MA28 dynamic support?
#Bybit #CryptoTrading #SOL
SOL/USDT is currently trading at 118.91, up +8.37% over the last 24 hours. The pair has traded between a 24H low of 109.06 and a high of 119.49, pulling 129.76M USDT in turnover.
Looking at the 15-minute timeframe, price pushed up aggressively from the 116.60 swing low to hit 119.49. Since hitting that peak, candle bodies are compressing tightly right above the moving averages rather than pulling back sharply.
Moving average alignment shows a short-term bullish stack:
MA7: 118.68
MA14: 118.10
MA28: 117.96
Price is holding cleanly above the MA7 (118.68), with MA14 and MA28 fanning out underneath to act as dynamic trailing support.
However, the volume profile demands caution. Current volume sits at 4.23K, which is noticeably below the MA5 volume of 7.48K and MA10 volume of 6.58K. Volume has dropped roughly 43% below its 5-period average during this consolidation. While price compression near highs can precede an expansion, breaking 119.49 without volume participation risks a swift fakeout rejection.
What I Like:
Clean bullish alignment with price staying well above MA7, MA14, and MA28.
Higher low established at 116.60 with rapid recovery.
Deep liquidity and strong 24H turnover (129.76M USDT) ensuring smooth execution.
What I Don't Like:
Volume is actively fading as price sits right under resistance.
Immediate upside is capped by the 119.49 high, offering a tight local range.
Risk of a leverage flush down to test MA28 if buyers get impatient.
Key Levels:
Resistance: 119.49 (24H High / Local Liquidity Cap)
Support: 118.10 – 118.68 (MA7 / MA14 Cluster)
Invalidation: 116.60 (Recent Swing Low)
Trade Plan: CONDITIONAL BREAKOUT / RETEST LONG
Chasing market buys inside this low-volume consolidation offers poor risk/reward. I prefer waiting for explicit confirmation.
Trigger: 15m candle close above 119.50 accompanied by volume crossing above 7.5K (MA5 threshold).
Entry Zone: 118.70 – 119.00 (on pullback/retest of broken resistance)
Target 1 (TP1): 120.50 (Initial expansion zone)
Target 2 (TP2): 122.00 (Major overhead structural level)
Stop Loss (SL): 117.80 (Just below MA28 and local structure)
Risk & Calculations:
Risk: ~0.84% (from ~118.80 entry down to 117.80 SL)
Reward (TP1): ~1.43% | Reward (TP2): ~2.69%
R:R Ratio: ~1.7:1 (TP1) / ~3.2:1 (TP2)
Final View:
Structure remains constructive, but buying straight into resistance on declining volume is a quick way to get chopped up. If volume returns and pushes price past 119.49, the move towards 122.00 opens up quickly. Until then, keeping orders on hold is the disciplined call.
Will buyers step in with real volume to push past 119.49, or are we due for a sweep down to test the MA28 dynamic support?
#Bybit #CryptoTrading #SOL
42
·
--
Bazar Yeniləməsi: Bitcoin $80K-ni geri alır, bazar ləğvləri isə $240M+ qısa sıxılmasını tetikler
Kriptovalyuta bazarı kəskin “risk-on” reboundu ilə yenidən canlanır; Bitcoin (BTC) $80.000 həddini yenidən üstələyir və rəqəmsal aktivlərin ümumi bazar kapitallaşması təxminən 4,8% artaraq 2,92 trilyon dollara çatır.
Birdən-birə artan yüksəliş tempi 24 saatlıq pəncərədə törəmə birjalar üzrə 246 milyon dollardan çox qısa mövqe ləğvi dalğasını işə salıb.
Artımı nə sürətləndirir?
Bazar miqyasında qısa sıxılma: Ağır qısa mövqe tərkibi və sabit spot alışlar iri kriptovalyutaları əsas maneə müqavimət səviyyələrini keçməyə məcbur etdi. Daha az sığortalanmış törəmə mövqelərdə ləğvlər qiymət rallisini daha da sürətləndirərək zəncirvari effekt yaratdı.
Ethereum & Altcoin rotasiyası: Ethereum (ETH) $2.620-yə yaxınlaşdı; dayanıqlı spot ETF axınları və kapitalın dominant BTC ticarətindən çıxıb əsas Layer-1 şəbəkələrinə yönəlməsi bunu dəstəklədi.
L1 & L2 liderləri: məxfilik sikkələri və seçilmiş Layer-2 platformaları ralliyə öncərlik etdi:
Monero (XMR) məxfilik sektorunda artan həcm fonunda texniki breakoutdan sonra 13% yüksəldi.
Arbitrum (ARB) ekosistemin genişlənməsinə bağlı uzunmüddətli artım proqnozları ilə 5,8% qazandı.
Stellar (XLM) Protocol 28 şəbəkə yeniləməsi işə düşdükdən sonra 8% sıçradı.
Makro perspektiv & növbəti nələrə diqqət etmək lazımdır
Bu yüksəlişə baxmayaraq, institusional treyderlər ehtiyatlı yanaşır. Yaxınlaşan ABŞ makroiqtisadi inflyasiya göstəriciləri və federal bazar strukturu təklifləri ilə bağlı davam edən tənzimləmə yenilikləri bu breakout-un qorunub-qorunmayacağını, yoxsa müqavimət səviyyələri yaxınlığında növbəti konsolidasiya dövrünə çevriləcəyini müəyyənləşdirəcək.
Bazar Yeniləməsi: Bitcoin $80K-ni geri alır, bazar ləğvləri isə $240M+ qısa sıxılmasını tetikler
Kriptovalyuta bazarı kəskin “risk-on” reboundu ilə yenidən canlanır; Bitcoin (BTC) $80.000 həddini yenidən üstələyir və rəqəmsal aktivlərin ümumi bazar kapitallaşması təxminən 4,8% artaraq 2,92 trilyon dollara çatır.
Birdən-birə artan yüksəliş tempi 24 saatlıq pəncərədə törəmə birjalar üzrə 246 milyon dollardan çox qısa mövqe ləğvi dalğasını işə salıb.
Artımı nə sürətləndirir?
Bazar miqyasında qısa sıxılma: Ağır qısa mövqe tərkibi və sabit spot alışlar iri kriptovalyutaları əsas maneə müqavimət səviyyələrini keçməyə məcbur etdi. Daha az sığortalanmış törəmə mövqelərdə ləğvlər qiymət rallisini daha da sürətləndirərək zəncirvari effekt yaratdı.
Ethereum & Altcoin rotasiyası: Ethereum (ETH) $2.620-yə yaxınlaşdı; dayanıqlı spot ETF axınları və kapitalın dominant BTC ticarətindən çıxıb əsas Layer-1 şəbəkələrinə yönəlməsi bunu dəstəklədi.
L1 & L2 liderləri: məxfilik sikkələri və seçilmiş Layer-2 platformaları ralliyə öncərlik etdi:
Monero (XMR) məxfilik sektorunda artan həcm fonunda texniki breakoutdan sonra 13% yüksəldi.
Arbitrum (ARB) ekosistemin genişlənməsinə bağlı uzunmüddətli artım proqnozları ilə 5,8% qazandı.
Stellar (XLM) Protocol 28 şəbəkə yeniləməsi işə düşdükdən sonra 8% sıçradı.
Makro perspektiv & növbəti nələrə diqqət etmək lazımdır
Bu yüksəlişə baxmayaraq, institusional treyderlər ehtiyatlı yanaşır. Yaxınlaşan ABŞ makroiqtisadi inflyasiya göstəriciləri və federal bazar strukturu təklifləri ilə bağlı davam edən tənzimləmə yenilikləri bu breakout-un qorunub-qorunmayacağını, yoxsa müqavimət səviyyələri yaxınlığında növbəti konsolidasiya dövrünə çevriləcəyini müəyyənləşdirəcək.
Kriptovalyuta bazarı kəskin “risk-on” reboundu ilə yenidən canlanır; Bitcoin (BTC) $80.000 həddini yenidən üstələyir və rəqəmsal aktivlərin ümumi bazar kapitallaşması təxminən 4,8% artaraq 2,92 trilyon dollara çatır.
Birdən-birə artan yüksəliş tempi 24 saatlıq pəncərədə törəmə birjalar üzrə 246 milyon dollardan çox qısa mövqe ləğvi dalğasını işə salıb.
Artımı nə sürətləndirir?
Bazar miqyasında qısa sıxılma: Ağır qısa mövqe tərkibi və sabit spot alışlar iri kriptovalyutaları əsas maneə müqavimət səviyyələrini keçməyə məcbur etdi. Daha az sığortalanmış törəmə mövqelərdə ləğvlər qiymət rallisini daha da sürətləndirərək zəncirvari effekt yaratdı.
Ethereum & Altcoin rotasiyası: Ethereum (ETH) $2.620-yə yaxınlaşdı; dayanıqlı spot ETF axınları və kapitalın dominant BTC ticarətindən çıxıb əsas Layer-1 şəbəkələrinə yönəlməsi bunu dəstəklədi.
L1 & L2 liderləri: məxfilik sikkələri və seçilmiş Layer-2 platformaları ralliyə öncərlik etdi:
Monero (XMR) məxfilik sektorunda artan həcm fonunda texniki breakoutdan sonra 13% yüksəldi.
Arbitrum (ARB) ekosistemin genişlənməsinə bağlı uzunmüddətli artım proqnozları ilə 5,8% qazandı.
Stellar (XLM) Protocol 28 şəbəkə yeniləməsi işə düşdükdən sonra 8% sıçradı.
Makro perspektiv & növbəti nələrə diqqət etmək lazımdır
Bu yüksəlişə baxmayaraq, institusional treyderlər ehtiyatlı yanaşır. Yaxınlaşan ABŞ makroiqtisadi inflyasiya göstəriciləri və federal bazar strukturu təklifləri ilə bağlı davam edən tənzimləmə yenilikləri bu breakout-un qorunub-qorunmayacağını, yoxsa müqavimət səviyyələri yaxınlığında növbəti konsolidasiya dövrünə çevriləcəyini müəyyənləşdirəcək.
150
·
--
Artım
$AURORA (+101% Pompa Analizi: Ticarət Qurası, yoxsa Tələ?)
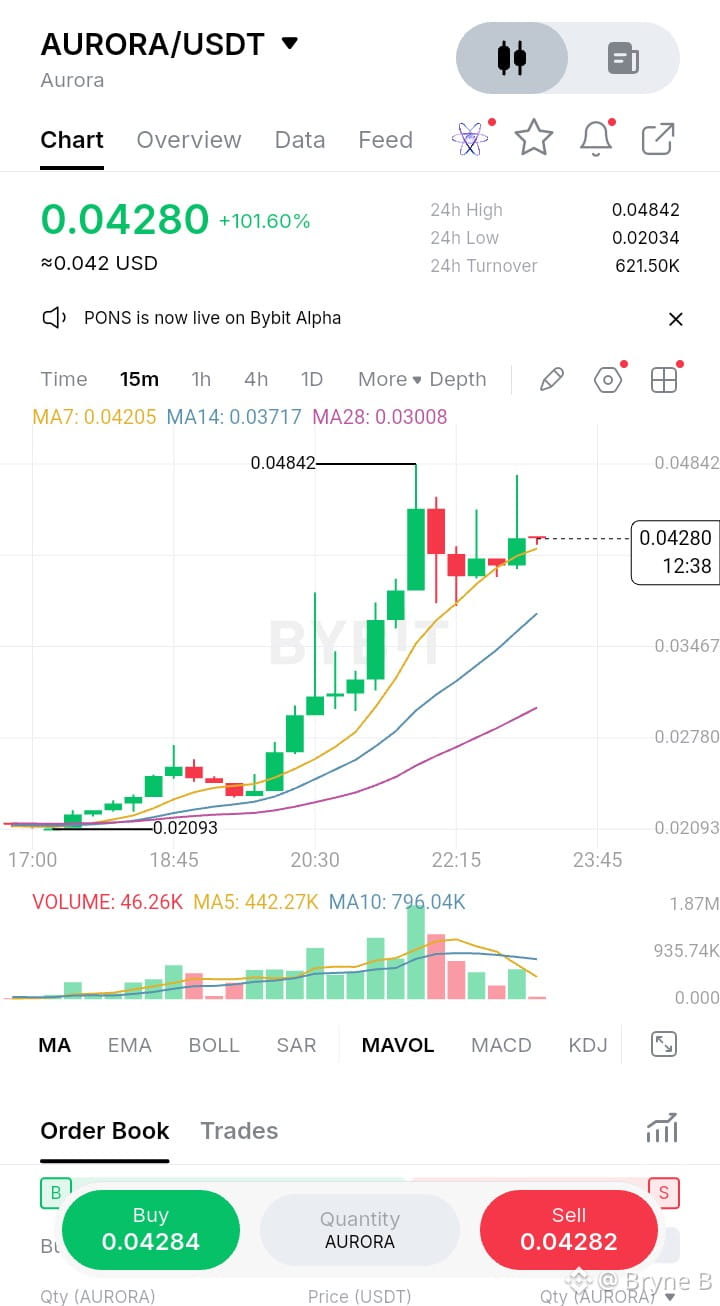
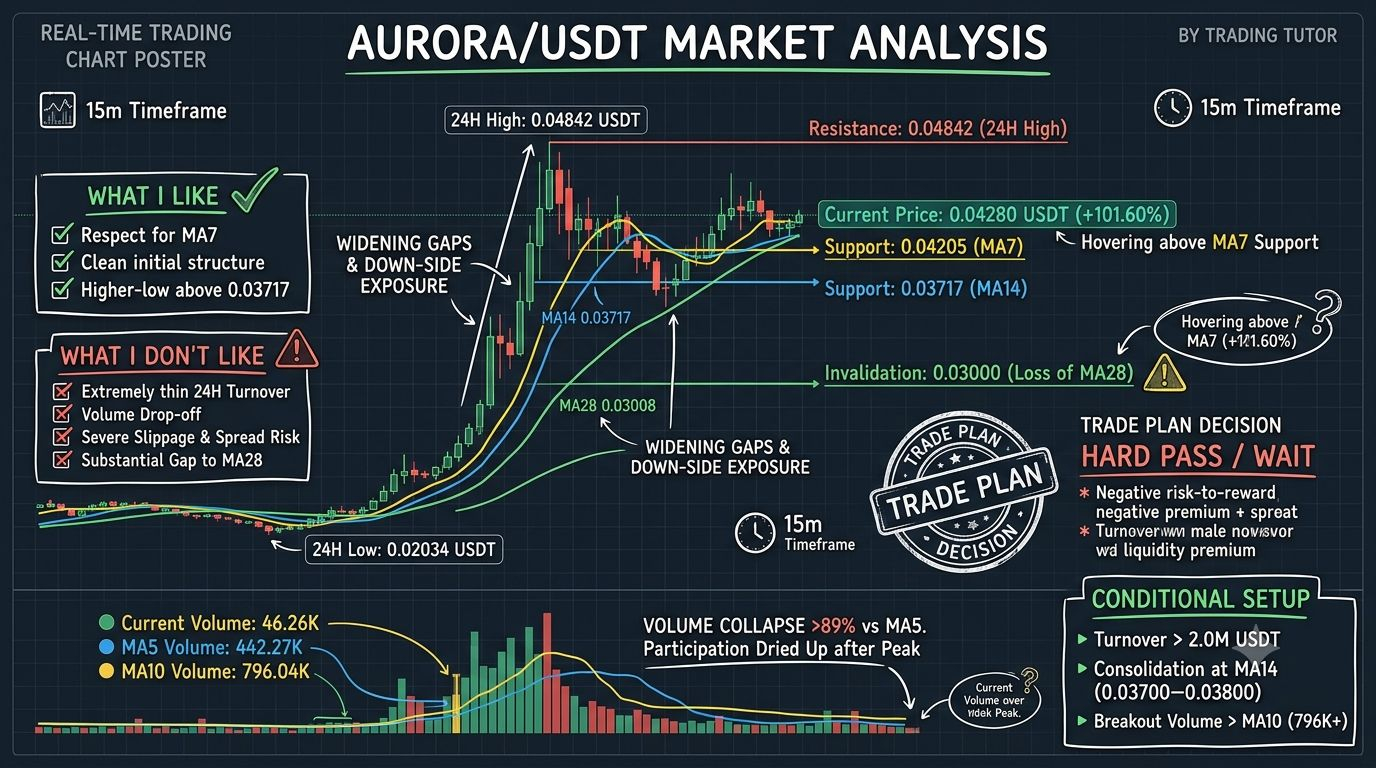
$AURORA $0.02093 bazasından ikiqat artaraq $0.04842-yə qədər yüksəldi, amma icra (execution) likvidliyi kritik bir hekayə danışır.
Bazar İcmalı:
Qiymət: $0.04280
24saat Aralığı: $0.02034 – $0.04842
24saat Dövriyyə: $621.50K (Çox nazik)
Texniki Qırılım:
Trendləyiş: MA7 ($0.04205)-nin üstündə qalır, amma MA14 ($0.03717) və MA28 ($0.03008)-ə olan boşluqlar chartın çox həddən artıq uzandığını göstərir.
Həcm Quruyur: Hazırkı 15 dəq həcm (46.26K) MA5 bazası (442.27K)-a görə ~89.5% aşağıdır.
Əsas Nəticələr:
Pros: Təmiz trend strukturu; $0.03717-nin üstündə daha yüksək diblər (higher lows) saxlanır.
Cons: Nazik sifariş kitabçaları ($621K ümumi dövriyyə) böyük slippage riski və spreadə məruz qalma deməkdir. $0.04280-də almağa çalışıb hədəf $0.04842 (+13%) qoymaq, riski $0.03650 (-14.7%) qarşısında, mənfi R:R (~0.89:1) verir.
Ticarət Planı: GÖZLƏ / QATİYYƏTЛƏ KEÇ
Giriş Şərtlərinə Baxın:
Dövriyyə $2.0M USDT-dən (real dərinlik) yuxarı genişləsin.
Nəzarətli baza $0.03700–$0.03800 aralığında formalaşsın (MA14).
15 dəq həcm retest zamanı MA10-u (796K+) yenidən qırıb yuxarı çıxsın.
Əsas Səviyyələr:
Müqavimət: $0.04842
Dəstək: $0.04205 / $0.03717
Invalidasiya: $0.03000
Həcm $0.04842-i retest etməyə addım atacaq, yoxsa daha dərin eniş $0.03700-a doğru gedirik?
#Crypto #Trading #Binance #AURORA
$AURORA (+101% Pompa Analizi: Ticarət Qurası, yoxsa Tələ?)
$AURORA $0.02093 bazasından ikiqat artaraq $0.04842-yə qədər yüksəldi, amma icra (execution) likvidliyi kritik bir hekayə danışır.
Bazar İcmalı:
Qiymət: $0.04280
24saat Aralığı: $0.02034 – $0.04842
24saat Dövriyyə: $621.50K (Çox nazik)
Texniki Qırılım:
Trendləyiş: MA7 ($0.04205)-nin üstündə qalır, amma MA14 ($0.03717) və MA28 ($0.03008)-ə olan boşluqlar chartın çox həddən artıq uzandığını göstərir.
Həcm Quruyur: Hazırkı 15 dəq həcm (46.26K) MA5 bazası (442.27K)-a görə ~89.5% aşağıdır.
Əsas Nəticələr:
Pros: Təmiz trend strukturu; $0.03717-nin üstündə daha yüksək diblər (higher lows) saxlanır.
Cons: Nazik sifariş kitabçaları ($621K ümumi dövriyyə) böyük slippage riski və spreadə məruz qalma deməkdir. $0.04280-də almağa çalışıb hədəf $0.04842 (+13%) qoymaq, riski $0.03650 (-14.7%) qarşısında, mənfi R:R (~0.89:1) verir.
Ticarət Planı: GÖZLƏ / QATİYYƏTЛƏ KEÇ
Giriş Şərtlərinə Baxın:
Dövriyyə $2.0M USDT-dən (real dərinlik) yuxarı genişləsin.
Nəzarətli baza $0.03700–$0.03800 aralığında formalaşsın (MA14).
15 dəq həcm retest zamanı MA10-u (796K+) yenidən qırıb yuxarı çıxsın.
Əsas Səviyyələr:
Müqavimət: $0.04842
Dəstək: $0.04205 / $0.03717
Invalidasiya: $0.03000
Həcm $0.04842-i retest etməyə addım atacaq, yoxsa daha dərin eniş $0.03700-a doğru gedirik?
#Crypto #Trading #Binance #AURORA
$AURORA $0.02093 bazasından ikiqat artaraq $0.04842-yə qədər yüksəldi, amma icra (execution) likvidliyi kritik bir hekayə danışır.
Bazar İcmalı:
Qiymət: $0.04280
24saat Aralığı: $0.02034 – $0.04842
24saat Dövriyyə: $621.50K (Çox nazik)
Texniki Qırılım:
Trendləyiş: MA7 ($0.04205)-nin üstündə qalır, amma MA14 ($0.03717) və MA28 ($0.03008)-ə olan boşluqlar chartın çox həddən artıq uzandığını göstərir.
Həcm Quruyur: Hazırkı 15 dəq həcm (46.26K) MA5 bazası (442.27K)-a görə ~89.5% aşağıdır.
Əsas Nəticələr:
Pros: Təmiz trend strukturu; $0.03717-nin üstündə daha yüksək diblər (higher lows) saxlanır.
Cons: Nazik sifariş kitabçaları ($621K ümumi dövriyyə) böyük slippage riski və spreadə məruz qalma deməkdir. $0.04280-də almağa çalışıb hədəf $0.04842 (+13%) qoymaq, riski $0.03650 (-14.7%) qarşısında, mənfi R:R (~0.89:1) verir.
Ticarət Planı: GÖZLƏ / QATİYYƏTЛƏ KEÇ
Giriş Şərtlərinə Baxın:
Dövriyyə $2.0M USDT-dən (real dərinlik) yuxarı genişləsin.
Nəzarətli baza $0.03700–$0.03800 aralığında formalaşsın (MA14).
15 dəq həcm retest zamanı MA10-u (796K+) yenidən qırıb yuxarı çıxsın.
Əsas Səviyyələr:
Müqavimət: $0.04842
Dəstək: $0.04205 / $0.03717
Invalidasiya: $0.03000
Həcm $0.04842-i retest etməyə addım atacaq, yoxsa daha dərin eniş $0.03700-a doğru gedirik?
#Crypto #Trading #Binance #AURORA
1
·
--
🐕 DOGE/USDT — 15M Quraşdırma
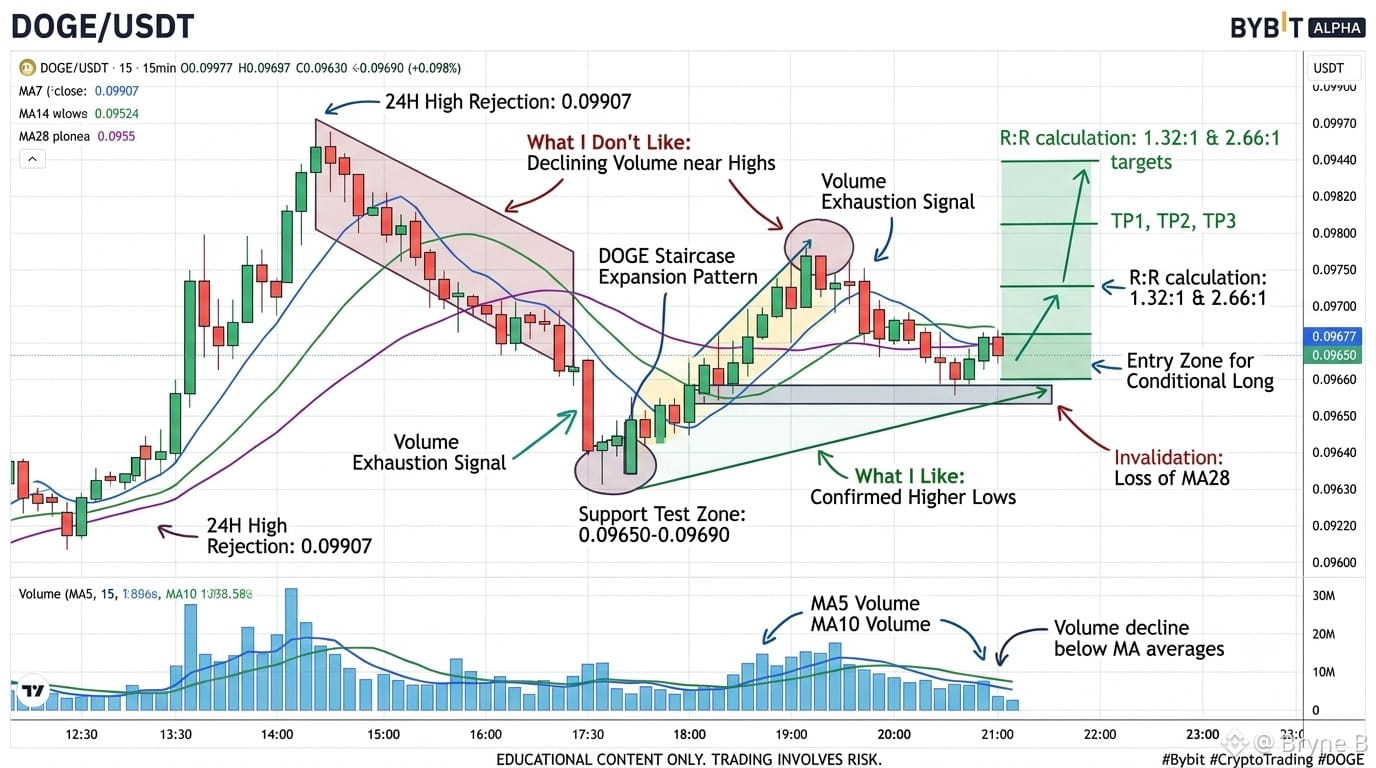
$DOGE DOGE güclü yüksəliş strukturu saxlayır, lakin qiymət 0.09907-yə yaxınlaşdıqca həcmlər azalır və 0.1000 yaxınlığında rədd edilmə riski artır.
📊 Bazar Strukturu
• Qiymət: 0.09819 (+13.10%)
• 24H Yüksək: 0.09907
• 24H Aşağı: 0.08613
• Dövriyyə: $38.62M
• MA7: 0.09733
• MA14: 0.09692
• MA28: 0.09518
⚠️ Həcm Xəbərdarlığı
Cari həcm: 4.76M vs MA5 həmi: 7.94M.
İştirak azalarkən qiymət yuxarı itələnir — mümkün tükənmə (exhaustion) siqnalı.
🎯 Əsas Səviyyələr
müqavimət: 0.09907 → 0.10000
Dəstək: 0.09733 → 0.09650–0.09690
Ləğvetmə (Invalidation): 0.09490
📈 Ticarət Quraşdırması
0.09819-u qovlamaq əvəzinə 0.09650–0.09690 istiqamətində geri çəkilməni gözləyin.
TP1: 0.09880
TP2: 0.09907
TP3: 0.10150
SL: 0.09490
Yüksəliş təsdiqi: Güclü həcm ilə 0.09907-dən yuxarı qırıb orada qalmaq.
Aşağıdüşmə xəbərdarlığı: Rədd edilmə + həcmdə davamlı azalma DOGE-ni yenidən 0.09650-yə doğru göndərə bilər.
Yekun: DOGE struktur olaraq yüksəlişlidir, amma cari risk/mükafat səbr etməyə üstünlük verir, qovlamağa yox.
#DOGE #DOGEUSDT #Binance #CryptoTrading #TechnicalAnalysis
🐕 DOGE/USDT — 15M Quraşdırma
$DOGE DOGE güclü yüksəliş strukturu saxlayır, lakin qiymət 0.09907-yə yaxınlaşdıqca həcmlər azalır və 0.1000 yaxınlığında rədd edilmə riski artır.
📊 Bazar Strukturu
• Qiymət: 0.09819 (+13.10%)
• 24H Yüksək: 0.09907
• 24H Aşağı: 0.08613
• Dövriyyə: $38.62M
• MA7: 0.09733
• MA14: 0.09692
• MA28: 0.09518
⚠️ Həcm Xəbərdarlığı
Cari həcm: 4.76M vs MA5 həmi: 7.94M.
İştirak azalarkən qiymət yuxarı itələnir — mümkün tükənmə (exhaustion) siqnalı.
🎯 Əsas Səviyyələr
müqavimət: 0.09907 → 0.10000
Dəstək: 0.09733 → 0.09650–0.09690
Ləğvetmə (Invalidation): 0.09490
📈 Ticarət Quraşdırması
0.09819-u qovlamaq əvəzinə 0.09650–0.09690 istiqamətində geri çəkilməni gözləyin.
TP1: 0.09880
TP2: 0.09907
TP3: 0.10150
SL: 0.09490
Yüksəliş təsdiqi: Güclü həcm ilə 0.09907-dən yuxarı qırıb orada qalmaq.
Aşağıdüşmə xəbərdarlığı: Rədd edilmə + həcmdə davamlı azalma DOGE-ni yenidən 0.09650-yə doğru göndərə bilər.
Yekun: DOGE struktur olaraq yüksəlişlidir, amma cari risk/mükafat səbr etməyə üstünlük verir, qovlamağa yox.
#DOGE #DOGEUSDT #Binance #CryptoTrading #TechnicalAnalysis
$DOGE DOGE güclü yüksəliş strukturu saxlayır, lakin qiymət 0.09907-yə yaxınlaşdıqca həcmlər azalır və 0.1000 yaxınlığında rədd edilmə riski artır.
📊 Bazar Strukturu
• Qiymət: 0.09819 (+13.10%)
• 24H Yüksək: 0.09907
• 24H Aşağı: 0.08613
• Dövriyyə: $38.62M
• MA7: 0.09733
• MA14: 0.09692
• MA28: 0.09518
⚠️ Həcm Xəbərdarlığı
Cari həcm: 4.76M vs MA5 həmi: 7.94M.
İştirak azalarkən qiymət yuxarı itələnir — mümkün tükənmə (exhaustion) siqnalı.
🎯 Əsas Səviyyələr
müqavimət: 0.09907 → 0.10000
Dəstək: 0.09733 → 0.09650–0.09690
Ləğvetmə (Invalidation): 0.09490
📈 Ticarət Quraşdırması
0.09819-u qovlamaq əvəzinə 0.09650–0.09690 istiqamətində geri çəkilməni gözləyin.
TP1: 0.09880
TP2: 0.09907
TP3: 0.10150
SL: 0.09490
Yüksəliş təsdiqi: Güclü həcm ilə 0.09907-dən yuxarı qırıb orada qalmaq.
Aşağıdüşmə xəbərdarlığı: Rədd edilmə + həcmdə davamlı azalma DOGE-ni yenidən 0.09650-yə doğru göndərə bilər.
Yekun: DOGE struktur olaraq yüksəlişlidir, amma cari risk/mükafat səbr etməyə üstünlük verir, qovlamağa yox.
#DOGE #DOGEUSDT #Binance #CryptoTrading #TechnicalAnalysis
35
·
--
Tərcüməyə bax
Trading the market is no longer about chasing green candles—it is about understanding structural shifts.
1. Macro Liquidity & The "Real-Yield" Pivot
Bitcoin testing the key $82,000–$88,000 breakout levels isn't happening in a vacuum. We are seeing a complete repricing around central bank interest rate cycles and institutional ETF dynamics.
The Reality: Retail hype cycles have been replaced by institutional order flow.
The Lesson: Stop looking for 100x micro-caps on daily charts. Watch institutional spot inflows, funding rates, and open interest (OI) clusters. Capital is concentrating in liquid, high-conviction assets before trickling into sector-specific altcoins.
2. Autonomous AI Agents On-Chain
The narrative has shifted from "AI tokens" to AI Agent Execution Rails.
The Reality: Autonomous agents are now executing micro-transactions, managing yield strategies, and paying for compute on-chain via programmable crypto payment layers.
The Lesson: Look for protocols building real infrastructure for machine-to-machine economies—decentralized compute, zero-knowledge execution, and high-throughput micro-settlement chains.
3. RWA & Yield Composability (TradFi 2.0)
Tokenized Real-World Assets (RWAs)—from US Treasuries to private credit—are no longer an experiment; they are a major liquidity layer holding tens of billions in value.
The Reality: Institutions are deploying capital on-chain to unlock 24/7 liquidity and atomic composability.
The Lesson: DeFi protocols integrating institutional collateral (like tokenized short-term bonds or credit) into perp DEXs and lending markets are capturing sustainable fee revenue, not relying on inflationary tokenomics.
Trade the Structure, Not the Story: Wait for confirmed breakouts above major weekly supply/demand zones.
Respect Systemic Leverage: High open interest paired with stagnant spot price is a red flag for a leverage flush. Protect your capital with strict stop losses.
Follow the Yield: Long-term sustainable growth is moving toward protocols returning real protocol fees to holders.
Trading the market is no longer about chasing green candles—it is about understanding structural shifts.
1. Macro Liquidity & The "Real-Yield" Pivot
Bitcoin testing the key $82,000–$88,000 breakout levels isn't happening in a vacuum. We are seeing a complete repricing around central bank interest rate cycles and institutional ETF dynamics.
The Reality: Retail hype cycles have been replaced by institutional order flow.
The Lesson: Stop looking for 100x micro-caps on daily charts. Watch institutional spot inflows, funding rates, and open interest (OI) clusters. Capital is concentrating in liquid, high-conviction assets before trickling into sector-specific altcoins.
2. Autonomous AI Agents On-Chain
The narrative has shifted from "AI tokens" to AI Agent Execution Rails.
The Reality: Autonomous agents are now executing micro-transactions, managing yield strategies, and paying for compute on-chain via programmable crypto payment layers.
The Lesson: Look for protocols building real infrastructure for machine-to-machine economies—decentralized compute, zero-knowledge execution, and high-throughput micro-settlement chains.
3. RWA & Yield Composability (TradFi 2.0)
Tokenized Real-World Assets (RWAs)—from US Treasuries to private credit—are no longer an experiment; they are a major liquidity layer holding tens of billions in value.
The Reality: Institutions are deploying capital on-chain to unlock 24/7 liquidity and atomic composability.
The Lesson: DeFi protocols integrating institutional collateral (like tokenized short-term bonds or credit) into perp DEXs and lending markets are capturing sustainable fee revenue, not relying on inflationary tokenomics.
Trade the Structure, Not the Story: Wait for confirmed breakouts above major weekly supply/demand zones.
Respect Systemic Leverage: High open interest paired with stagnant spot price is a red flag for a leverage flush. Protect your capital with strict stop losses.
Follow the Yield: Long-term sustainable growth is moving toward protocols returning real protocol fees to holders.
1. Macro Liquidity & The "Real-Yield" Pivot
Bitcoin testing the key $82,000–$88,000 breakout levels isn't happening in a vacuum. We are seeing a complete repricing around central bank interest rate cycles and institutional ETF dynamics.
The Reality: Retail hype cycles have been replaced by institutional order flow.
The Lesson: Stop looking for 100x micro-caps on daily charts. Watch institutional spot inflows, funding rates, and open interest (OI) clusters. Capital is concentrating in liquid, high-conviction assets before trickling into sector-specific altcoins.
2. Autonomous AI Agents On-Chain
The narrative has shifted from "AI tokens" to AI Agent Execution Rails.
The Reality: Autonomous agents are now executing micro-transactions, managing yield strategies, and paying for compute on-chain via programmable crypto payment layers.
The Lesson: Look for protocols building real infrastructure for machine-to-machine economies—decentralized compute, zero-knowledge execution, and high-throughput micro-settlement chains.
3. RWA & Yield Composability (TradFi 2.0)
Tokenized Real-World Assets (RWAs)—from US Treasuries to private credit—are no longer an experiment; they are a major liquidity layer holding tens of billions in value.
The Reality: Institutions are deploying capital on-chain to unlock 24/7 liquidity and atomic composability.
The Lesson: DeFi protocols integrating institutional collateral (like tokenized short-term bonds or credit) into perp DEXs and lending markets are capturing sustainable fee revenue, not relying on inflationary tokenomics.
Trade the Structure, Not the Story: Wait for confirmed breakouts above major weekly supply/demand zones.
Respect Systemic Leverage: High open interest paired with stagnant spot price is a red flag for a leverage flush. Protect your capital with strict stop losses.
Follow the Yield: Long-term sustainable growth is moving toward protocols returning real protocol fees to holders.
25
·
--
Tərcüməyə bax
Trading the market is no longer about chasing green candles—it is about understanding structural shifts.
1. Macro Liquidity & The "Real-Yield" Pivot
Bitcoin testing the key $82,000–$88,000 breakout levels isn't happening in a vacuum. We are seeing a complete repricing around central bank interest rate cycles and institutional ETF dynamics.
The Reality: Retail hype cycles have been replaced by institutional order flow.
The Lesson: Stop looking for 100x micro-caps on daily charts. Watch institutional spot inflows, funding rates, and open interest (OI) clusters. Capital is concentrating in liquid, high-conviction assets before trickling into sector-specific altcoins.
2. Autonomous AI Agents On-Chain
The narrative has shifted from "AI tokens" to AI Agent Execution Rails.
The Reality: Autonomous agents are now executing micro-transactions, managing yield strategies, and paying for compute on-chain via programmable crypto payment layers.
The Lesson: Look for protocols building real infrastructure for machine-to-machine economies—decentralized compute, zero-knowledge execution, and high-throughput micro-settlement chains.
3. RWA & Yield Composability (TradFi 2.0)
Tokenized Real-World Assets (RWAs)—from US Treasuries to private credit—are no longer an experiment; they are a major liquidity layer holding tens of billions in value.
The Reality: Institutions are deploying capital on-chain to unlock 24/7 liquidity and atomic composability.
The Lesson: DeFi protocols integrating institutional collateral (like tokenized short-term bonds or credit) into perp DEXs and lending markets are capturing sustainable fee revenue, not relying on inflationary tokenomics.
Trade the Structure, Not the Story: Wait for confirmed breakouts above major weekly supply/demand zones.
Respect Systemic Leverage: High open interest paired with stagnant spot price is a red flag for a leverage flush. Protect your capital with strict stop losses.
Follow the Yield: Long-term sustainable growth is moving toward protocols returning real protocol fees to holders.
Trading the market is no longer about chasing green candles—it is about understanding structural shifts.
1. Macro Liquidity & The "Real-Yield" Pivot
Bitcoin testing the key $82,000–$88,000 breakout levels isn't happening in a vacuum. We are seeing a complete repricing around central bank interest rate cycles and institutional ETF dynamics.
The Reality: Retail hype cycles have been replaced by institutional order flow.
The Lesson: Stop looking for 100x micro-caps on daily charts. Watch institutional spot inflows, funding rates, and open interest (OI) clusters. Capital is concentrating in liquid, high-conviction assets before trickling into sector-specific altcoins.
2. Autonomous AI Agents On-Chain
The narrative has shifted from "AI tokens" to AI Agent Execution Rails.
The Reality: Autonomous agents are now executing micro-transactions, managing yield strategies, and paying for compute on-chain via programmable crypto payment layers.
The Lesson: Look for protocols building real infrastructure for machine-to-machine economies—decentralized compute, zero-knowledge execution, and high-throughput micro-settlement chains.
3. RWA & Yield Composability (TradFi 2.0)
Tokenized Real-World Assets (RWAs)—from US Treasuries to private credit—are no longer an experiment; they are a major liquidity layer holding tens of billions in value.
The Reality: Institutions are deploying capital on-chain to unlock 24/7 liquidity and atomic composability.
The Lesson: DeFi protocols integrating institutional collateral (like tokenized short-term bonds or credit) into perp DEXs and lending markets are capturing sustainable fee revenue, not relying on inflationary tokenomics.
Trade the Structure, Not the Story: Wait for confirmed breakouts above major weekly supply/demand zones.
Respect Systemic Leverage: High open interest paired with stagnant spot price is a red flag for a leverage flush. Protect your capital with strict stop losses.
Follow the Yield: Long-term sustainable growth is moving toward protocols returning real protocol fees to holders.
1. Macro Liquidity & The "Real-Yield" Pivot
Bitcoin testing the key $82,000–$88,000 breakout levels isn't happening in a vacuum. We are seeing a complete repricing around central bank interest rate cycles and institutional ETF dynamics.
The Reality: Retail hype cycles have been replaced by institutional order flow.
The Lesson: Stop looking for 100x micro-caps on daily charts. Watch institutional spot inflows, funding rates, and open interest (OI) clusters. Capital is concentrating in liquid, high-conviction assets before trickling into sector-specific altcoins.
2. Autonomous AI Agents On-Chain
The narrative has shifted from "AI tokens" to AI Agent Execution Rails.
The Reality: Autonomous agents are now executing micro-transactions, managing yield strategies, and paying for compute on-chain via programmable crypto payment layers.
The Lesson: Look for protocols building real infrastructure for machine-to-machine economies—decentralized compute, zero-knowledge execution, and high-throughput micro-settlement chains.
3. RWA & Yield Composability (TradFi 2.0)
Tokenized Real-World Assets (RWAs)—from US Treasuries to private credit—are no longer an experiment; they are a major liquidity layer holding tens of billions in value.
The Reality: Institutions are deploying capital on-chain to unlock 24/7 liquidity and atomic composability.
The Lesson: DeFi protocols integrating institutional collateral (like tokenized short-term bonds or credit) into perp DEXs and lending markets are capturing sustainable fee revenue, not relying on inflationary tokenomics.
Trade the Structure, Not the Story: Wait for confirmed breakouts above major weekly supply/demand zones.
Respect Systemic Leverage: High open interest paired with stagnant spot price is a red flag for a leverage flush. Protect your capital with strict stop losses.
Follow the Yield: Long-term sustainable growth is moving toward protocols returning real protocol fees to holders.
44
·
--
Tərcüməyə bax
Mastering the crypto markets isn't about luck; it's about combining technical analysis with disciplined risk management. To stay ahead, always set clear stop-loss levels to protect your capital. Utilize key indicators like the Relative Strength Index (RSI) and moving averages to gauge market momentum. Never risk more than a small percentage of your total portfolio on a single trade. Consistent practice and strict adherence to your trading plan are the foundations of long-term success.
Mastering the crypto markets isn't about luck; it's about combining technical analysis with disciplined risk management. To stay ahead, always set clear stop-loss levels to protect your capital. Utilize key indicators like the Relative Strength Index (RSI) and moving averages to gauge market momentum. Never risk more than a small percentage of your total portfolio on a single trade. Consistent practice and strict adherence to your trading plan are the foundations of long-term success.
52
·
--
Tərcüməyə bax
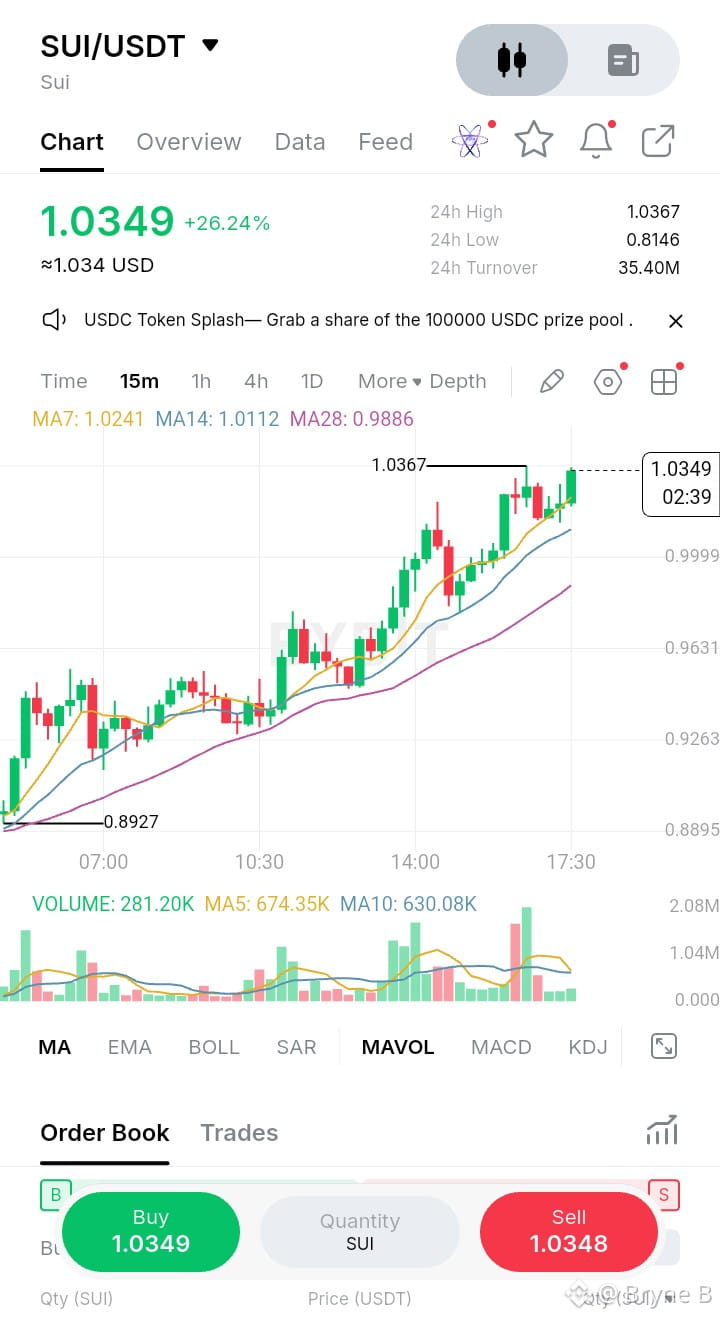
Watching the 15-minute chart print back-to-back green candles into local high liquidity is usually where retail gets trapped, but looking past the headline +26.24% daily spike reveals a far tighter micro-structure unfolding right now.
Price action on SUI/USDT is currently pushing $1.0349, hovering right at the edge of its 24-hour peak at $1.0367 after expanding off the $0.8146 daily low. Turnover is sitting healthily around 35.40M USDT, showing decent institutional participation, but the immediate tape suggests momentum is hitting a localized wall.
The lower-timeframe moving average cluster highlights why this expansion is slowing down:
What I Like:
What I Don't Like:
Volume collapse at key resistance ($1.0367); current candle volume is drastically lagging the 5-period average.
Extended distance from the 28-period moving average makes market orders vulnerable to a pullback.
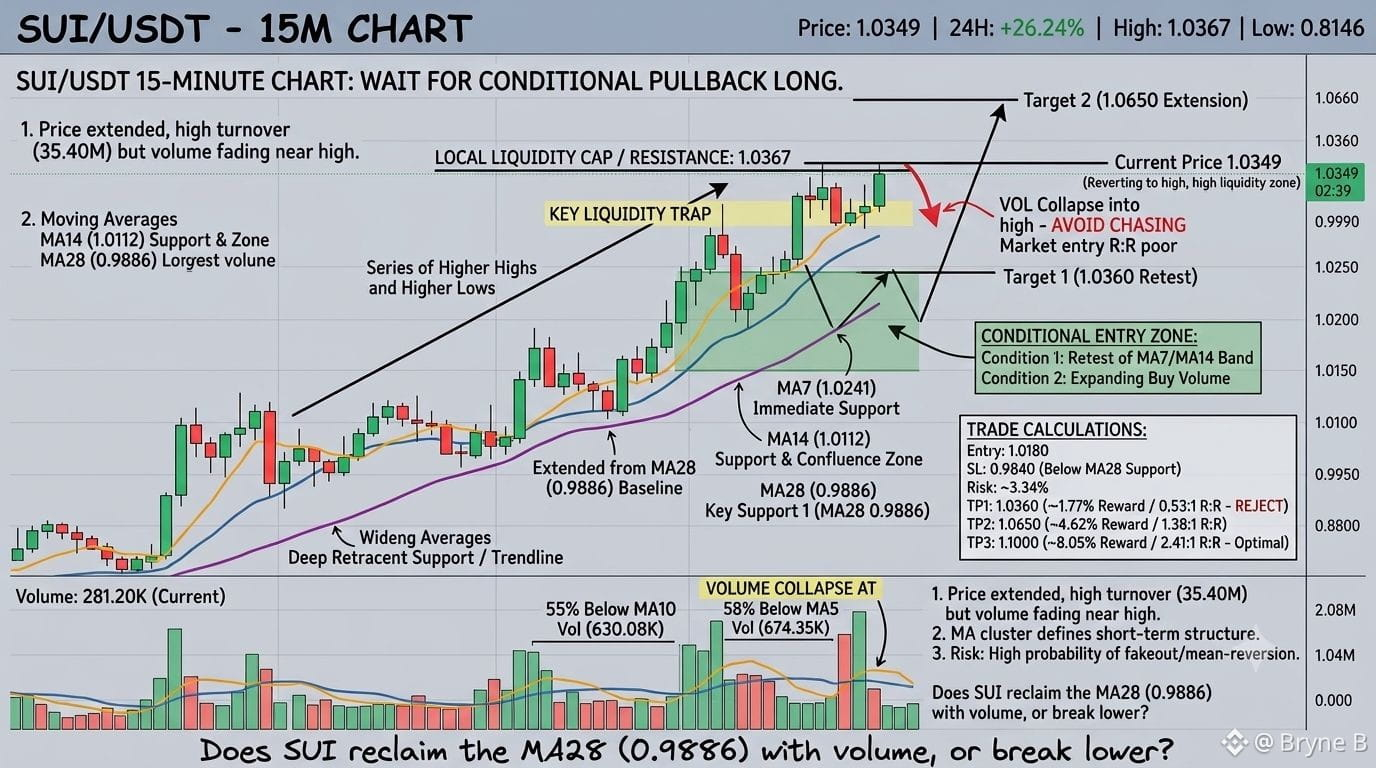
Trade Decision: WAIT / CONDITIONAL PULLBACK LONG.
Key Levels:
Resistance: $1.0367 (24H High & local liquidity cap)
Support 1: $1.0112 (MA14 confluence)
Support 2: $0.9886 (MA28 trendline support)
Invalidation: $0.8927 (Swing low structure)
Conditional Setup (Pullback Plan):
Trigger Condition: Wait for a retest of the MA7/MA14 band around $1.0150–$1.0200 with expanding buy volume.
Entry Zone: $1.0180
Target 1 (TP1): $1.0360 (24h High retest)
Target 2 (TP2): $1.0650 (Extension level)
Target 3 (TP3): $1.1000 (Psychological expansion)
Stop Loss (SL): $0.9840 (Below MA28 and minor pivot)
Risk & Math Check:
Risk: ~3.34% ($1.0180 to $0.9840)
Reward to TP1: ~1.77% (R:R ~ 0.53:1 — Reject market entry)
Reward to TP2: ~4.62% (R:R ~ 1.38:1)
Reward to TP3: ~8.05% (R:R ~ 2.41:1 — Full trade setup economics)
Entering at market price yields a negative risk-to-reward ratio against TP1. Patience is key—never pay the market a premium just to catch a move that is already extended.
#Bybit #CryptoTrading #SUI #TechnicalAnalysis
Watching the 15-minute chart print back-to-back green candles into local high liquidity is usually where retail gets trapped, but looking past the headline +26.24% daily spike reveals a far tighter micro-structure unfolding right now.
Price action on SUI/USDT is currently pushing $1.0349, hovering right at the edge of its 24-hour peak at $1.0367 after expanding off the $0.8146 daily low. Turnover is sitting healthily around 35.40M USDT, showing decent institutional participation, but the immediate tape suggests momentum is hitting a localized wall.
The lower-timeframe moving average cluster highlights why this expansion is slowing down:
What I Like:
What I Don't Like:
Volume collapse at key resistance ($1.0367); current candle volume is drastically lagging the 5-period average.
Extended distance from the 28-period moving average makes market orders vulnerable to a pullback.
Trade Decision: WAIT / CONDITIONAL PULLBACK LONG.
Key Levels:
Resistance: $1.0367 (24H High & local liquidity cap)
Support 1: $1.0112 (MA14 confluence)
Support 2: $0.9886 (MA28 trendline support)
Invalidation: $0.8927 (Swing low structure)
Conditional Setup (Pullback Plan):
Trigger Condition: Wait for a retest of the MA7/MA14 band around $1.0150–$1.0200 with expanding buy volume.
Entry Zone: $1.0180
Target 1 (TP1): $1.0360 (24h High retest)
Target 2 (TP2): $1.0650 (Extension level)
Target 3 (TP3): $1.1000 (Psychological expansion)
Stop Loss (SL): $0.9840 (Below MA28 and minor pivot)
Risk & Math Check:
Risk: ~3.34% ($1.0180 to $0.9840)
Reward to TP1: ~1.77% (R:R ~ 0.53:1 — Reject market entry)
Reward to TP2: ~4.62% (R:R ~ 1.38:1)
Reward to TP3: ~8.05% (R:R ~ 2.41:1 — Full trade setup economics)
Entering at market price yields a negative risk-to-reward ratio against TP1. Patience is key—never pay the market a premium just to catch a move that is already extended.
#Bybit #CryptoTrading #SUI #TechnicalAnalysis
Price action on SUI/USDT is currently pushing $1.0349, hovering right at the edge of its 24-hour peak at $1.0367 after expanding off the $0.8146 daily low. Turnover is sitting healthily around 35.40M USDT, showing decent institutional participation, but the immediate tape suggests momentum is hitting a localized wall.
The lower-timeframe moving average cluster highlights why this expansion is slowing down:
What I Like:
What I Don't Like:
Volume collapse at key resistance ($1.0367); current candle volume is drastically lagging the 5-period average.
Extended distance from the 28-period moving average makes market orders vulnerable to a pullback.
Trade Decision: WAIT / CONDITIONAL PULLBACK LONG.
Key Levels:
Resistance: $1.0367 (24H High & local liquidity cap)
Support 1: $1.0112 (MA14 confluence)
Support 2: $0.9886 (MA28 trendline support)
Invalidation: $0.8927 (Swing low structure)
Conditional Setup (Pullback Plan):
Trigger Condition: Wait for a retest of the MA7/MA14 band around $1.0150–$1.0200 with expanding buy volume.
Entry Zone: $1.0180
Target 1 (TP1): $1.0360 (24h High retest)
Target 2 (TP2): $1.0650 (Extension level)
Target 3 (TP3): $1.1000 (Psychological expansion)
Stop Loss (SL): $0.9840 (Below MA28 and minor pivot)
Risk & Math Check:
Risk: ~3.34% ($1.0180 to $0.9840)
Reward to TP1: ~1.77% (R:R ~ 0.53:1 — Reject market entry)
Reward to TP2: ~4.62% (R:R ~ 1.38:1)
Reward to TP3: ~8.05% (R:R ~ 2.41:1 — Full trade setup economics)
Entering at market price yields a negative risk-to-reward ratio against TP1. Patience is key—never pay the market a premium just to catch a move that is already extended.
#Bybit #CryptoTrading #SUI #TechnicalAnalysis
97
·
--
Artım
Tərcüməyə bax
$ARB
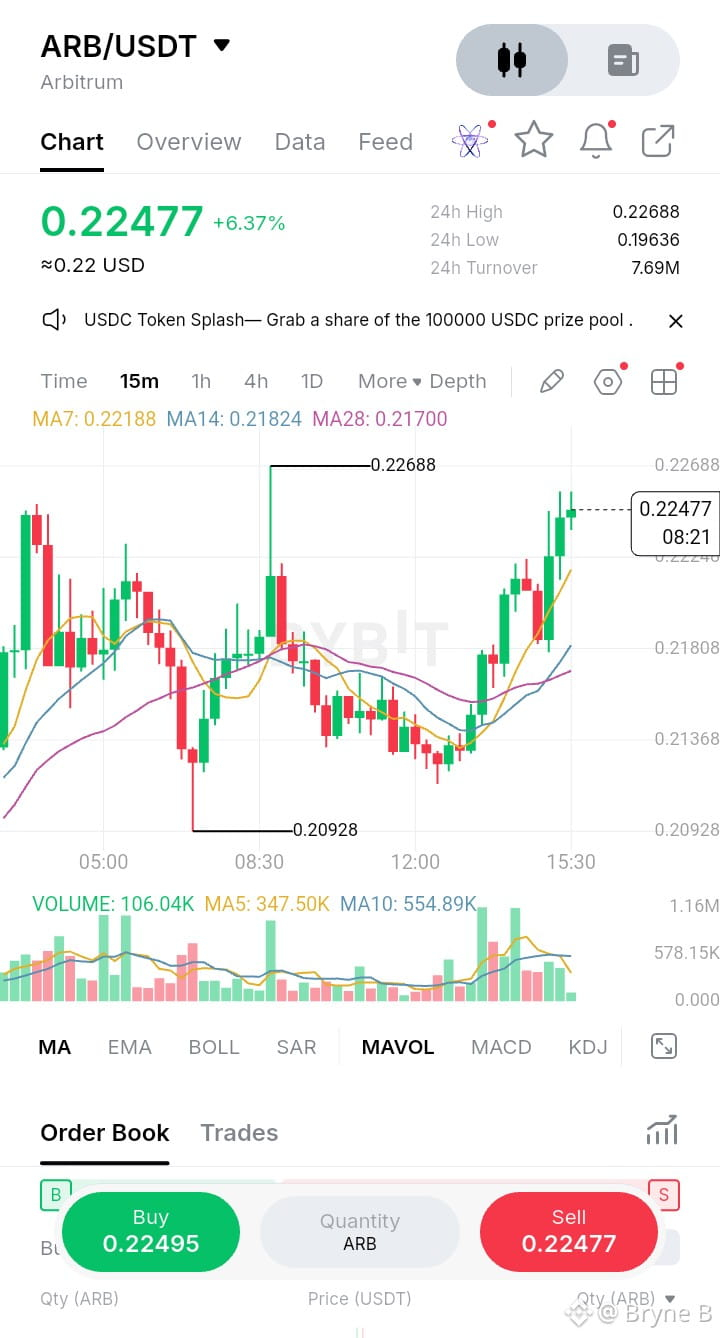
From September 14 to September 20, ARB climbed from $0.13369 to $0.21754, a 62.7% increase, while CoinGecko recorded $306.1M of volume on September 20. On September 21, the Bybit ARB/USDT chart shows $0.22477, up 6.37% over 24 hours, with a $0.19636–$0.22688 intraday range.
Here’s the part that gets skipped: September 23 is the next scheduled ARB vesting date, only 2 days after the current move. Tokenomics.com lists 53.8% of that release for insiders, 35.0% for private investors, and 11.2% for the foundation. The mechanism is straightforward: new vested tokens increase potential market supply, while the actual selling decision remains with recipients.
The contrast is that Arbitrum’s September 2 H1 report showed $6.19M of DAO income for January–June 2026, with protocol gross margins above 97%; Robinhood Chain’s July contribution added $360K of AEP licence fees, equal to 35% of DAO income that month. Yet AEP chains return 10% of net protocol revenue to the ecosystem, meaning network revenue and direct ARB token value capture are separate mechanisms.
None of this means the 62.7% rally is invalid; it means price momentum and token supply are moving on different clocks. With ARB at $0.22477 on September 21, will September 23’s vesting event produce measurable spot selling, or will trading volume absorb the additional supply?
#ARB #Arbitrum #Crypto #ARBUSDT
$ARB
From September 14 to September 20, ARB climbed from $0.13369 to $0.21754, a 62.7% increase, while CoinGecko recorded $306.1M of volume on September 20. On September 21, the Bybit ARB/USDT chart shows $0.22477, up 6.37% over 24 hours, with a $0.19636–$0.22688 intraday range.
Here’s the part that gets skipped: September 23 is the next scheduled ARB vesting date, only 2 days after the current move. Tokenomics.com lists 53.8% of that release for insiders, 35.0% for private investors, and 11.2% for the foundation. The mechanism is straightforward: new vested tokens increase potential market supply, while the actual selling decision remains with recipients.
The contrast is that Arbitrum’s September 2 H1 report showed $6.19M of DAO income for January–June 2026, with protocol gross margins above 97%; Robinhood Chain’s July contribution added $360K of AEP licence fees, equal to 35% of DAO income that month. Yet AEP chains return 10% of net protocol revenue to the ecosystem, meaning network revenue and direct ARB token value capture are separate mechanisms.
None of this means the 62.7% rally is invalid; it means price momentum and token supply are moving on different clocks. With ARB at $0.22477 on September 21, will September 23’s vesting event produce measurable spot selling, or will trading volume absorb the additional supply?
#ARB #Arbitrum #Crypto #ARBUSDT
From September 14 to September 20, ARB climbed from $0.13369 to $0.21754, a 62.7% increase, while CoinGecko recorded $306.1M of volume on September 20. On September 21, the Bybit ARB/USDT chart shows $0.22477, up 6.37% over 24 hours, with a $0.19636–$0.22688 intraday range.
Here’s the part that gets skipped: September 23 is the next scheduled ARB vesting date, only 2 days after the current move. Tokenomics.com lists 53.8% of that release for insiders, 35.0% for private investors, and 11.2% for the foundation. The mechanism is straightforward: new vested tokens increase potential market supply, while the actual selling decision remains with recipients.
The contrast is that Arbitrum’s September 2 H1 report showed $6.19M of DAO income for January–June 2026, with protocol gross margins above 97%; Robinhood Chain’s July contribution added $360K of AEP licence fees, equal to 35% of DAO income that month. Yet AEP chains return 10% of net protocol revenue to the ecosystem, meaning network revenue and direct ARB token value capture are separate mechanisms.
None of this means the 62.7% rally is invalid; it means price momentum and token supply are moving on different clocks. With ARB at $0.22477 on September 21, will September 23’s vesting event produce measurable spot selling, or will trading volume absorb the additional supply?
#ARB #Arbitrum #Crypto #ARBUSDT
192
·
--
Artım
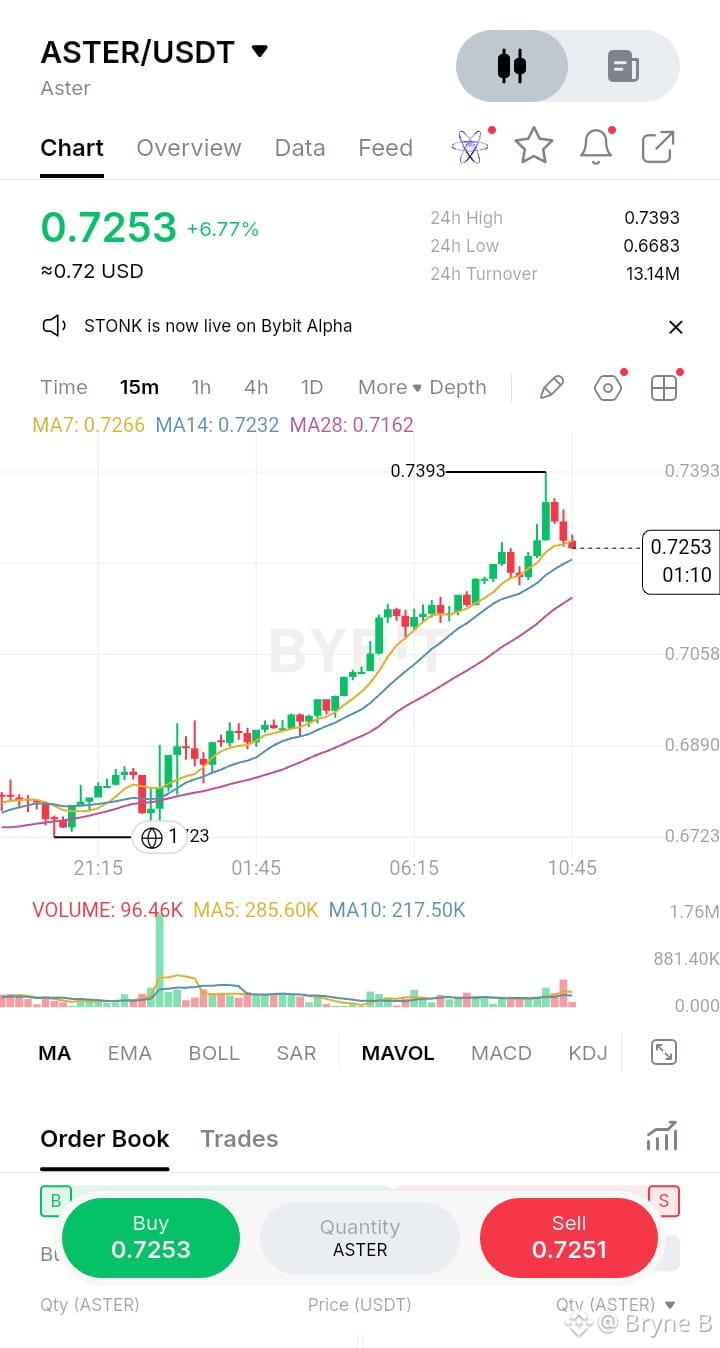
ASTER/USDT Bazar Yeniləməsi
Qiymət: $0.7253 (+6.77%) | ≈$0.72 ABŞ dolları
Sessiya Xülasəsi
24s Yüksək: $0.7393
24s Aşağı: $0.6683
24s Dövriyyə: 13.14M
Həcm (son): 96.46K
Texniki İcmal
ASTER ötən sessiya ərzində təmiz və davamlı yüksəliş nümayiş etdirib; $0.6683 yaxınlığındakı alçaldan nöqtədən qalxaraq sessiya daxilində $0.7393 səviyyəsinə çatdıqdan sonra $0.7253 ətrafında nisbətən yüngül konsolidasiyaya keçib.
Hərəkətli Orta Hədlər (15d):
MA7: 0.7266
MA14: 0.7232
MA28: 0.7162
Qısa-, orta- və uzunmüddətli hərəkətli ortalar aydın şəkildə bullish uyğunlaşma şəklindədir (MA7 > MA14 > MA28). Qiymət artım boyunca bu üç səviyyənin hamısının üzərində hərəkət edib — bu, tipik yüksəliş trendi strukturu kimi görünür. Hərəkətli ortalar bir-birinə yaxınlaşmaqdan çox yuxarıya “fan” kimi açılır; bu da impulsun hələ mənalı şəkildə zəifləmədiyini göstərir.
Qiymət Hərəkəti: Hərəkət əsasən nizamlı olub; yüksəliş zamanı yaşıl şamlar üstünlük təşkil edib və yolda yalnız dayaz korreksiyalar qeydə alınıb. Ən son şamlar yüksək səviyyələr yaxınlığında (~$0.7393) bir qədər qırmızı bədənlər göstərir; bu, kəskin yüksəlişdən sonra qısamüddətli mənfəətin götürülməsi və ya müqavimət testini işarə edə bilər. Qiymət hazırda həmin gündaxili yüksəkliyin bir qədər alt hissəsində dayanıb və qazancı “həzm edir”.
Həcm: İlkin yuxarı qırılma ilə birlikdə həcm artımı müşahidə olunub; həcm overlay üzərində MA5 (285.60K) hələ də MA10 (217.50K)-dan yuxarıda qalır — bu, hərəkətin aşağı inamlı driftdən deyil, tələblə idarə olunduğunu göstərir.
Diqqət Ediləcək Əsas Səviyyələr
Müqavimət: $0.7393 (sessiyanın yüksək nöqtəsi)
Dəstək: MA7/MA14 klasteri (~$0.723–0.727), ardınca $0.7058 pivotu
Nəticə
Qiymət qısa müddətli hərəkətli ortaların üzərində qaldıqca struktur konstruktiv olaraq qalır. $0.7393 üzərində qəti bağlanış davamın siqnalı ola bilər; MA7/MA14 zolağının altına düşmə isə yüksəlişin tempinin azaldığını göstərə və $0.7058 istiqamətində daha dərin korreksiyaya yol aça bilər. $ASTER
ASTER/USDT Bazar Yeniləməsi
Qiymət: $0.7253 (+6.77%) | ≈$0.72 ABŞ dolları
Sessiya Xülasəsi
24s Yüksək: $0.7393
24s Aşağı: $0.6683
24s Dövriyyə: 13.14M
Həcm (son): 96.46K
Texniki İcmal
ASTER ötən sessiya ərzində təmiz və davamlı yüksəliş nümayiş etdirib; $0.6683 yaxınlığındakı alçaldan nöqtədən qalxaraq sessiya daxilində $0.7393 səviyyəsinə çatdıqdan sonra $0.7253 ətrafında nisbətən yüngül konsolidasiyaya keçib.
Hərəkətli Orta Hədlər (15d):
MA7: 0.7266
MA14: 0.7232
MA28: 0.7162
Qısa-, orta- və uzunmüddətli hərəkətli ortalar aydın şəkildə bullish uyğunlaşma şəklindədir (MA7 > MA14 > MA28). Qiymət artım boyunca bu üç səviyyənin hamısının üzərində hərəkət edib — bu, tipik yüksəliş trendi strukturu kimi görünür. Hərəkətli ortalar bir-birinə yaxınlaşmaqdan çox yuxarıya “fan” kimi açılır; bu da impulsun hələ mənalı şəkildə zəifləmədiyini göstərir.
Qiymət Hərəkəti: Hərəkət əsasən nizamlı olub; yüksəliş zamanı yaşıl şamlar üstünlük təşkil edib və yolda yalnız dayaz korreksiyalar qeydə alınıb. Ən son şamlar yüksək səviyyələr yaxınlığında (~$0.7393) bir qədər qırmızı bədənlər göstərir; bu, kəskin yüksəlişdən sonra qısamüddətli mənfəətin götürülməsi və ya müqavimət testini işarə edə bilər. Qiymət hazırda həmin gündaxili yüksəkliyin bir qədər alt hissəsində dayanıb və qazancı “həzm edir”.
Həcm: İlkin yuxarı qırılma ilə birlikdə həcm artımı müşahidə olunub; həcm overlay üzərində MA5 (285.60K) hələ də MA10 (217.50K)-dan yuxarıda qalır — bu, hərəkətin aşağı inamlı driftdən deyil, tələblə idarə olunduğunu göstərir.
Diqqət Ediləcək Əsas Səviyyələr
Müqavimət: $0.7393 (sessiyanın yüksək nöqtəsi)
Dəstək: MA7/MA14 klasteri (~$0.723–0.727), ardınca $0.7058 pivotu
Nəticə
Qiymət qısa müddətli hərəkətli ortaların üzərində qaldıqca struktur konstruktiv olaraq qalır. $0.7393 üzərində qəti bağlanış davamın siqnalı ola bilər; MA7/MA14 zolağının altına düşmə isə yüksəlişin tempinin azaldığını göstərə və $0.7058 istiqamətində daha dərin korreksiyaya yol aça bilər. $ASTER
Qiymət: $0.7253 (+6.77%) | ≈$0.72 ABŞ dolları
Sessiya Xülasəsi
24s Yüksək: $0.7393
24s Aşağı: $0.6683
24s Dövriyyə: 13.14M
Həcm (son): 96.46K
Texniki İcmal
ASTER ötən sessiya ərzində təmiz və davamlı yüksəliş nümayiş etdirib; $0.6683 yaxınlığındakı alçaldan nöqtədən qalxaraq sessiya daxilində $0.7393 səviyyəsinə çatdıqdan sonra $0.7253 ətrafında nisbətən yüngül konsolidasiyaya keçib.
Hərəkətli Orta Hədlər (15d):
MA7: 0.7266
MA14: 0.7232
MA28: 0.7162
Qısa-, orta- və uzunmüddətli hərəkətli ortalar aydın şəkildə bullish uyğunlaşma şəklindədir (MA7 > MA14 > MA28). Qiymət artım boyunca bu üç səviyyənin hamısının üzərində hərəkət edib — bu, tipik yüksəliş trendi strukturu kimi görünür. Hərəkətli ortalar bir-birinə yaxınlaşmaqdan çox yuxarıya “fan” kimi açılır; bu da impulsun hələ mənalı şəkildə zəifləmədiyini göstərir.
Qiymət Hərəkəti: Hərəkət əsasən nizamlı olub; yüksəliş zamanı yaşıl şamlar üstünlük təşkil edib və yolda yalnız dayaz korreksiyalar qeydə alınıb. Ən son şamlar yüksək səviyyələr yaxınlığında (~$0.7393) bir qədər qırmızı bədənlər göstərir; bu, kəskin yüksəlişdən sonra qısamüddətli mənfəətin götürülməsi və ya müqavimət testini işarə edə bilər. Qiymət hazırda həmin gündaxili yüksəkliyin bir qədər alt hissəsində dayanıb və qazancı “həzm edir”.
Həcm: İlkin yuxarı qırılma ilə birlikdə həcm artımı müşahidə olunub; həcm overlay üzərində MA5 (285.60K) hələ də MA10 (217.50K)-dan yuxarıda qalır — bu, hərəkətin aşağı inamlı driftdən deyil, tələblə idarə olunduğunu göstərir.
Diqqət Ediləcək Əsas Səviyyələr
Müqavimət: $0.7393 (sessiyanın yüksək nöqtəsi)
Dəstək: MA7/MA14 klasteri (~$0.723–0.727), ardınca $0.7058 pivotu
Nəticə
Qiymət qısa müddətli hərəkətli ortaların üzərində qaldıqca struktur konstruktiv olaraq qalır. $0.7393 üzərində qəti bağlanış davamın siqnalı ola bilər; MA7/MA14 zolağının altına düşmə isə yüksəlişin tempinin azaldığını göstərə və $0.7058 istiqamətində daha dərin korreksiyaya yol aça bilər. $ASTER
166
·
--
Artım
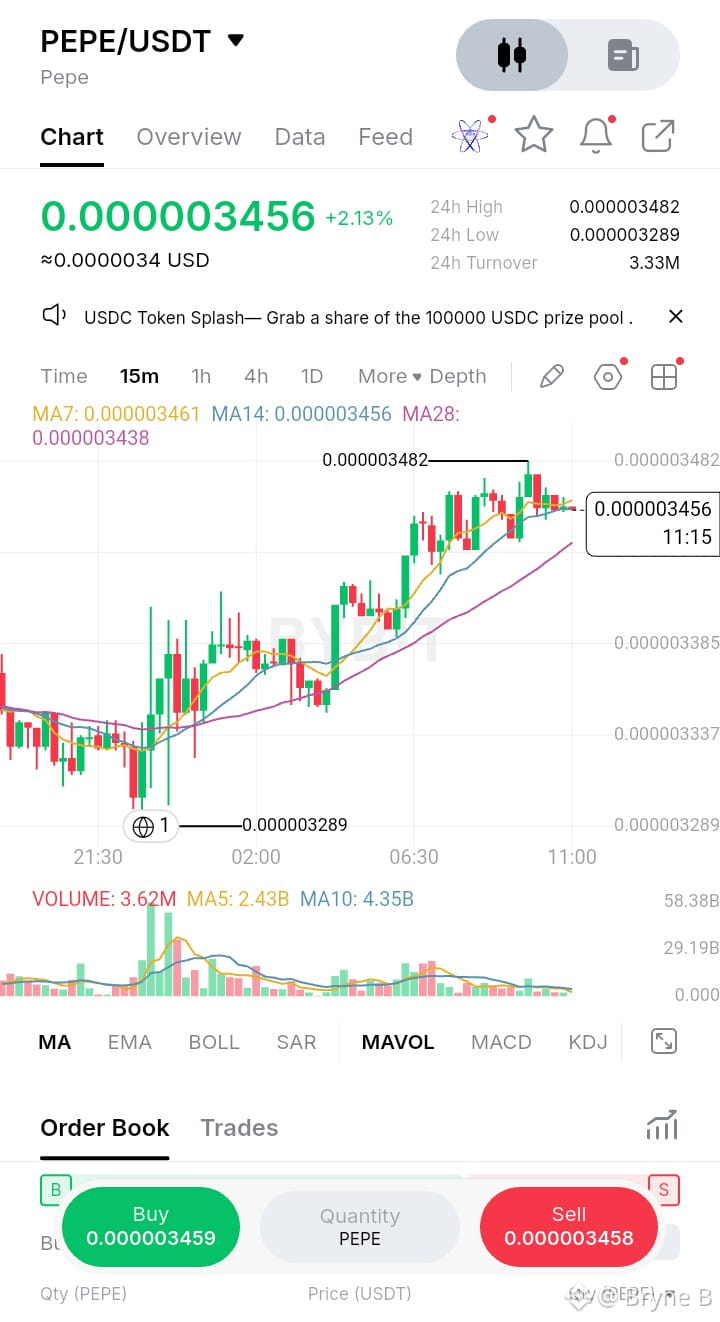
PEPE bu gün, 17 sentyabr 2026-cı il tarixində saat 11:15 UTC-ə olan məlumata görə 0.000003456 ABŞ dolları səviyyəsində ticarət edir; 24 saatlıq minimum 0.000003289 dollardan geri dönərək maksimum 0.000003482 dollara çatdıqdan sonra sessiya üzrə 2.13% artım göstərib. Son 24 saatda dövriyyə Bybit-in PEPE/USDT cütlüyündə təxminən 3.33M civarındadır — bu, mülayim hərəkətdir, amma erkən $PEPE August-dan bəri investorların struktur olaraq boğa meyli kimi xarakterizə etdiyi fonla üst-üstə düşür.
Bunu diqqətəlayiq edən təkcə geri dönüş deyil — bunun faydasını kim görə bilər. 5 avqust 2026-cı il tarixində Santiment bir gün ərzində birja daxilindən 4.54 trilyon PEPE-nin xalis çıxışını qeydə aldı; bu, 2024-cü ilin noyabrından bəri ən böyük kənar axın idi. Top-100 cüzdanin 30 gün ərzində payları təxminən 6% artaraq təxminən 86 trilyon tokendə qərarlaşdı. Bu, adətən “satış təzyiqinin azalması” kimi təqdim olunur. Lakin Canary Capital-ın 8 aprel 2026-cı il tarixli spot-ETF S-1 sənədi 2026-cı ilin yanvarına olan vəziyyətə görə, yalnız ilk on PEPE cüzdanının dövriyyədə olan tədarükün təxminən 41%-ni saxladığını açıqlayıb. Soyuducuda (cold storage) çıxışlar və eyni ünvanlar qrupuna konsentrasiya — eyni əsas faktı təsvir edən iki yoldur.
Bu boşluq PEPE-dən kənara çıxır. Az sayda cüzdan həm “təchizat şoku” narrativini, həm də real float-u hərəkətə gətirə bilirsə, bu, ticker-dən asılı olmayaraq eyni səviyyədə araşdırılmağa layiqdir. Canary ETF-si isə, sənəd verilməsindən beş ay keçməsinə baxmayaraq hələ də SEC-in baxışındadır və təsdiqlənmə üçün heç bir zaman cədvəli açıqlanmayıb.
Bütün bunlar mitinqin (rally) süni şəkildə yaradıldığı demək deyil. Bu, yığılma hekayəsinin və konsentrasiya riskinin eyni cüzdanları təsvir etdiyini göstərir — çıxışlar holder sayının artımı ilə birlikdə davam edirsə, yoxsa daha az sayda şəxsdə daha böyük balanslarla sadəcə böyüyürsə, izləməyə dəyər.
$PEPE #PEPE #Crypto
PEPE bu gün, 17 sentyabr 2026-cı il tarixində saat 11:15 UTC-ə olan məlumata görə 0.000003456 ABŞ dolları səviyyəsində ticarət edir; 24 saatlıq minimum 0.000003289 dollardan geri dönərək maksimum 0.000003482 dollara çatdıqdan sonra sessiya üzrə 2.13% artım göstərib. Son 24 saatda dövriyyə Bybit-in PEPE/USDT cütlüyündə təxminən 3.33M civarındadır — bu, mülayim hərəkətdir, amma erkən $PEPE August-dan bəri investorların struktur olaraq boğa meyli kimi xarakterizə etdiyi fonla üst-üstə düşür.
Bunu diqqətəlayiq edən təkcə geri dönüş deyil — bunun faydasını kim görə bilər. 5 avqust 2026-cı il tarixində Santiment bir gün ərzində birja daxilindən 4.54 trilyon PEPE-nin xalis çıxışını qeydə aldı; bu, 2024-cü ilin noyabrından bəri ən böyük kənar axın idi. Top-100 cüzdanin 30 gün ərzində payları təxminən 6% artaraq təxminən 86 trilyon tokendə qərarlaşdı. Bu, adətən “satış təzyiqinin azalması” kimi təqdim olunur. Lakin Canary Capital-ın 8 aprel 2026-cı il tarixli spot-ETF S-1 sənədi 2026-cı ilin yanvarına olan vəziyyətə görə, yalnız ilk on PEPE cüzdanının dövriyyədə olan tədarükün təxminən 41%-ni saxladığını açıqlayıb. Soyuducuda (cold storage) çıxışlar və eyni ünvanlar qrupuna konsentrasiya — eyni əsas faktı təsvir edən iki yoldur.
Bu boşluq PEPE-dən kənara çıxır. Az sayda cüzdan həm “təchizat şoku” narrativini, həm də real float-u hərəkətə gətirə bilirsə, bu, ticker-dən asılı olmayaraq eyni səviyyədə araşdırılmağa layiqdir. Canary ETF-si isə, sənəd verilməsindən beş ay keçməsinə baxmayaraq hələ də SEC-in baxışındadır və təsdiqlənmə üçün heç bir zaman cədvəli açıqlanmayıb.
Bütün bunlar mitinqin (rally) süni şəkildə yaradıldığı demək deyil. Bu, yığılma hekayəsinin və konsentrasiya riskinin eyni cüzdanları təsvir etdiyini göstərir — çıxışlar holder sayının artımı ilə birlikdə davam edirsə, yoxsa daha az sayda şəxsdə daha böyük balanslarla sadəcə böyüyürsə, izləməyə dəyər.
$PEPE #PEPE #Crypto
Bunu diqqətəlayiq edən təkcə geri dönüş deyil — bunun faydasını kim görə bilər. 5 avqust 2026-cı il tarixində Santiment bir gün ərzində birja daxilindən 4.54 trilyon PEPE-nin xalis çıxışını qeydə aldı; bu, 2024-cü ilin noyabrından bəri ən böyük kənar axın idi. Top-100 cüzdanin 30 gün ərzində payları təxminən 6% artaraq təxminən 86 trilyon tokendə qərarlaşdı. Bu, adətən “satış təzyiqinin azalması” kimi təqdim olunur. Lakin Canary Capital-ın 8 aprel 2026-cı il tarixli spot-ETF S-1 sənədi 2026-cı ilin yanvarına olan vəziyyətə görə, yalnız ilk on PEPE cüzdanının dövriyyədə olan tədarükün təxminən 41%-ni saxladığını açıqlayıb. Soyuducuda (cold storage) çıxışlar və eyni ünvanlar qrupuna konsentrasiya — eyni əsas faktı təsvir edən iki yoldur.
Bu boşluq PEPE-dən kənara çıxır. Az sayda cüzdan həm “təchizat şoku” narrativini, həm də real float-u hərəkətə gətirə bilirsə, bu, ticker-dən asılı olmayaraq eyni səviyyədə araşdırılmağa layiqdir. Canary ETF-si isə, sənəd verilməsindən beş ay keçməsinə baxmayaraq hələ də SEC-in baxışındadır və təsdiqlənmə üçün heç bir zaman cədvəli açıqlanmayıb.
Bütün bunlar mitinqin (rally) süni şəkildə yaradıldığı demək deyil. Bu, yığılma hekayəsinin və konsentrasiya riskinin eyni cüzdanları təsvir etdiyini göstərir — çıxışlar holder sayının artımı ilə birlikdə davam edirsə, yoxsa daha az sayda şəxsdə daha böyük balanslarla sadəcə böyüyürsə, izləməyə dəyər.
$PEPE #PEPE #Crypto
300
·
--
Tərcüməyə bax
well said
well said


RonyZ
·
--
Bazarlar emosiyalarla hərəkət etmir.
Onlar likvidlik stimulları ilə hərəkət edir.
Kapital hər zaman bir sadə sual verir:
“Ən çox gəliri riskimi artırmadan haradan ala bilərəm?”
Bir dövrün əvvəlində cavab təhlükəsizlikdir.
Dövrün ortasında, bu, səmərəlilikdir.
Dövrün sonunda, bu, reaktivlikdir.
Bunun səbəbi pulun rotasiyasıdır, investorların ehtiyatsız olmasından deyil, amma gəlirlər ən zirvədə sıxışdıqda.
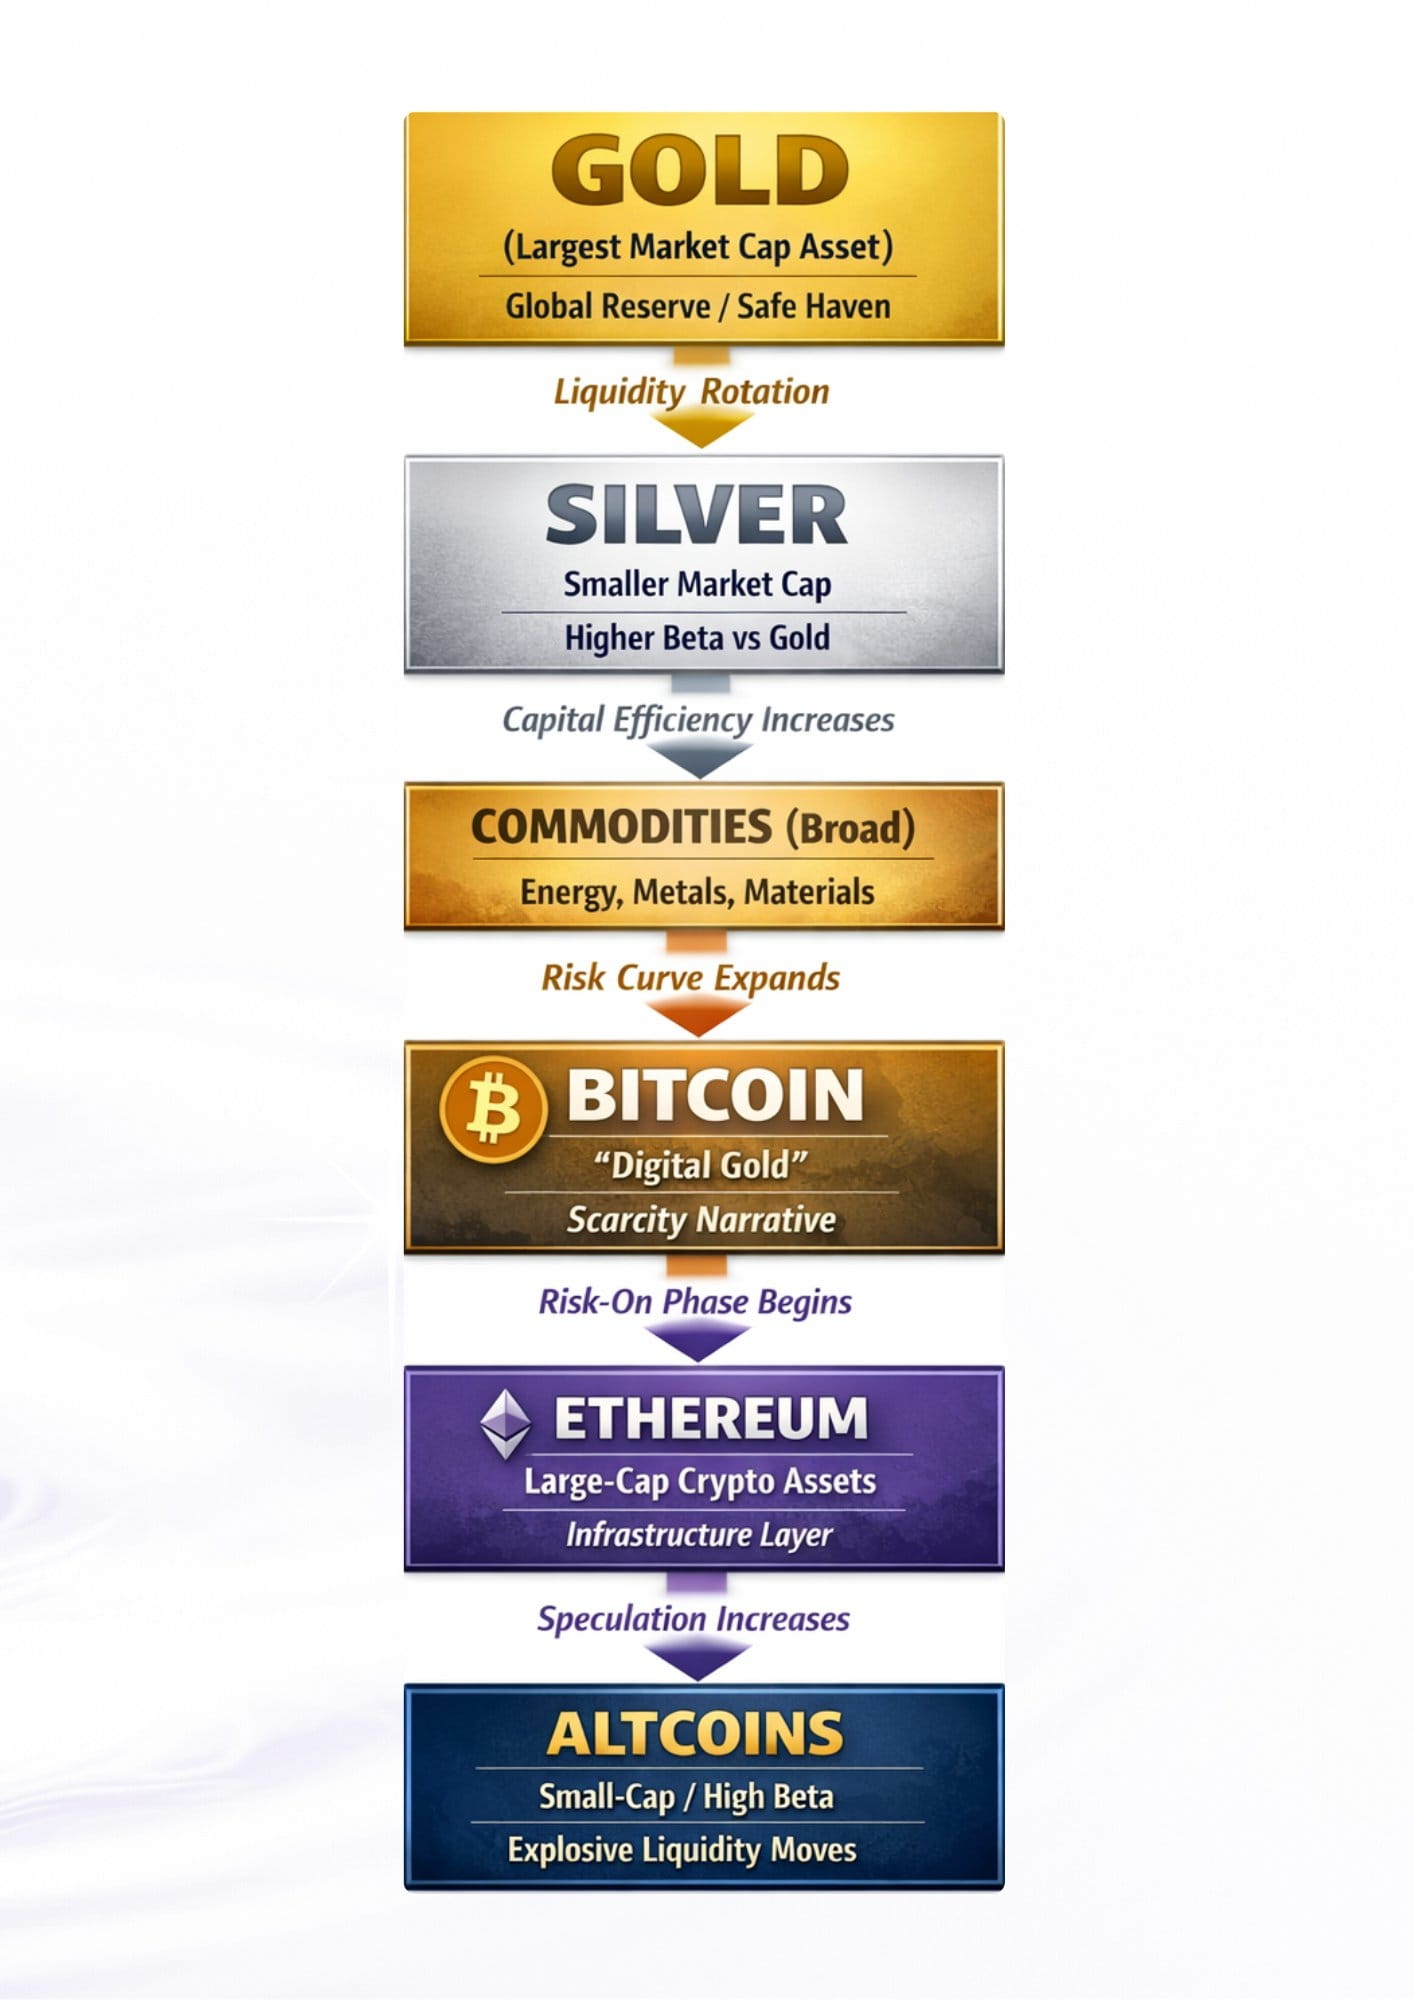
Qızıl və Gümüş güclü gəlir təqdim etməyi dayandıqda, kapital hərəkət etməlidir.
Risk eyni qalır.
Mükafat azalmaqdadır.
Beləliklə, likvidlik aşağı axır:
Qızıl → Gümüş → Bitcoin → ETH & böyük kapitalar → orta kapitalar → kiçik kapitalar → memlər.
Eyni pul.
Kiçik bazarlar.
Böyük qiymət reaksiyaları.
Bunu aşağı axan su kimi düşünün.
Yuxarıdakı böyük konteynerlərin daşması üçün çox şeyə ehtiyacı var.
Aşağıdakı kiçik konteynerlər isə çox az şeylə daşır.
Su artmadı.
Konteynerlər sadəcə kiçik oldu.
Narrativlər hər zaman hərəkətdən sonra gəlir:
“Qızıl = fiat sığortası”
“Bitcoin = rəqəmsal qızıl”
“Alts = yenilik”
Bu, yalnız səmərəlilik tapan təkrar likvidlikdir.
Biz yalnız bu axının erkən mərhələlərindəyik.
Gerçək daşmalar daha sonra gələcək.
#Market_Update #market_tips #liquidity #CryptoMarketAnalysis #BinanceSquareFamily
Onlar likvidlik stimulları ilə hərəkət edir.
Kapital hər zaman bir sadə sual verir:
“Ən çox gəliri riskimi artırmadan haradan ala bilərəm?”
Bir dövrün əvvəlində cavab təhlükəsizlikdir.
Dövrün ortasında, bu, səmərəlilikdir.
Dövrün sonunda, bu, reaktivlikdir.
Bunun səbəbi pulun rotasiyasıdır, investorların ehtiyatsız olmasından deyil, amma gəlirlər ən zirvədə sıxışdıqda.
Qızıl və Gümüş güclü gəlir təqdim etməyi dayandıqda, kapital hərəkət etməlidir.
Risk eyni qalır.
Mükafat azalmaqdadır.
Beləliklə, likvidlik aşağı axır:
Qızıl → Gümüş → Bitcoin → ETH & böyük kapitalar → orta kapitalar → kiçik kapitalar → memlər.
Eyni pul.
Kiçik bazarlar.
Böyük qiymət reaksiyaları.
Bunu aşağı axan su kimi düşünün.
Yuxarıdakı böyük konteynerlərin daşması üçün çox şeyə ehtiyacı var.
Aşağıdakı kiçik konteynerlər isə çox az şeylə daşır.
Su artmadı.
Konteynerlər sadəcə kiçik oldu.
Narrativlər hər zaman hərəkətdən sonra gəlir:
“Qızıl = fiat sığortası”
“Bitcoin = rəqəmsal qızıl”
“Alts = yenilik”
Bu, yalnız səmərəlilik tapan təkrar likvidlikdir.
Biz yalnız bu axının erkən mərhələlərindəyik.
Gerçək daşmalar daha sonra gələcək.
#Market_Update #market_tips #liquidity #CryptoMarketAnalysis #BinanceSquareFamily
·
--
Tərcüməyə bax
BREAKING NEWS from BlackRock & Larry Fink! 🔥
The financial world is on the edge of another revolution! 💥
👑 Larry Fink, CEO of BlackRock, just CONFIRMED — the company is launching its own blockchain-based asset tokenization platform! 💎
Yes, the world’s largest asset manager is going all in on the digital future of traditional finance! 🚀
🔍 What’s happening?
BlackRock plans to tokenize its iShares ETFs, giving investors direct access to stocks and bonds through digital wallets! 💰📲
Fink described this as “a move toward the tokenization of all assets” — and it’s truly a game changer 🧠⚡
💼 Fun fact: BlackRock already launched BUIDL, a tokenized money market fund worth around $2.8B, created in partnership with Securitize 🏦
📈 Why this matters for Crypto & TradFi:
✨ TradFi x DeFi: Tokenizing real-world assets enables instant settlements, fractional ownership, and 24/7 trading
💳 Access for everyone: Retail investors can finally invest in high-end traditional assets directly from their wallets
⚙️ Efficiency boost: Fewer middlemen = lower costs + full transparency
🏛️ Institutional trust: With BlackRock in the game, this isn’t an experiment — it’s the start of a new financial era 🌐
⚠️ But there are still challenges:
🔒 Regulations and custody of digital securities need to evolve
🧩 Blockchain infrastructure must handle massive scaling
👥 Adoption depends on trust, user education, and seamless experience
---
💬 TL;DR:
BlackRock is making a bold leap into blockchain, bridging the gap between traditional assets and the crypto ecosystem. 🌍
If this succeeds, it could become the biggest bridge ever built between DeFi and Wall Street! 🚀
👇
🔥 Follow me so you don’t miss the hottest crypto updates!
❤️ Smash that like button & share your thoughts 💭
My fam — I appreciate you all! 💪💫
$BNB $SAGA $SOL
BREAKING NEWS from BlackRock & Larry Fink! 🔥
The financial world is on the edge of another revolution! 💥
👑 Larry Fink, CEO of BlackRock, just CONFIRMED — the company is launching its own blockchain-based asset tokenization platform! 💎
Yes, the world’s largest asset manager is going all in on the digital future of traditional finance! 🚀
🔍 What’s happening?
BlackRock plans to tokenize its iShares ETFs, giving investors direct access to stocks and bonds through digital wallets! 💰📲
Fink described this as “a move toward the tokenization of all assets” — and it’s truly a game changer 🧠⚡
💼 Fun fact: BlackRock already launched BUIDL, a tokenized money market fund worth around $2.8B, created in partnership with Securitize 🏦
📈 Why this matters for Crypto & TradFi:
✨ TradFi x DeFi: Tokenizing real-world assets enables instant settlements, fractional ownership, and 24/7 trading
💳 Access for everyone: Retail investors can finally invest in high-end traditional assets directly from their wallets
⚙️ Efficiency boost: Fewer middlemen = lower costs + full transparency
🏛️ Institutional trust: With BlackRock in the game, this isn’t an experiment — it’s the start of a new financial era 🌐
⚠️ But there are still challenges:
🔒 Regulations and custody of digital securities need to evolve
🧩 Blockchain infrastructure must handle massive scaling
👥 Adoption depends on trust, user education, and seamless experience
---
💬 TL;DR:
BlackRock is making a bold leap into blockchain, bridging the gap between traditional assets and the crypto ecosystem. 🌍
If this succeeds, it could become the biggest bridge ever built between DeFi and Wall Street! 🚀
👇
🔥 Follow me so you don’t miss the hottest crypto updates!
❤️ Smash that like button & share your thoughts 💭
My fam — I appreciate you all! 💪💫
$BNB $SAGA $SOL
The financial world is on the edge of another revolution! 💥
👑 Larry Fink, CEO of BlackRock, just CONFIRMED — the company is launching its own blockchain-based asset tokenization platform! 💎
Yes, the world’s largest asset manager is going all in on the digital future of traditional finance! 🚀
🔍 What’s happening?
BlackRock plans to tokenize its iShares ETFs, giving investors direct access to stocks and bonds through digital wallets! 💰📲
Fink described this as “a move toward the tokenization of all assets” — and it’s truly a game changer 🧠⚡
💼 Fun fact: BlackRock already launched BUIDL, a tokenized money market fund worth around $2.8B, created in partnership with Securitize 🏦
📈 Why this matters for Crypto & TradFi:
✨ TradFi x DeFi: Tokenizing real-world assets enables instant settlements, fractional ownership, and 24/7 trading
💳 Access for everyone: Retail investors can finally invest in high-end traditional assets directly from their wallets
⚙️ Efficiency boost: Fewer middlemen = lower costs + full transparency
🏛️ Institutional trust: With BlackRock in the game, this isn’t an experiment — it’s the start of a new financial era 🌐
⚠️ But there are still challenges:
🔒 Regulations and custody of digital securities need to evolve
🧩 Blockchain infrastructure must handle massive scaling
👥 Adoption depends on trust, user education, and seamless experience
---
💬 TL;DR:
BlackRock is making a bold leap into blockchain, bridging the gap between traditional assets and the crypto ecosystem. 🌍
If this succeeds, it could become the biggest bridge ever built between DeFi and Wall Street! 🚀
👇
🔥 Follow me so you don’t miss the hottest crypto updates!
❤️ Smash that like button & share your thoughts 💭
My fam — I appreciate you all! 💪💫
$BNB $SAGA $SOL
·
--
Azalma
Tərcüməyə bax
🧊 Bitcoin Faces Bearish Pressure: What’s Driving the Downtrend?
The crypto market is showing signs of uncertainty as Bitcoin (BTC) experiences a bearish sentiment, with 58% of traders currently feeling pessimistic about its short-term outlook. BTC’s price has dropped by 4.90%, hovering around $105,761, reflecting broader weakness across the market.
📉 Market Overview
The overall crypto market cap stands at $3.58 trillion, marking a 5.29% decline, while the 24-hour trading volume has surged by 36.32%, reaching $271.66 billion. This indicates heightened activity — likely driven by traders reacting to volatility rather than new investments entering the market.
Adding to the pressure, BTC ETF net outflows of $530.9 million signal that institutional investors are taking profits or reducing exposure, contributing further to the sell-off.
😨 Fear & Greed Index: Fear Dominates
The Fear & Greed Index is currently at 28, firmly in the “Fear” zone. This shows investors’ growing caution amid recent dips, suggesting a potential lack of confidence in the near-term market recovery.
🔍 Broader Impact
Other major cryptocurrencies are also under pressure — BNB is down 8.90% and DOGE has fallen 8.44%, mirroring Bitcoin’s trend. This correlation highlights a widespread correction phase rather than an isolated BTC movement.
🧠 What Traders Should Watch
While short-term sentiment remains bearish, such pullbacks often create opportunities for accumulation. Historically, Bitcoin corrections have been followed by periods of consolidation before the next bullish cycle.
Key factors to monitor include:
BTC ETF inflows/outflows
Macroeconomic conditions (interest rates, inflation data)
Market liquidity and volume trends
In summary: Bitcoin is facing a temporary bearish wave, driven by investor fear and ETF outflows. However, volatility is part of crypto’s DNA — and those who understand market cycles know that fear often precedes opportunity.
#MarketPullback #BTC
#ShareYourThoughtOnBTC
🧊 Bitcoin Faces Bearish Pressure: What’s Driving the Downtrend?
The crypto market is showing signs of uncertainty as Bitcoin (BTC) experiences a bearish sentiment, with 58% of traders currently feeling pessimistic about its short-term outlook. BTC’s price has dropped by 4.90%, hovering around $105,761, reflecting broader weakness across the market.
📉 Market Overview
The overall crypto market cap stands at $3.58 trillion, marking a 5.29% decline, while the 24-hour trading volume has surged by 36.32%, reaching $271.66 billion. This indicates heightened activity — likely driven by traders reacting to volatility rather than new investments entering the market.
Adding to the pressure, BTC ETF net outflows of $530.9 million signal that institutional investors are taking profits or reducing exposure, contributing further to the sell-off.
😨 Fear & Greed Index: Fear Dominates
The Fear & Greed Index is currently at 28, firmly in the “Fear” zone. This shows investors’ growing caution amid recent dips, suggesting a potential lack of confidence in the near-term market recovery.
🔍 Broader Impact
Other major cryptocurrencies are also under pressure — BNB is down 8.90% and DOGE has fallen 8.44%, mirroring Bitcoin’s trend. This correlation highlights a widespread correction phase rather than an isolated BTC movement.
🧠 What Traders Should Watch
While short-term sentiment remains bearish, such pullbacks often create opportunities for accumulation. Historically, Bitcoin corrections have been followed by periods of consolidation before the next bullish cycle.
Key factors to monitor include:
BTC ETF inflows/outflows
Macroeconomic conditions (interest rates, inflation data)
Market liquidity and volume trends
In summary: Bitcoin is facing a temporary bearish wave, driven by investor fear and ETF outflows. However, volatility is part of crypto’s DNA — and those who understand market cycles know that fear often precedes opportunity.
#MarketPullback #BTC
#ShareYourThoughtOnBTC
The crypto market is showing signs of uncertainty as Bitcoin (BTC) experiences a bearish sentiment, with 58% of traders currently feeling pessimistic about its short-term outlook. BTC’s price has dropped by 4.90%, hovering around $105,761, reflecting broader weakness across the market.
📉 Market Overview
The overall crypto market cap stands at $3.58 trillion, marking a 5.29% decline, while the 24-hour trading volume has surged by 36.32%, reaching $271.66 billion. This indicates heightened activity — likely driven by traders reacting to volatility rather than new investments entering the market.
Adding to the pressure, BTC ETF net outflows of $530.9 million signal that institutional investors are taking profits or reducing exposure, contributing further to the sell-off.
😨 Fear & Greed Index: Fear Dominates
The Fear & Greed Index is currently at 28, firmly in the “Fear” zone. This shows investors’ growing caution amid recent dips, suggesting a potential lack of confidence in the near-term market recovery.
🔍 Broader Impact
Other major cryptocurrencies are also under pressure — BNB is down 8.90% and DOGE has fallen 8.44%, mirroring Bitcoin’s trend. This correlation highlights a widespread correction phase rather than an isolated BTC movement.
🧠 What Traders Should Watch
While short-term sentiment remains bearish, such pullbacks often create opportunities for accumulation. Historically, Bitcoin corrections have been followed by periods of consolidation before the next bullish cycle.
Key factors to monitor include:
BTC ETF inflows/outflows
Macroeconomic conditions (interest rates, inflation data)
Market liquidity and volume trends
In summary: Bitcoin is facing a temporary bearish wave, driven by investor fear and ETF outflows. However, volatility is part of crypto’s DNA — and those who understand market cycles know that fear often precedes opportunity.
#MarketPullback #BTC
#ShareYourThoughtOnBTC
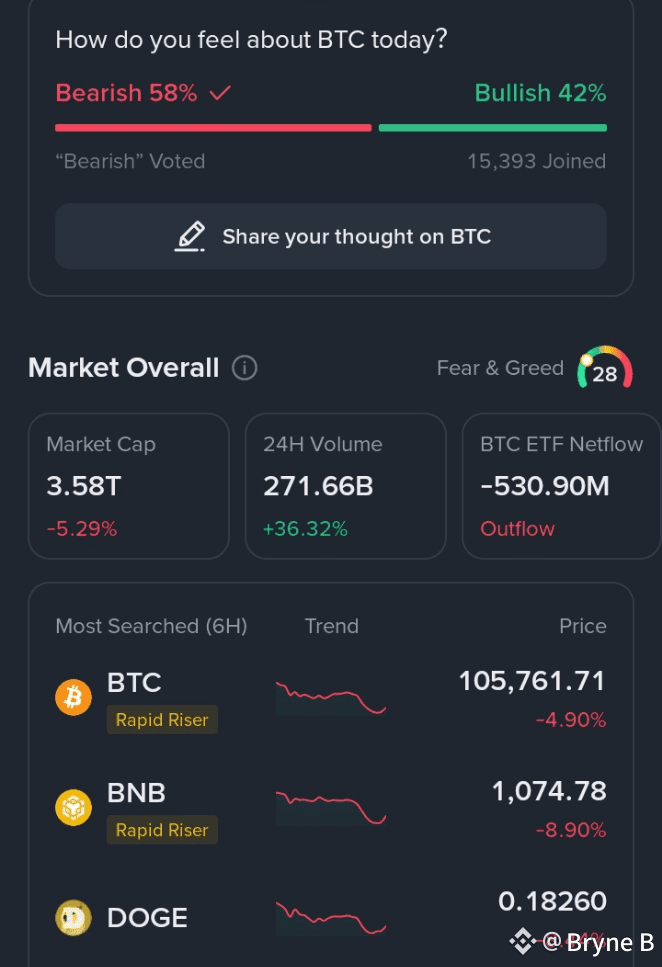
40
·
--
Tərcüməyə bax
Most people hear about crypto and think it’s only about buying coins and getting rich fast.
But the truth is — crypto is about empowering YOU to control your money without relying on banks or governments.
Here’s what makes it powerful 👇
🔹 Decentralization – No single authority controls it. The power is shared across a global network.
🔹 Blockchain Transparency – Every transaction is recorded publicly, making fraud almost impossible.
🔹 Limited Supply = Real Value – Unlike printed money, most cryptocurrencies have a fixed supply, protecting against inflation.
🔹 Global Access – Whether you’re in New York or Nairobi, crypto lets you send or receive money instantly and cheaply.
🔹 Innovation Beyond Coins – From NFTs to DeFi to tokenized assets, crypto is building a new digital economy.
💬 Remember: Don’t just trade crypto — understand it.
Knowledge is your strongest investment.
Most people hear about crypto and think it’s only about buying coins and getting rich fast.
But the truth is — crypto is about empowering YOU to control your money without relying on banks or governments.
Here’s what makes it powerful 👇
🔹 Decentralization – No single authority controls it. The power is shared across a global network.
🔹 Blockchain Transparency – Every transaction is recorded publicly, making fraud almost impossible.
🔹 Limited Supply = Real Value – Unlike printed money, most cryptocurrencies have a fixed supply, protecting against inflation.
🔹 Global Access – Whether you’re in New York or Nairobi, crypto lets you send or receive money instantly and cheaply.
🔹 Innovation Beyond Coins – From NFTs to DeFi to tokenized assets, crypto is building a new digital economy.
💬 Remember: Don’t just trade crypto — understand it.
Knowledge is your strongest investment.
But the truth is — crypto is about empowering YOU to control your money without relying on banks or governments.
Here’s what makes it powerful 👇
🔹 Decentralization – No single authority controls it. The power is shared across a global network.
🔹 Blockchain Transparency – Every transaction is recorded publicly, making fraud almost impossible.
🔹 Limited Supply = Real Value – Unlike printed money, most cryptocurrencies have a fixed supply, protecting against inflation.
🔹 Global Access – Whether you’re in New York or Nairobi, crypto lets you send or receive money instantly and cheaply.
🔹 Innovation Beyond Coins – From NFTs to DeFi to tokenized assets, crypto is building a new digital economy.
💬 Remember: Don’t just trade crypto — understand it.
Knowledge is your strongest investment.
9
9
·
--
Tərcüməyə bax
Is there any new coin launching
#Write2Earnn
Is there any new coin launching
#Write2Earnn
#Write2Earnn
4
4
Daha çox kontent araşdırmaq üçün daxil olun
Binance Square-də qlobal kriptovalyuta istifadəçilərinə qoşulun
⚡️ Kriptovalyuta haqqında ən son və faydalı məlumatları əldə edin.
💬 Dünyanın ən böyük kriptovalyuta birjası tərəfindən etibar edilir.
👍 Doğrulanmış yaradıcılardan gələn real məlumatları kəşf edin.
E-poçt/Telefon nömrəsi
Trenddə olan mövzular
CircleMints500MUSDCOnSolana
4,794 baxış
Müzakirə edir: 285
💰 BÖYÜK: Circle Solanada $500M $USDC mint etdi!
Circle cəmi 2 tranzaksiyada ( $250M + $250M ) sentyabrın 25-də Solanada 500 Milyon $USDC mint edib — cəmi 5,5 saata! 🚀
Solanada indi $7.48B+ $USDC üstünlüyü var — $14.7B stabilkoin təchizatının 50%-dən çoxu.
Niyə Solana?
⚡️ Sürət: 65k TPS
💸 Aşağı komissiya: $0.00025
🔥 DeFi Mərkəzi: Jupiter, Raydium yüksəlir
Bu, ən böyük tək günlük mintlərdən biridir & Solana ekosistemi üçün GÜCLÜ institusional tələbin siqnaldır.
$SOL üçün bullish? 👇
#Circle #USDC #Solana #Stablecoin #DeFi#circlemints500musdconsolana
True News
·8 bəyənmə
·3.9k baxış
PolymarketBankFailureBetsDrawFDICConcern
18,165 baxış
Müzakirə edir: 513
BlackRockBuildsTokenizedPortfoliosForOndo
13,908 baxış
Müzakirə edir: 355