

Kamile Uray 1
61 Paylaşımlar

Kamile Uray 1
Şikayət et
İstifadəçini blokla
Economist, Halkbank Financial Analysis Expert, Strategic Planning Manager of the Ministry of Commerce, Trader & Investor & Trainer
0 İzlənilir
2 İzləyicilər
4 Bəyəndi
Postlar
Tərcüməyə bax
We haven't looked at BTC and USDT dominance for quite some time.
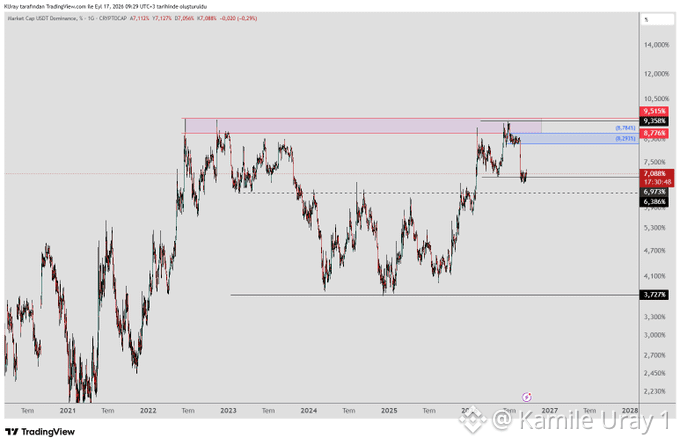
#USDT Dominance has given the first signal that a decline has begun by closing the day below 6.97. Any upward moves from here should be viewed as mere reactions to the downtrend. This bearish outlook would be invalidated if the price closes above 9.36. A drop in USDT dominance indicates that investors are shifting capital into BTC or altcoins.
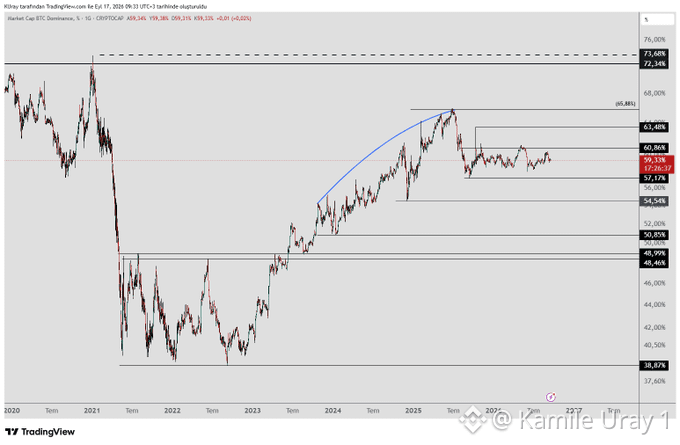
When we look at #BTC Dominance, bearish patterns have emerged; if it remains below 57, the decline is likely to continue.
An analysis of the patterns forming in both dominance metrics suggests that a decline is the most probable outcome. This strengthens the likelihood of a rotation into altcoins.
Of course, I do not expect this to apply to *all* altcoins; I anticipate gains primarily for those with favorable charts, active teams, and solid projects.
We haven't looked at BTC and USDT dominance for quite some time.
#USDT Dominance has given the first signal that a decline has begun by closing the day below 6.97. Any upward moves from here should be viewed as mere reactions to the downtrend. This bearish outlook would be invalidated if the price closes above 9.36. A drop in USDT dominance indicates that investors are shifting capital into BTC or altcoins.
When we look at #BTC Dominance, bearish patterns have emerged; if it remains below 57, the decline is likely to continue.
An analysis of the patterns forming in both dominance metrics suggests that a decline is the most probable outcome. This strengthens the likelihood of a rotation into altcoins.
Of course, I do not expect this to apply to *all* altcoins; I anticipate gains primarily for those with favorable charts, active teams, and solid projects.
#USDT Dominance has given the first signal that a decline has begun by closing the day below 6.97. Any upward moves from here should be viewed as mere reactions to the downtrend. This bearish outlook would be invalidated if the price closes above 9.36. A drop in USDT dominance indicates that investors are shifting capital into BTC or altcoins.
When we look at #BTC Dominance, bearish patterns have emerged; if it remains below 57, the decline is likely to continue.
An analysis of the patterns forming in both dominance metrics suggests that a decline is the most probable outcome. This strengthens the likelihood of a rotation into altcoins.
Of course, I do not expect this to apply to *all* altcoins; I anticipate gains primarily for those with favorable charts, active teams, and solid projects.
54
Tərcüməyə bax
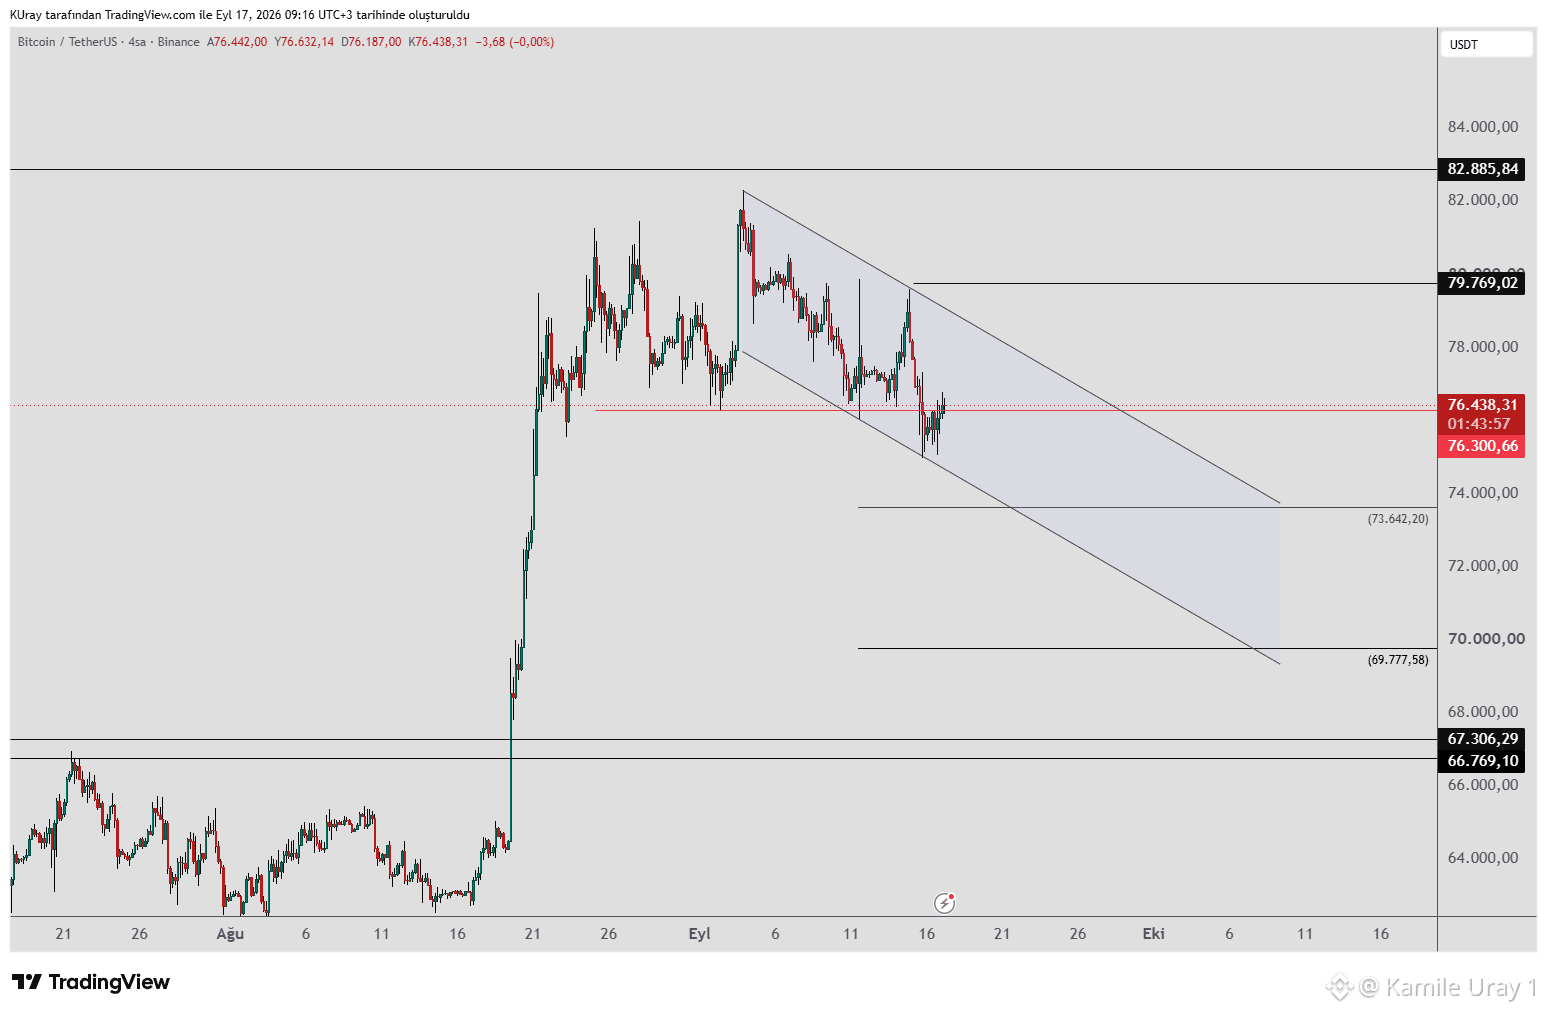
#BTC The downward wave is moving within a channel. The upper band of this channel may act as resistance, while the lower band acts as support. As long as the upper band remains unbroken (a breakout would require a daily close around 79,800), there is a possibility that the decline will continue.
During the decline, we will monitor support levels at 73,642, 69,777, 67,306, and 66,769. If buying pressure emerges at any of these levels, a renewed rise is expected. The decline could potentially form the final shoulder of an Inverse Head and Shoulders (IH&S) pattern; if the price holds above 83,000, the pattern would activate, and a continued rise toward upper resistance levels would be anticipated.
If a daily or weekly close occurs above 82,885, it would mark the first higher peak relative to the recent downward wave. This would provide a further signal that the upward trend is likely to continue, after which we can monitor the upper resistance levels.
#BTC The downward wave is moving within a channel. The upper band of this channel may act as resistance, while the lower band acts as support. As long as the upper band remains unbroken (a breakout would require a daily close around 79,800), there is a possibility that the decline will continue.
During the decline, we will monitor support levels at 73,642, 69,777, 67,306, and 66,769. If buying pressure emerges at any of these levels, a renewed rise is expected. The decline could potentially form the final shoulder of an Inverse Head and Shoulders (IH&S) pattern; if the price holds above 83,000, the pattern would activate, and a continued rise toward upper resistance levels would be anticipated.
If a daily or weekly close occurs above 82,885, it would mark the first higher peak relative to the recent downward wave. This would provide a further signal that the upward trend is likely to continue, after which we can monitor the upper resistance levels.
During the decline, we will monitor support levels at 73,642, 69,777, 67,306, and 66,769. If buying pressure emerges at any of these levels, a renewed rise is expected. The decline could potentially form the final shoulder of an Inverse Head and Shoulders (IH&S) pattern; if the price holds above 83,000, the pattern would activate, and a continued rise toward upper resistance levels would be anticipated.
If a daily or weekly close occurs above 82,885, it would mark the first higher peak relative to the recent downward wave. This would provide a further signal that the upward trend is likely to continue, after which we can monitor the upper resistance levels.
55
Tərcüməyə bax
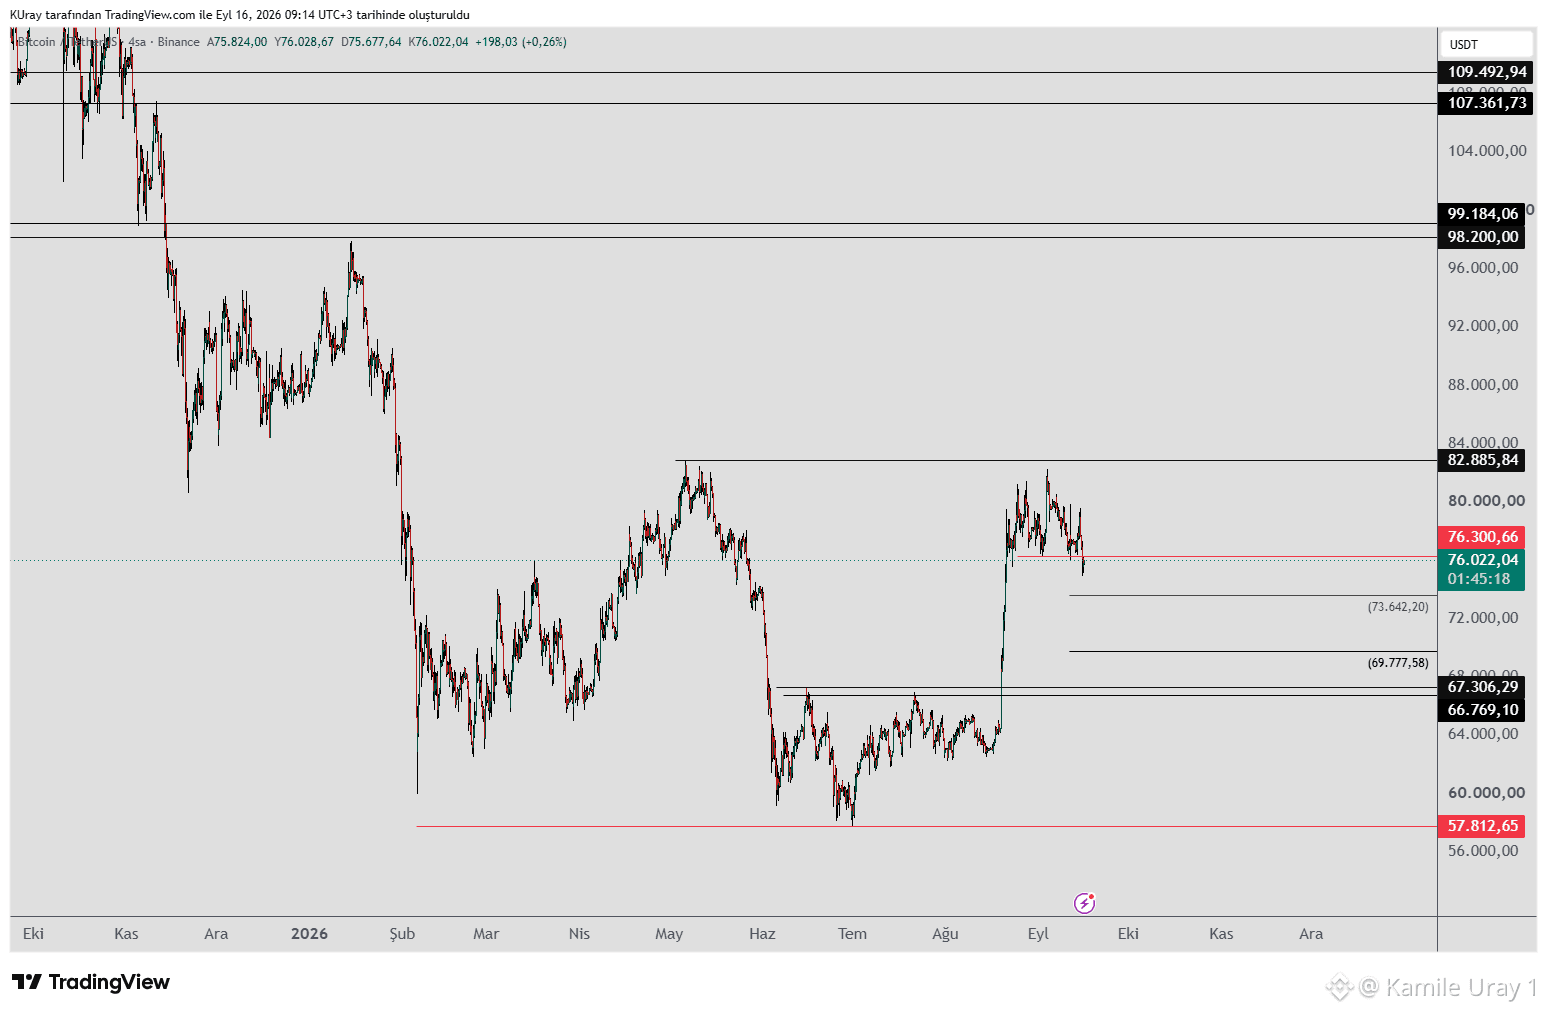
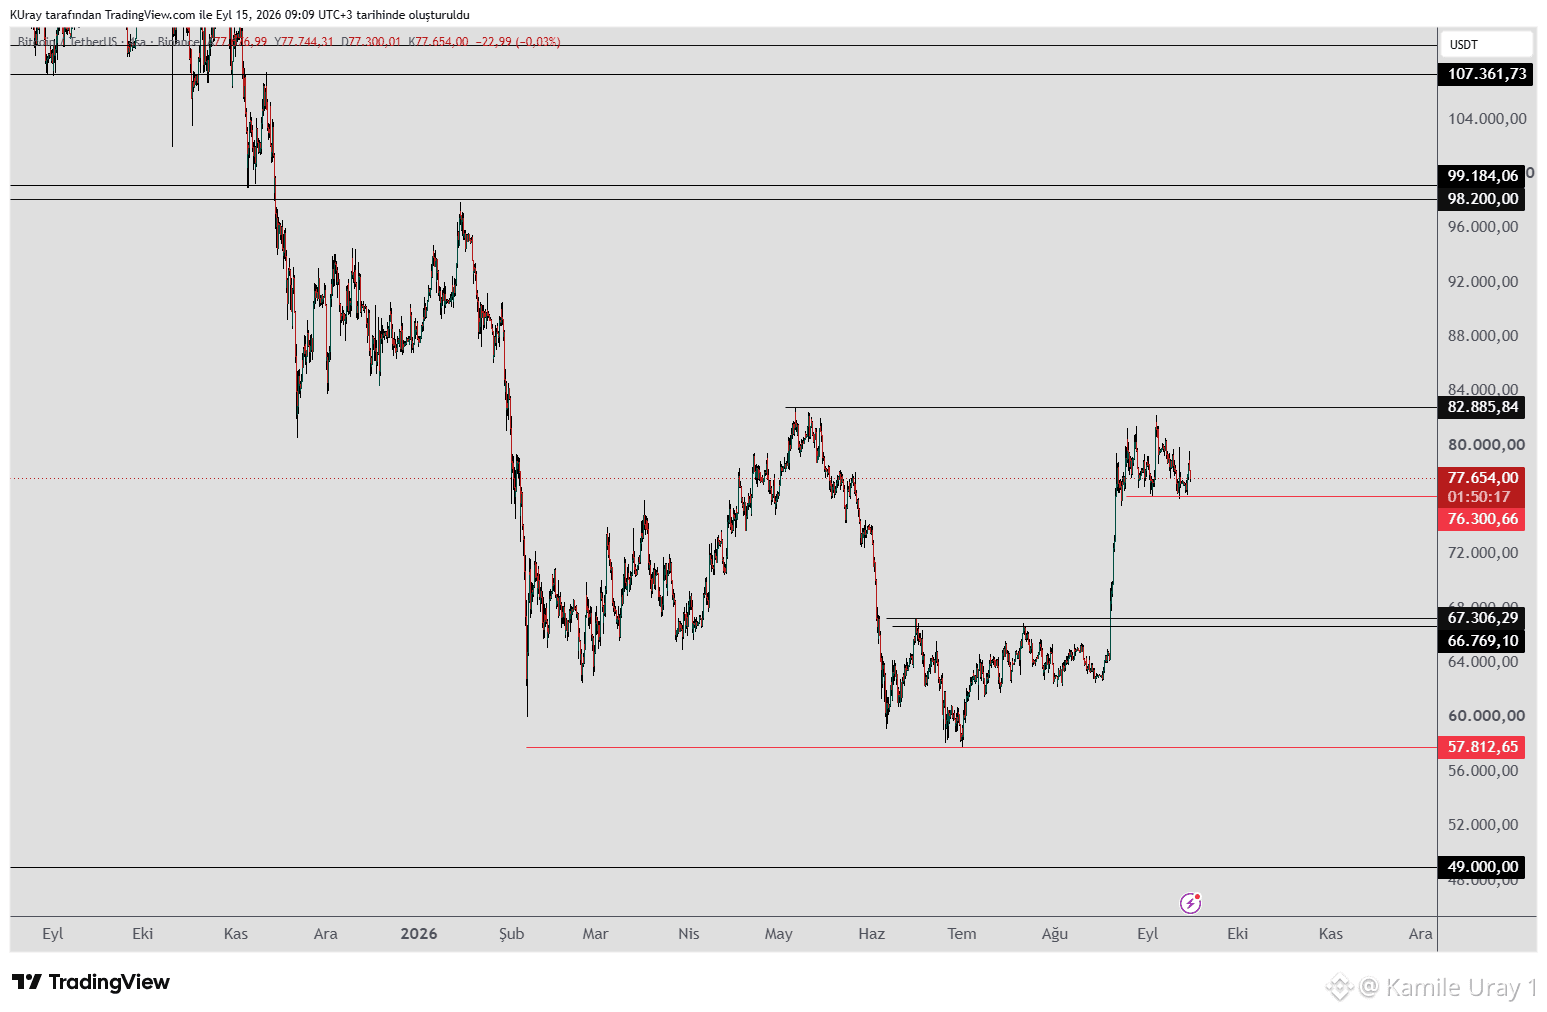
#BTC closed below the 76,300 level prior to the announcement of the Fed's interest rate decision. This has raised the possibility of a continued decline.
During the decline, we will monitor support levels at 73,642, 69,777, 67,306, and 66,769.
If buying activity emerges at any of these levels, a renewed rise is expected.
The decline could potentially form the final shoulder of an inverse head-and-shoulders (H&S) pattern. If the price holds above 83,000, the pattern would be activated, and a continued rise toward upper resistance levels would be anticipated.
If a daily or weekly close occurs above 82,885, it would mark the first higher peak relative to the most recent downward wave. This would provide a further signal that the upward trend is likely to continue, after which upper resistance levels can be monitored.
#BTC closed below the 76,300 level prior to the announcement of the Fed's interest rate decision. This has raised the possibility of a continued decline.
During the decline, we will monitor support levels at 73,642, 69,777, 67,306, and 66,769.
If buying activity emerges at any of these levels, a renewed rise is expected.
The decline could potentially form the final shoulder of an inverse head-and-shoulders (H&S) pattern. If the price holds above 83,000, the pattern would be activated, and a continued rise toward upper resistance levels would be anticipated.
If a daily or weekly close occurs above 82,885, it would mark the first higher peak relative to the most recent downward wave. This would provide a further signal that the upward trend is likely to continue, after which upper resistance levels can be monitored.
During the decline, we will monitor support levels at 73,642, 69,777, 67,306, and 66,769.
If buying activity emerges at any of these levels, a renewed rise is expected.
The decline could potentially form the final shoulder of an inverse head-and-shoulders (H&S) pattern. If the price holds above 83,000, the pattern would be activated, and a continued rise toward upper resistance levels would be anticipated.
If a daily or weekly close occurs above 82,885, it would mark the first higher peak relative to the most recent downward wave. This would provide a further signal that the upward trend is likely to continue, after which upper resistance levels can be monitored.
63
Tərcüməyə bax
#BTC appears set to trade within the same range until the Fed interest rate decision on the 16th.
Sharp price swings—in either direction—are likely on the day of the decision. We are keeping a close watch on the 76,300 level; regardless of volatility, 4-hour candle closes remain the key indicator for us.
As long as the price holds above 76,300 on the 4-hour chart, the potential for an upward move remains intact.
If the price closes below 76,300, there is a possibility of testing the support zone around 67,000–66,000. Such a decline could form the final shoulder of a potential inverse head-and-shoulders (H&S) pattern. If the price subsequently holds above 83,000, the pattern would be activated, and a continued rise toward upper resistance levels would be expected.
If a daily or weekly close occurs above 82,885, it would mark the first higher high relative to the most recent downward wave. This would provide further confirmation that the upward trend is likely to continue, allowing us to monitor the upper resistance levels thereafter.
#BTC appears set to trade within the same range until the Fed interest rate decision on the 16th.
Sharp price swings—in either direction—are likely on the day of the decision. We are keeping a close watch on the 76,300 level; regardless of volatility, 4-hour candle closes remain the key indicator for us.
As long as the price holds above 76,300 on the 4-hour chart, the potential for an upward move remains intact.
If the price closes below 76,300, there is a possibility of testing the support zone around 67,000–66,000. Such a decline could form the final shoulder of a potential inverse head-and-shoulders (H&S) pattern. If the price subsequently holds above 83,000, the pattern would be activated, and a continued rise toward upper resistance levels would be expected.
If a daily or weekly close occurs above 82,885, it would mark the first higher high relative to the most recent downward wave. This would provide further confirmation that the upward trend is likely to continue, allowing us to monitor the upper resistance levels thereafter.
Sharp price swings—in either direction—are likely on the day of the decision. We are keeping a close watch on the 76,300 level; regardless of volatility, 4-hour candle closes remain the key indicator for us.
As long as the price holds above 76,300 on the 4-hour chart, the potential for an upward move remains intact.
If the price closes below 76,300, there is a possibility of testing the support zone around 67,000–66,000. Such a decline could form the final shoulder of a potential inverse head-and-shoulders (H&S) pattern. If the price subsequently holds above 83,000, the pattern would be activated, and a continued rise toward upper resistance levels would be expected.
If a daily or weekly close occurs above 82,885, it would mark the first higher high relative to the most recent downward wave. This would provide further confirmation that the upward trend is likely to continue, allowing us to monitor the upper resistance levels thereafter.
61
Tərcüməyə bax
I spotted a potential Libra pattern. 🙂
Let me share it with you.
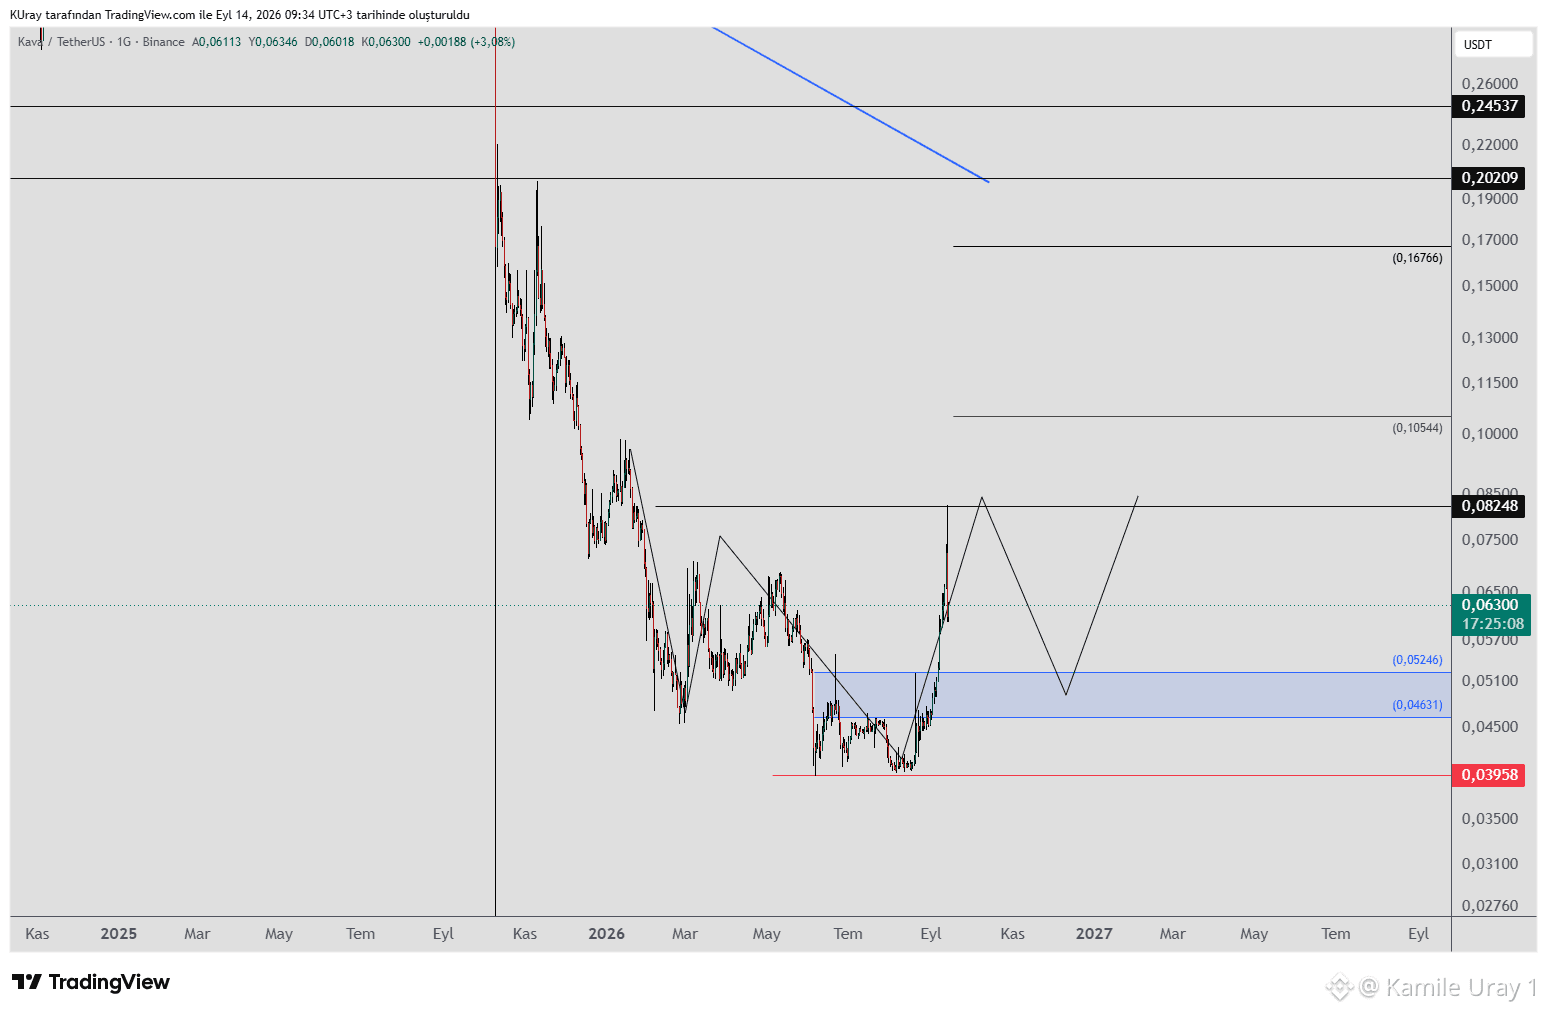
#KAVA : A Libra pattern could form if the price drops.
Entry zone: 0.05246–0.04631
Stop: 0.03958
Targets: 0.08248–0.10544–0.16766
You can determine your strategy based on your own risk appetite. I recommend using a stop-loss while tracking the trade.
I spotted a potential Libra pattern. 🙂
Let me share it with you.
#KAVA : A Libra pattern could form if the price drops.
Entry zone: 0.05246–0.04631
Stop: 0.03958
Targets: 0.08248–0.10544–0.16766
You can determine your strategy based on your own risk appetite. I recommend using a stop-loss while tracking the trade.
Let me share it with you.
#KAVA : A Libra pattern could form if the price drops.
Entry zone: 0.05246–0.04631
Stop: 0.03958
Targets: 0.08248–0.10544–0.16766
You can determine your strategy based on your own risk appetite. I recommend using a stop-loss while tracking the trade.
52
Tərcüməyə bax
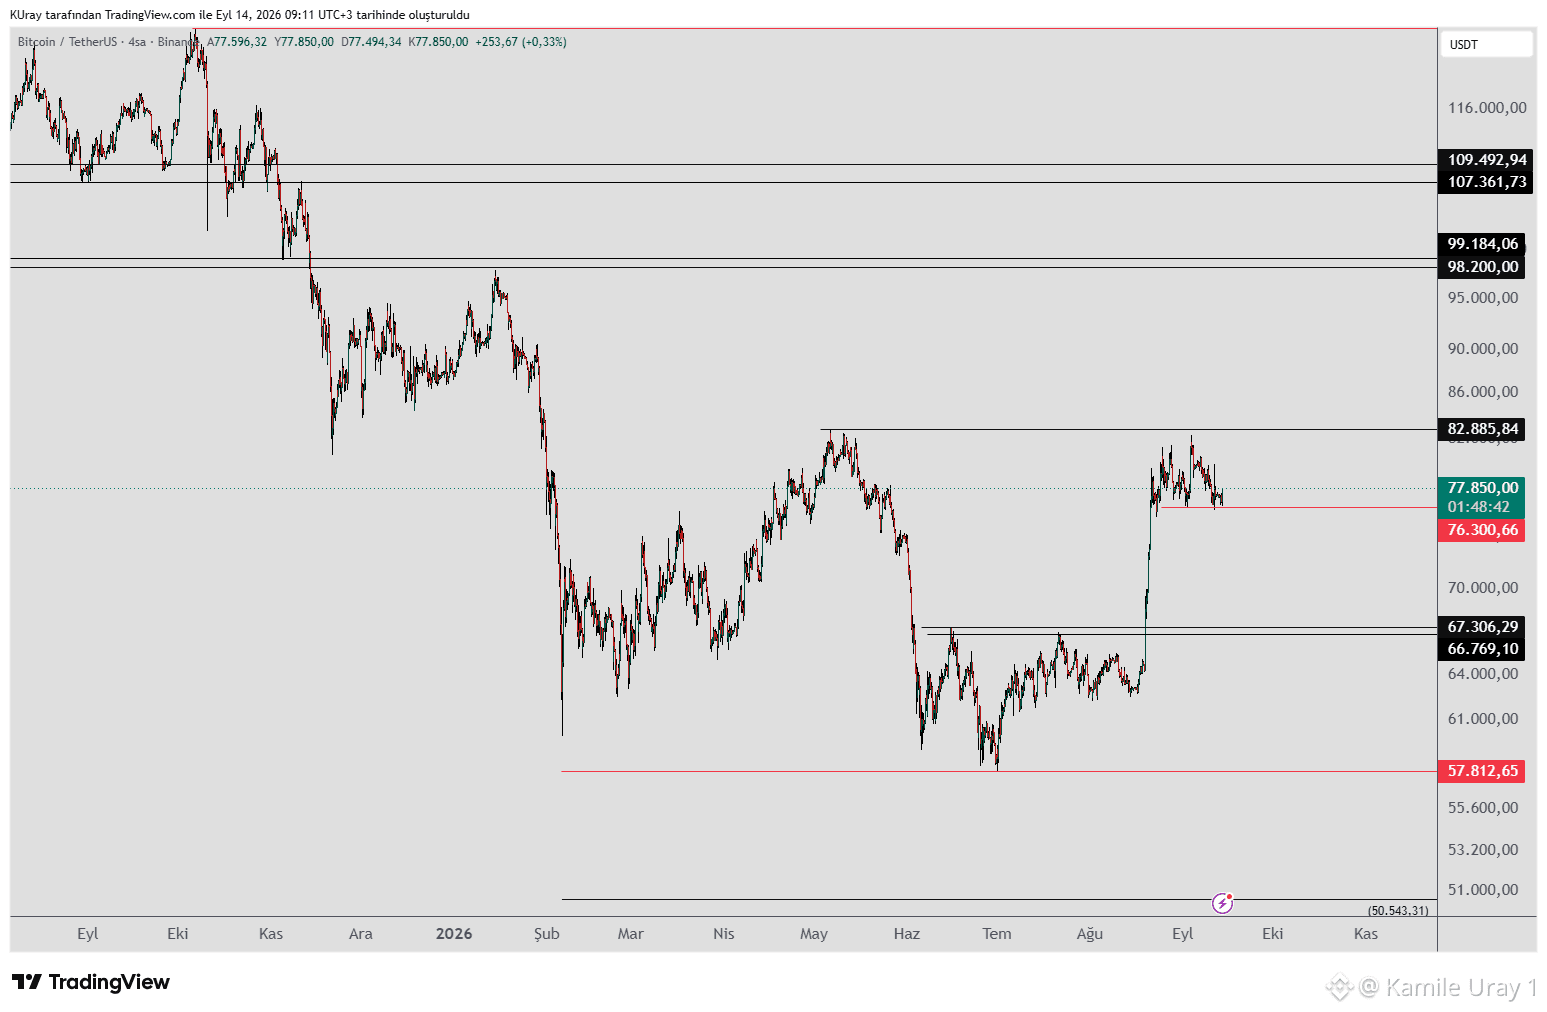
We are monitoring the #BTC level at 76,300. As long as it holds above this level, the potential for an upward move remains.
If the price closes below 76,300, there is a possibility of testing the support zone around 67,000–66,000. Declines could lead to the formation of the final shoulder of a potential inverse head-and-shoulders (H&S) pattern; if the price holds above 83,000, the pattern would activate, and a continued rise toward upper resistance levels would be expected.
If a daily or weekly close occurs above 82,885, it would mark the first higher peak relative to the most recent downward wave. This would provide another signal that the upward trend is likely to continue, after which upper resistance levels can be monitored.
We are monitoring the #BTC level at 76,300. As long as it holds above this level, the potential for an upward move remains.
If the price closes below 76,300, there is a possibility of testing the support zone around 67,000–66,000. Declines could lead to the formation of the final shoulder of a potential inverse head-and-shoulders (H&S) pattern; if the price holds above 83,000, the pattern would activate, and a continued rise toward upper resistance levels would be expected.
If a daily or weekly close occurs above 82,885, it would mark the first higher peak relative to the most recent downward wave. This would provide another signal that the upward trend is likely to continue, after which upper resistance levels can be monitored.
If the price closes below 76,300, there is a possibility of testing the support zone around 67,000–66,000. Declines could lead to the formation of the final shoulder of a potential inverse head-and-shoulders (H&S) pattern; if the price holds above 83,000, the pattern would activate, and a continued rise toward upper resistance levels would be expected.
If a daily or weekly close occurs above 82,885, it would mark the first higher peak relative to the most recent downward wave. This would provide another signal that the upward trend is likely to continue, after which upper resistance levels can be monitored.
70
Tərcüməyə bax
#BTC US PPI had risen, and CPI data is due today; it promises to be another volatile day for the markets. We will exercise caution, particularly with short-term trades.
Once the data is released, the market will stabilize and resume its movement.
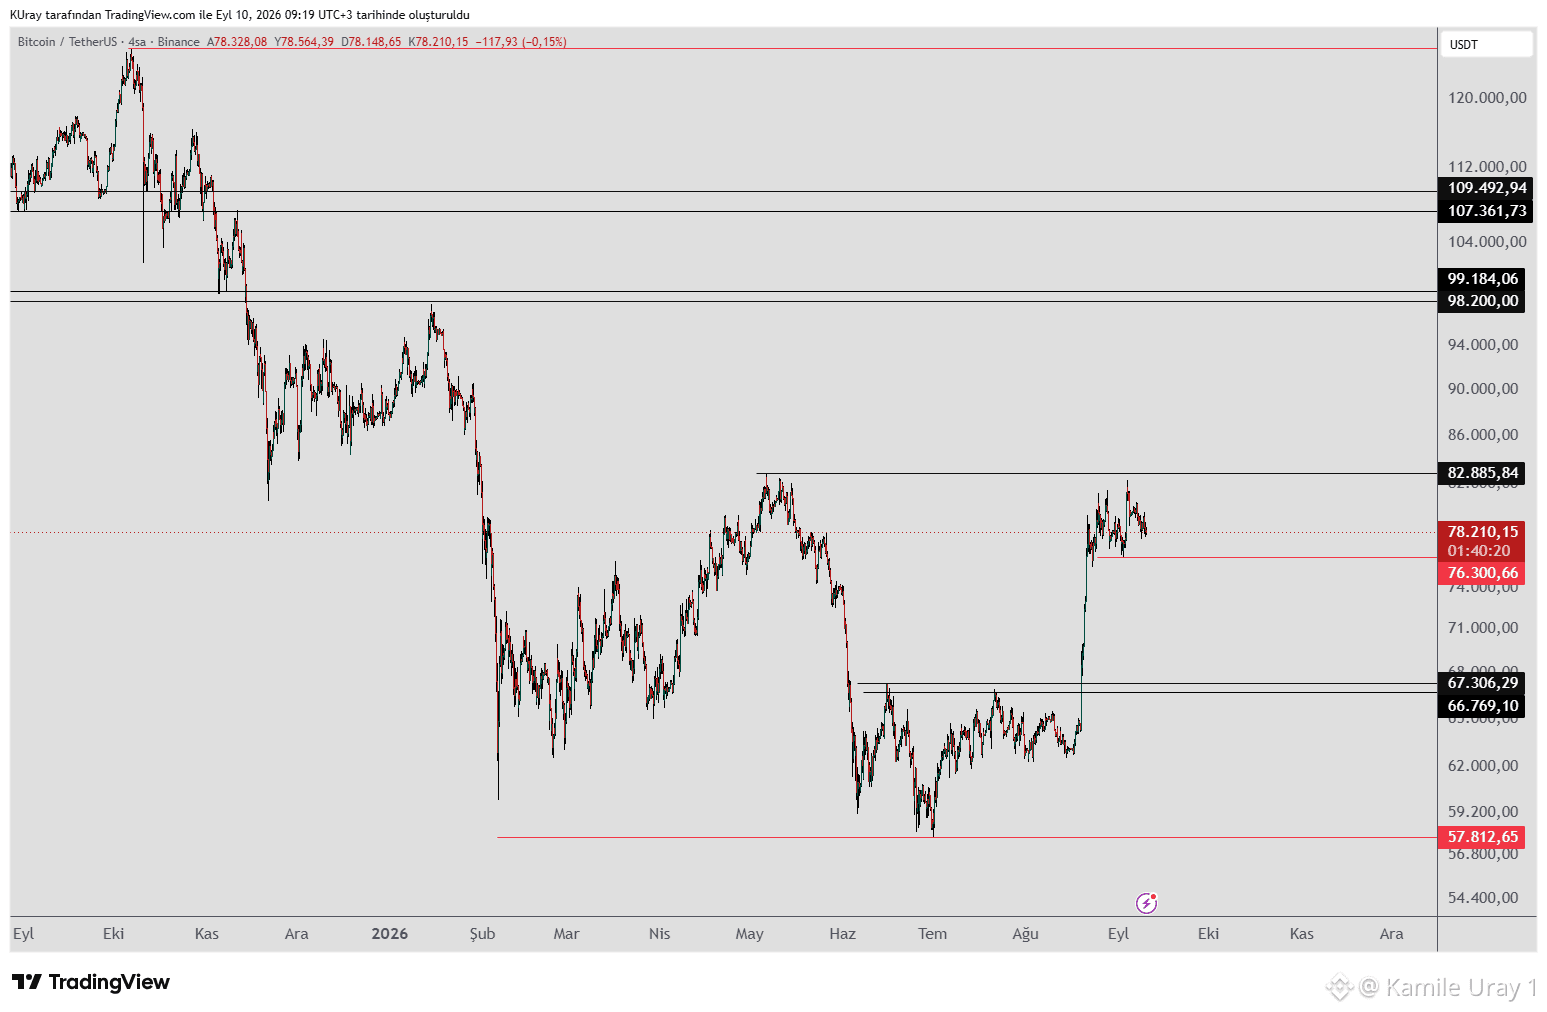
We are monitoring the $76,300 level for BTC. As long as it holds above this level, the potential for an upward move remains.
If a daily or weekly close occurs above $82,885, it would mark the first higher peak relative to the recent downward wave. This would provide another signal that the rally is likely to continue, after which we can monitor higher resistance levels.
If the price closes below $76,300, there is a possibility of testing the support zone around $66,000–$67,000. Such a decline could form the final shoulder of a potential inverse head-and-shoulders (H&S) pattern. If the price holds above $83,000, the pattern would be activated, and a continued rise toward higher resistance levels would be expected.
#BTC US PPI had risen, and CPI data is due today; it promises to be another volatile day for the markets. We will exercise caution, particularly with short-term trades.
Once the data is released, the market will stabilize and resume its movement.
We are monitoring the $76,300 level for BTC. As long as it holds above this level, the potential for an upward move remains.
If a daily or weekly close occurs above $82,885, it would mark the first higher peak relative to the recent downward wave. This would provide another signal that the rally is likely to continue, after which we can monitor higher resistance levels.
If the price closes below $76,300, there is a possibility of testing the support zone around $66,000–$67,000. Such a decline could form the final shoulder of a potential inverse head-and-shoulders (H&S) pattern. If the price holds above $83,000, the pattern would be activated, and a continued rise toward higher resistance levels would be expected.
Once the data is released, the market will stabilize and resume its movement.
We are monitoring the $76,300 level for BTC. As long as it holds above this level, the potential for an upward move remains.
If a daily or weekly close occurs above $82,885, it would mark the first higher peak relative to the recent downward wave. This would provide another signal that the rally is likely to continue, after which we can monitor higher resistance levels.
If the price closes below $76,300, there is a possibility of testing the support zone around $66,000–$67,000. Such a decline could form the final shoulder of a potential inverse head-and-shoulders (H&S) pattern. If the price holds above $83,000, the pattern would be activated, and a continued rise toward higher resistance levels would be expected.

55
Tərcüməyə bax
#BTC US producer inflation data is due today; markets tend to tread cautiously on data release days and experience sharp volatility once the figures are announced.
Therefore, short-term traders, in particular, should exercise caution.
As for BTC, the levels we are monitoring are clear: the potential for an upward move remains as long as the price stays above 76,300.
If a daily or weekly close occurs above 82,885, it would mark the first higher high relative to the most recent downward wave. This would provide a further signal that the uptrend is likely to continue, allowing us to monitor higher resistance levels thereafter.
If the price closes below 76,300, there is a possibility of testing the support zone around 67,000–66,000. Such a decline could form the final shoulder of a potential inverse head-and-shoulders (H&S) pattern. If the price subsequently holds above 83,000, the pattern would be activated, and a continued rise toward higher resistance levels would be expected.
#BTC US producer inflation data is due today; markets tend to tread cautiously on data release days and experience sharp volatility once the figures are announced.
Therefore, short-term traders, in particular, should exercise caution.
As for BTC, the levels we are monitoring are clear: the potential for an upward move remains as long as the price stays above 76,300.
If a daily or weekly close occurs above 82,885, it would mark the first higher high relative to the most recent downward wave. This would provide a further signal that the uptrend is likely to continue, allowing us to monitor higher resistance levels thereafter.
If the price closes below 76,300, there is a possibility of testing the support zone around 67,000–66,000. Such a decline could form the final shoulder of a potential inverse head-and-shoulders (H&S) pattern. If the price subsequently holds above 83,000, the pattern would be activated, and a continued rise toward higher resistance levels would be expected.
Therefore, short-term traders, in particular, should exercise caution.
As for BTC, the levels we are monitoring are clear: the potential for an upward move remains as long as the price stays above 76,300.
If a daily or weekly close occurs above 82,885, it would mark the first higher high relative to the most recent downward wave. This would provide a further signal that the uptrend is likely to continue, allowing us to monitor higher resistance levels thereafter.
If the price closes below 76,300, there is a possibility of testing the support zone around 67,000–66,000. Such a decline could form the final shoulder of a potential inverse head-and-shoulders (H&S) pattern. If the price subsequently holds above 83,000, the pattern would be activated, and a continued rise toward higher resistance levels would be expected.
65
Tərcüməyə bax
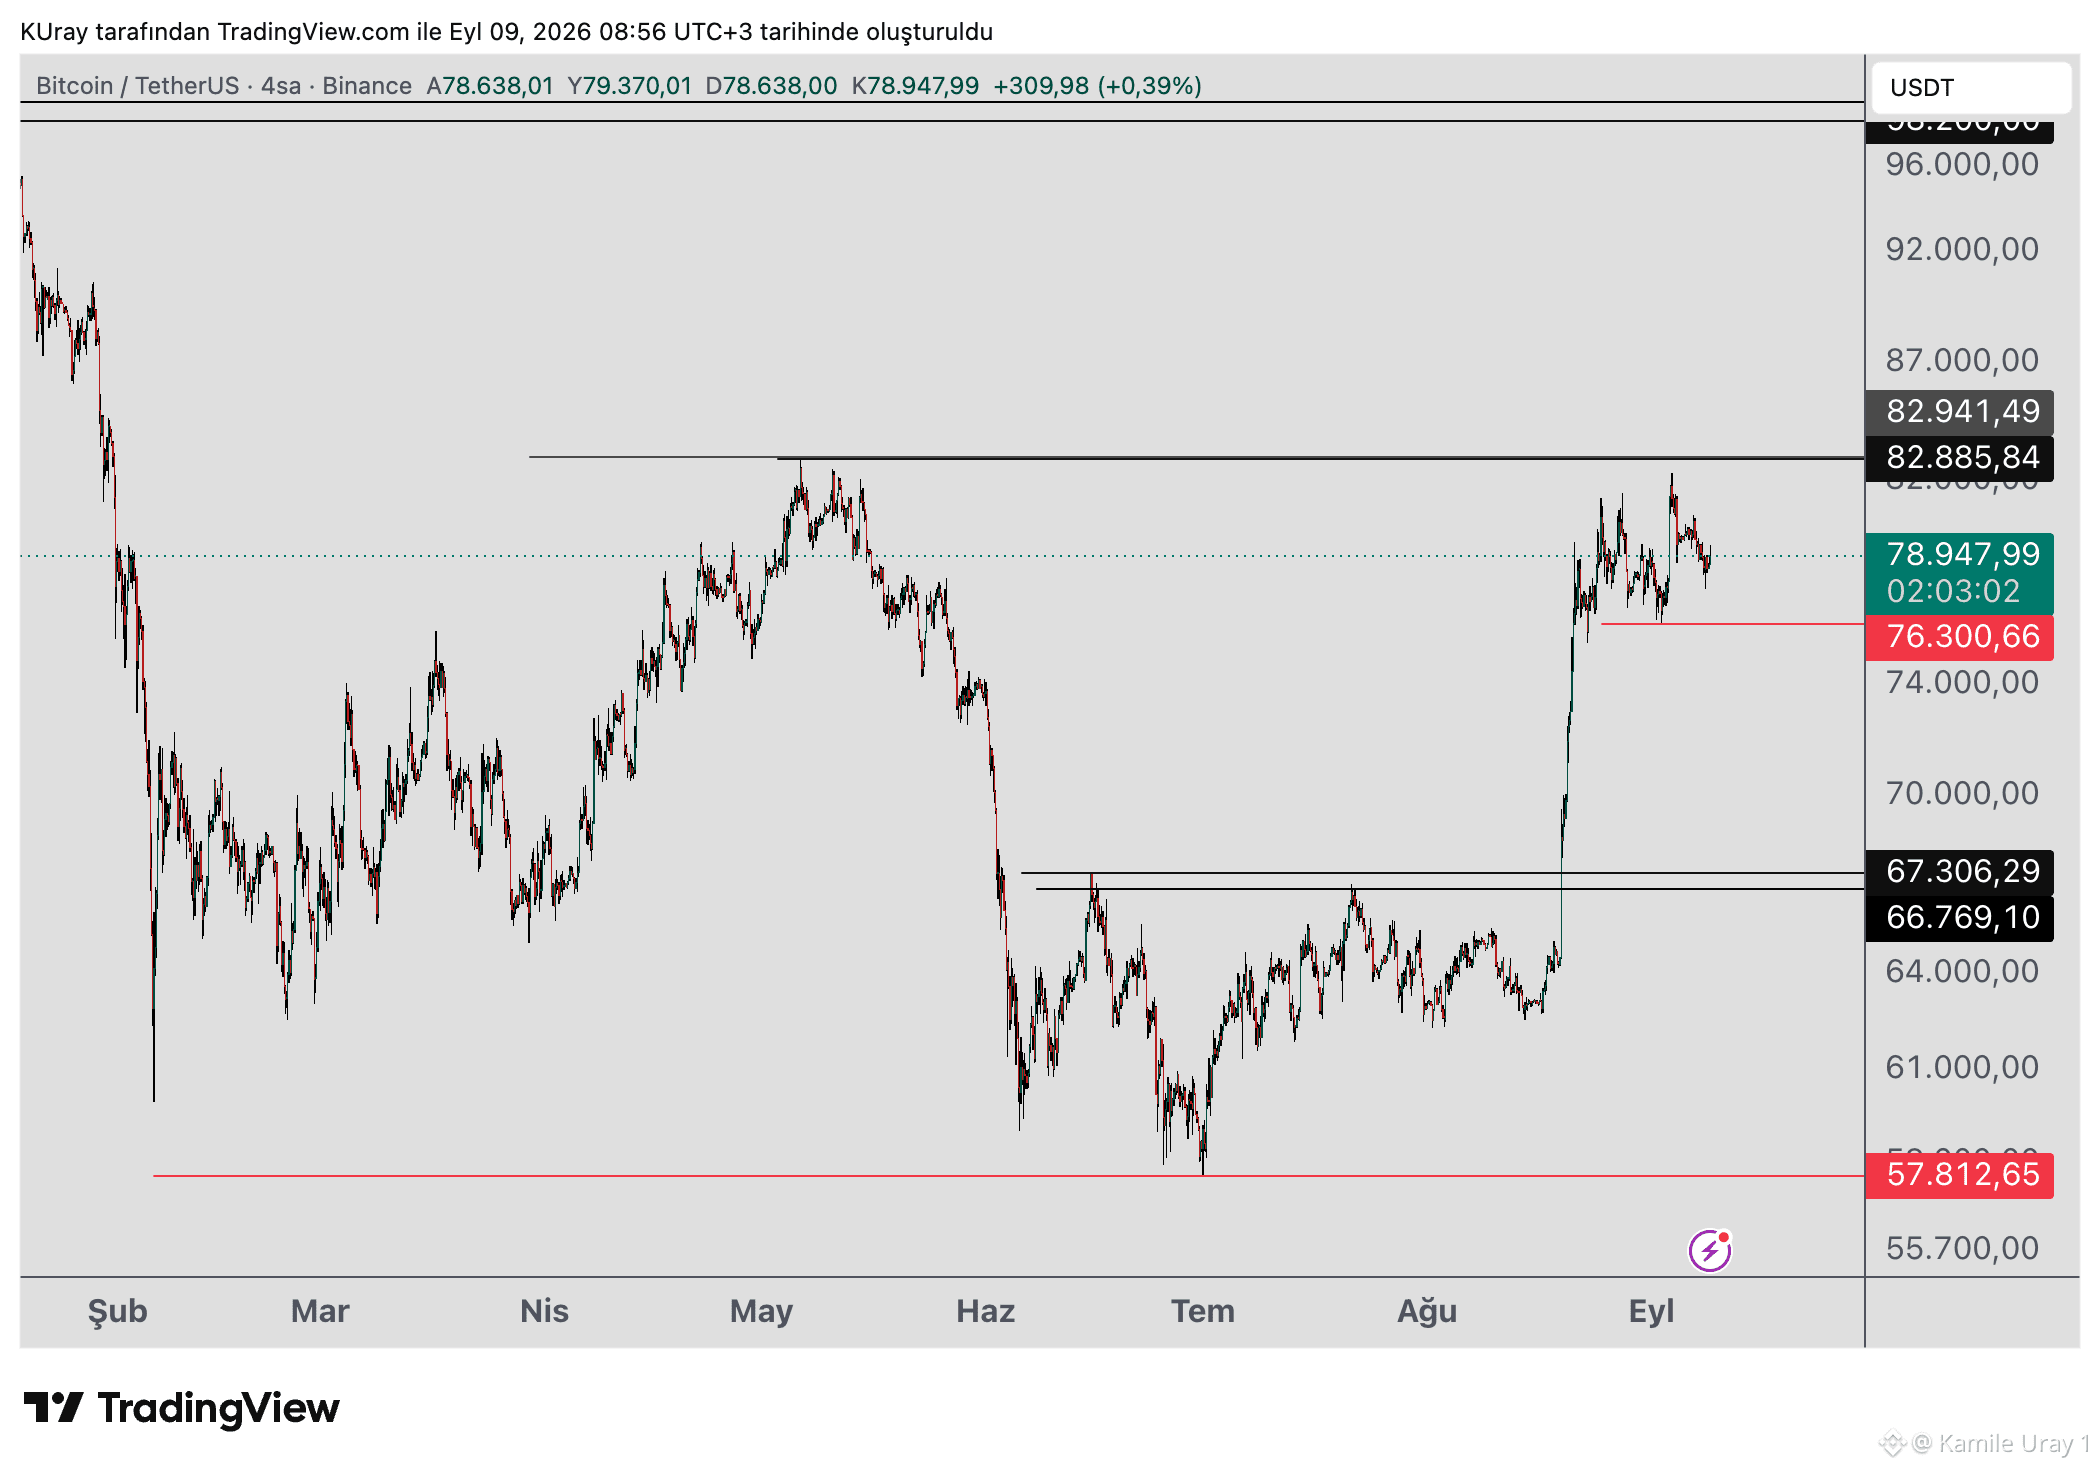
#BTC The potential for an upward move remains as long as it stays above the 76,300 level. If a daily or weekly close occurs above 82,885, it would mark the first higher peak relative to the most recent downward wave. This would provide a further signal that the uptrend is likely to continue, after which higher resistance levels can be monitored. If the price closes below 76,300, there is a possibility of testing the support zone around 67,000–66,000. Such a decline could form the final shoulder of a potential inverse head-and-shoulders (H&S) pattern. If it holds above 83,000, the pattern would become active, and the price would be expected to continue rising toward higher resistance levels.
#BTC The potential for an upward move remains as long as it stays above the 76,300 level. If a daily or weekly close occurs above 82,885, it would mark the first higher peak relative to the most recent downward wave. This would provide a further signal that the uptrend is likely to continue, after which higher resistance levels can be monitored. If the price closes below 76,300, there is a possibility of testing the support zone around 67,000–66,000. Such a decline could form the final shoulder of a potential inverse head-and-shoulders (H&S) pattern. If it holds above 83,000, the pattern would become active, and the price would be expected to continue rising toward higher resistance levels.
58
Tərcüməyə bax
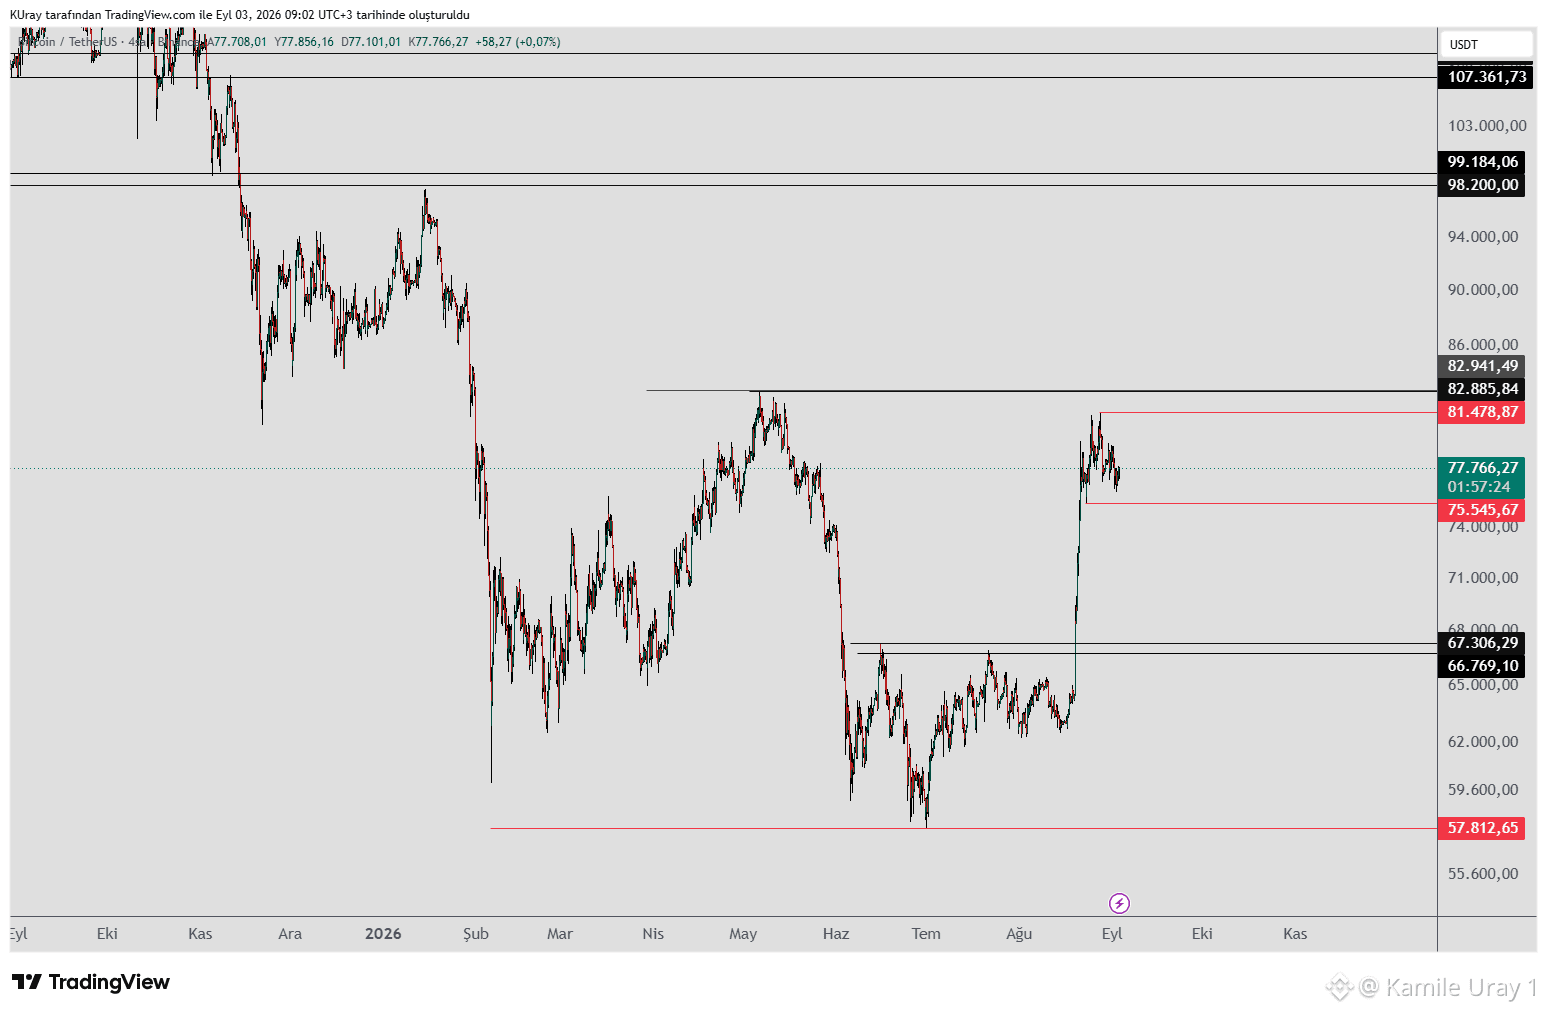
#BTC has been moving within the 81,478–75,545 range—a $6,000 spread—for the past eight days.
If the price closes below 75,545, there is a possibility of testing the support zone around 67,000–66,000. Such a decline could form the final shoulder of a potential Inverse Head and Shoulders (IH&S) pattern. Although a drop is anticipated, the potential for a larger bullish IH&S pattern is emerging; if the price holds above 83,000, the pattern would activate, and a continued rise toward upper resistance levels would be expected.
If daily and weekly closes occur above 82,885, it would mark the first higher high relative to the most recent downward wave, providing another positive signal that the upward trend is likely to continue.
#BTC has been moving within the 81,478–75,545 range—a $6,000 spread—for the past eight days.
If the price closes below 75,545, there is a possibility of testing the support zone around 67,000–66,000. Such a decline could form the final shoulder of a potential Inverse Head and Shoulders (IH&S) pattern. Although a drop is anticipated, the potential for a larger bullish IH&S pattern is emerging; if the price holds above 83,000, the pattern would activate, and a continued rise toward upper resistance levels would be expected.
If daily and weekly closes occur above 82,885, it would mark the first higher high relative to the most recent downward wave, providing another positive signal that the upward trend is likely to continue.
If the price closes below 75,545, there is a possibility of testing the support zone around 67,000–66,000. Such a decline could form the final shoulder of a potential Inverse Head and Shoulders (IH&S) pattern. Although a drop is anticipated, the potential for a larger bullish IH&S pattern is emerging; if the price holds above 83,000, the pattern would activate, and a continued rise toward upper resistance levels would be expected.
If daily and weekly closes occur above 82,885, it would mark the first higher high relative to the most recent downward wave, providing another positive signal that the upward trend is likely to continue.
72
Tərcüməyə bax
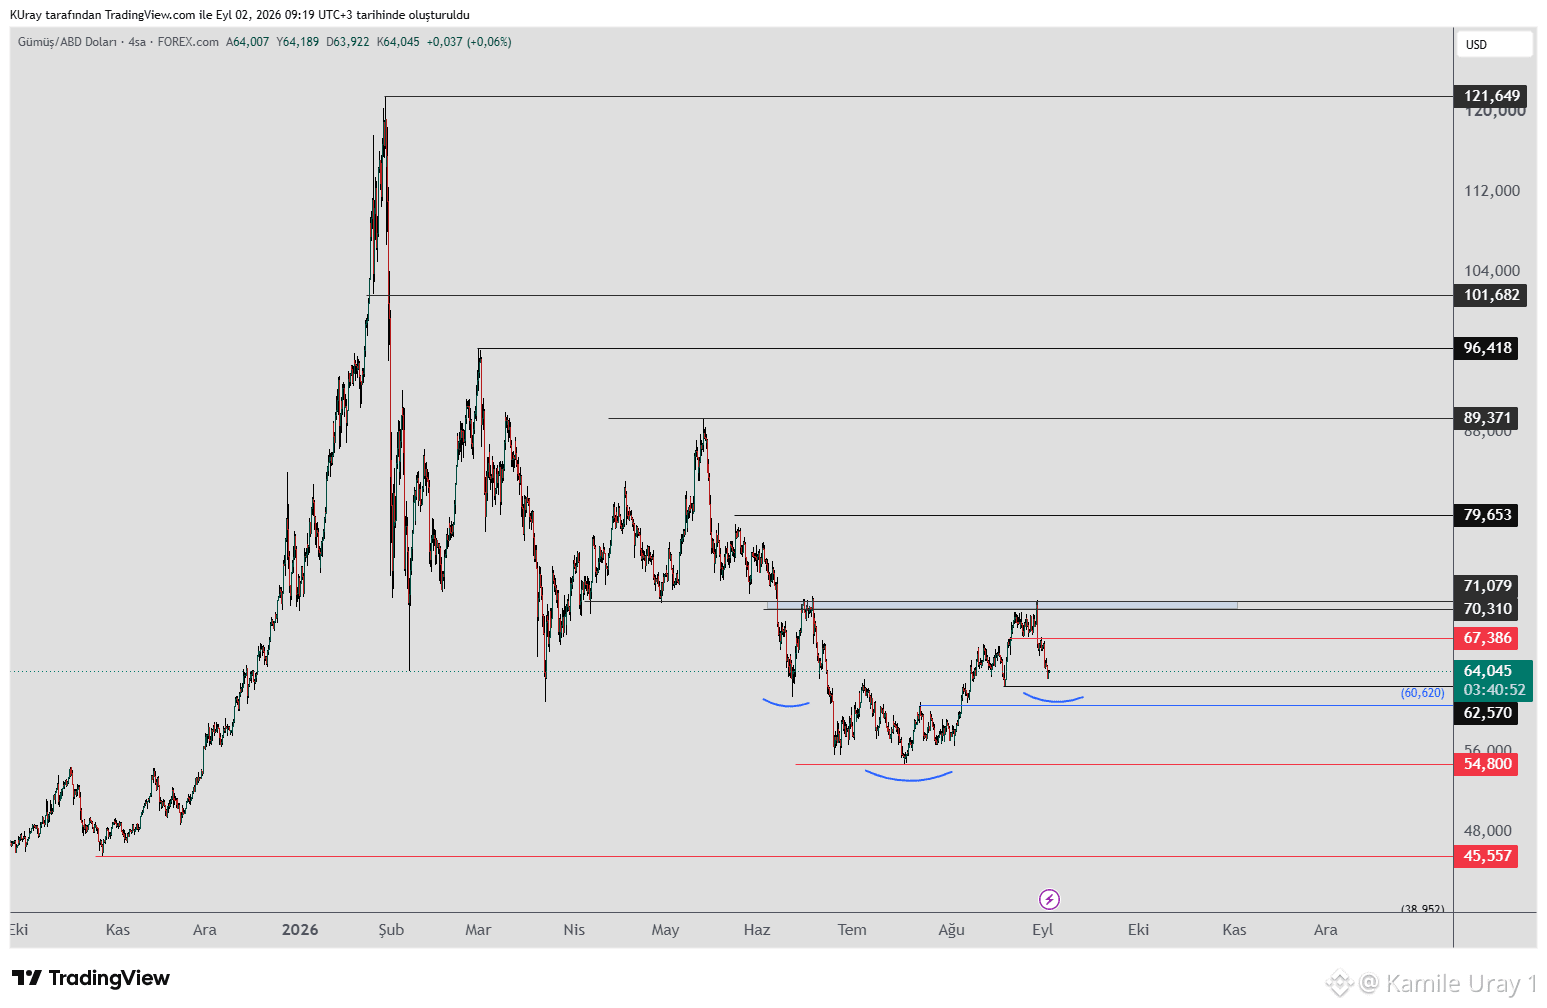
For #XAG (Silver), we will be monitoring the resistance at the "blue box" on the daily chart. Specifically, if the price breaks above the blue box located in the 70–71 range and closes there, further upward movement is expected; we can then look toward the 79 and 89 resistance levels.
The potential for an upward move remains as long as the price stays above the 62 level. If it drops below 62, we will monitor lower support levels. A renewed rise is expected if the price finds support during declines.
Looking at the price waves, the downward movements continue to appear as corrections to the overall uptrend.
For #XAG (Silver), we will be monitoring the resistance at the "blue box" on the daily chart. Specifically, if the price breaks above the blue box located in the 70–71 range and closes there, further upward movement is expected; we can then look toward the 79 and 89 resistance levels.
The potential for an upward move remains as long as the price stays above the 62 level. If it drops below 62, we will monitor lower support levels. A renewed rise is expected if the price finds support during declines.
Looking at the price waves, the downward movements continue to appear as corrections to the overall uptrend.
The potential for an upward move remains as long as the price stays above the 62 level. If it drops below 62, we will monitor lower support levels. A renewed rise is expected if the price finds support during declines.
Looking at the price waves, the downward movements continue to appear as corrections to the overall uptrend.
61
Tərcüməyə bax
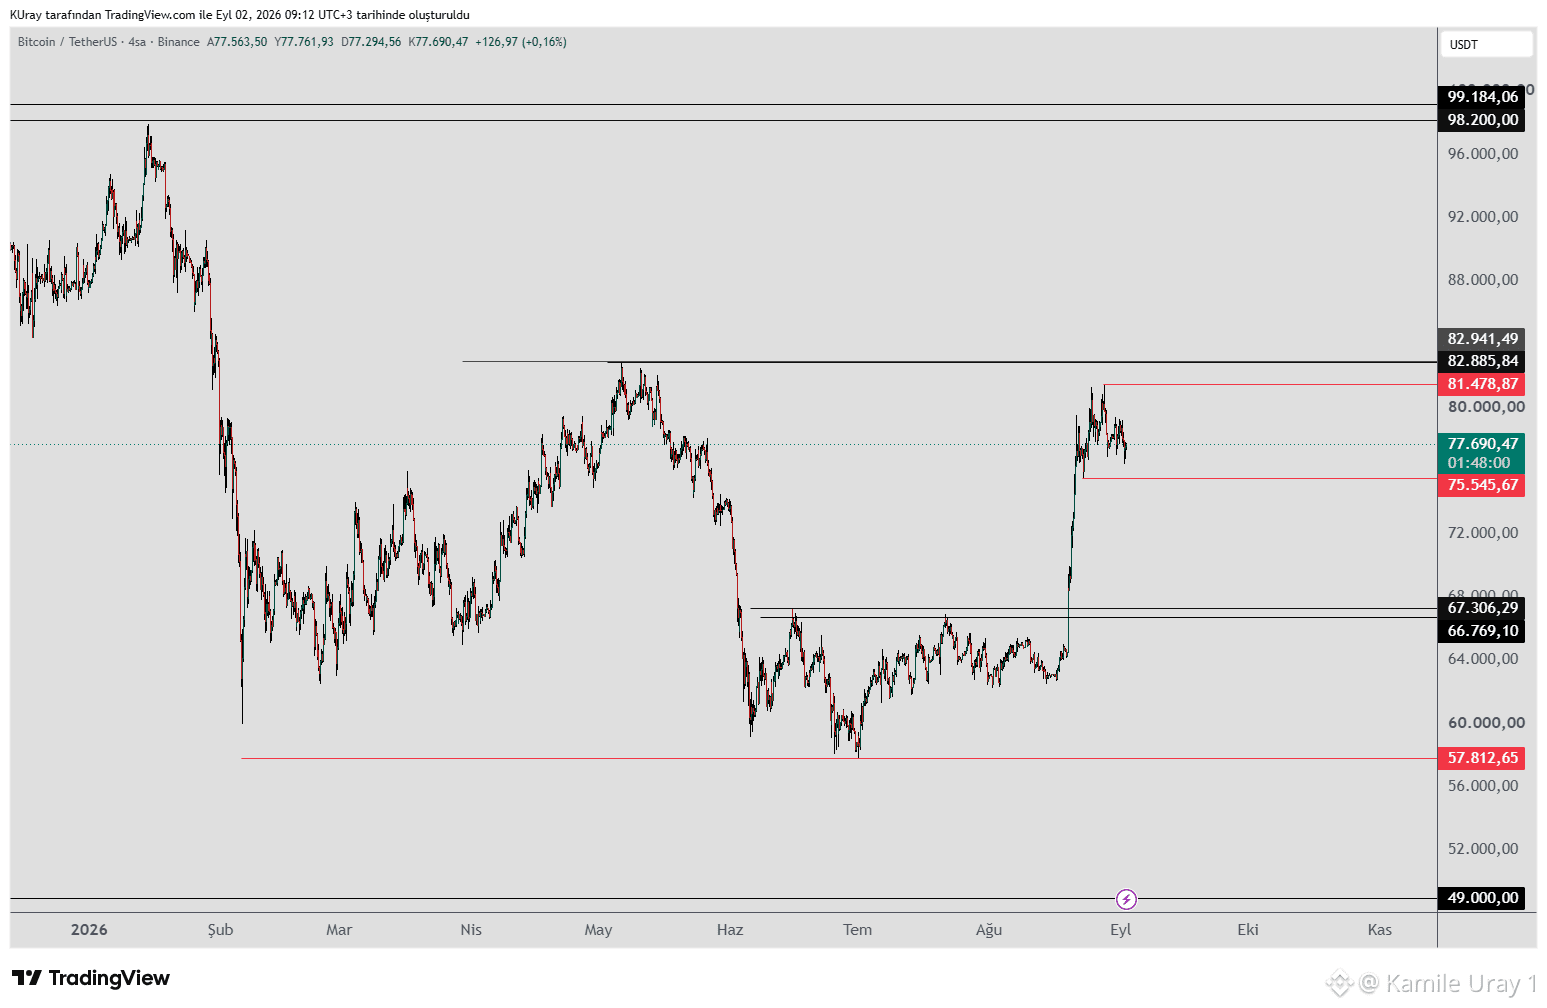
#BTC remains unchanged, trading within the 81,478–75,545 range. The current structure reinforces the likelihood of a continued decline; notably, the rebound following the last downward wave failed to close above the previous peak.
If the price closes below 75,545, it may test the support zone around 67,000–66,000.
These declines could potentially form the final shoulder of an Inverse Head and Shoulders (H&S) pattern.
Although a decline is anticipated, the possibility of a larger bullish Inverse H&S pattern is emerging.
If the price holds above 83,000, the pattern would activate, and a continued rise toward upper resistance levels would be expected.
A daily or weekly close above 82,885 would mark the first higher peak relative to the recent downward wave, serving as a positive signal that the upward trend is likely to continue.
#BTC remains unchanged, trading within the 81,478–75,545 range. The current structure reinforces the likelihood of a continued decline; notably, the rebound following the last downward wave failed to close above the previous peak.
If the price closes below 75,545, it may test the support zone around 67,000–66,000.
These declines could potentially form the final shoulder of an Inverse Head and Shoulders (H&S) pattern.
Although a decline is anticipated, the possibility of a larger bullish Inverse H&S pattern is emerging.
If the price holds above 83,000, the pattern would activate, and a continued rise toward upper resistance levels would be expected.
A daily or weekly close above 82,885 would mark the first higher peak relative to the recent downward wave, serving as a positive signal that the upward trend is likely to continue.
If the price closes below 75,545, it may test the support zone around 67,000–66,000.
These declines could potentially form the final shoulder of an Inverse Head and Shoulders (H&S) pattern.
Although a decline is anticipated, the possibility of a larger bullish Inverse H&S pattern is emerging.
If the price holds above 83,000, the pattern would activate, and a continued rise toward upper resistance levels would be expected.
A daily or weekly close above 82,885 would mark the first higher peak relative to the recent downward wave, serving as a positive signal that the upward trend is likely to continue.
71
Tərcüməyə bax
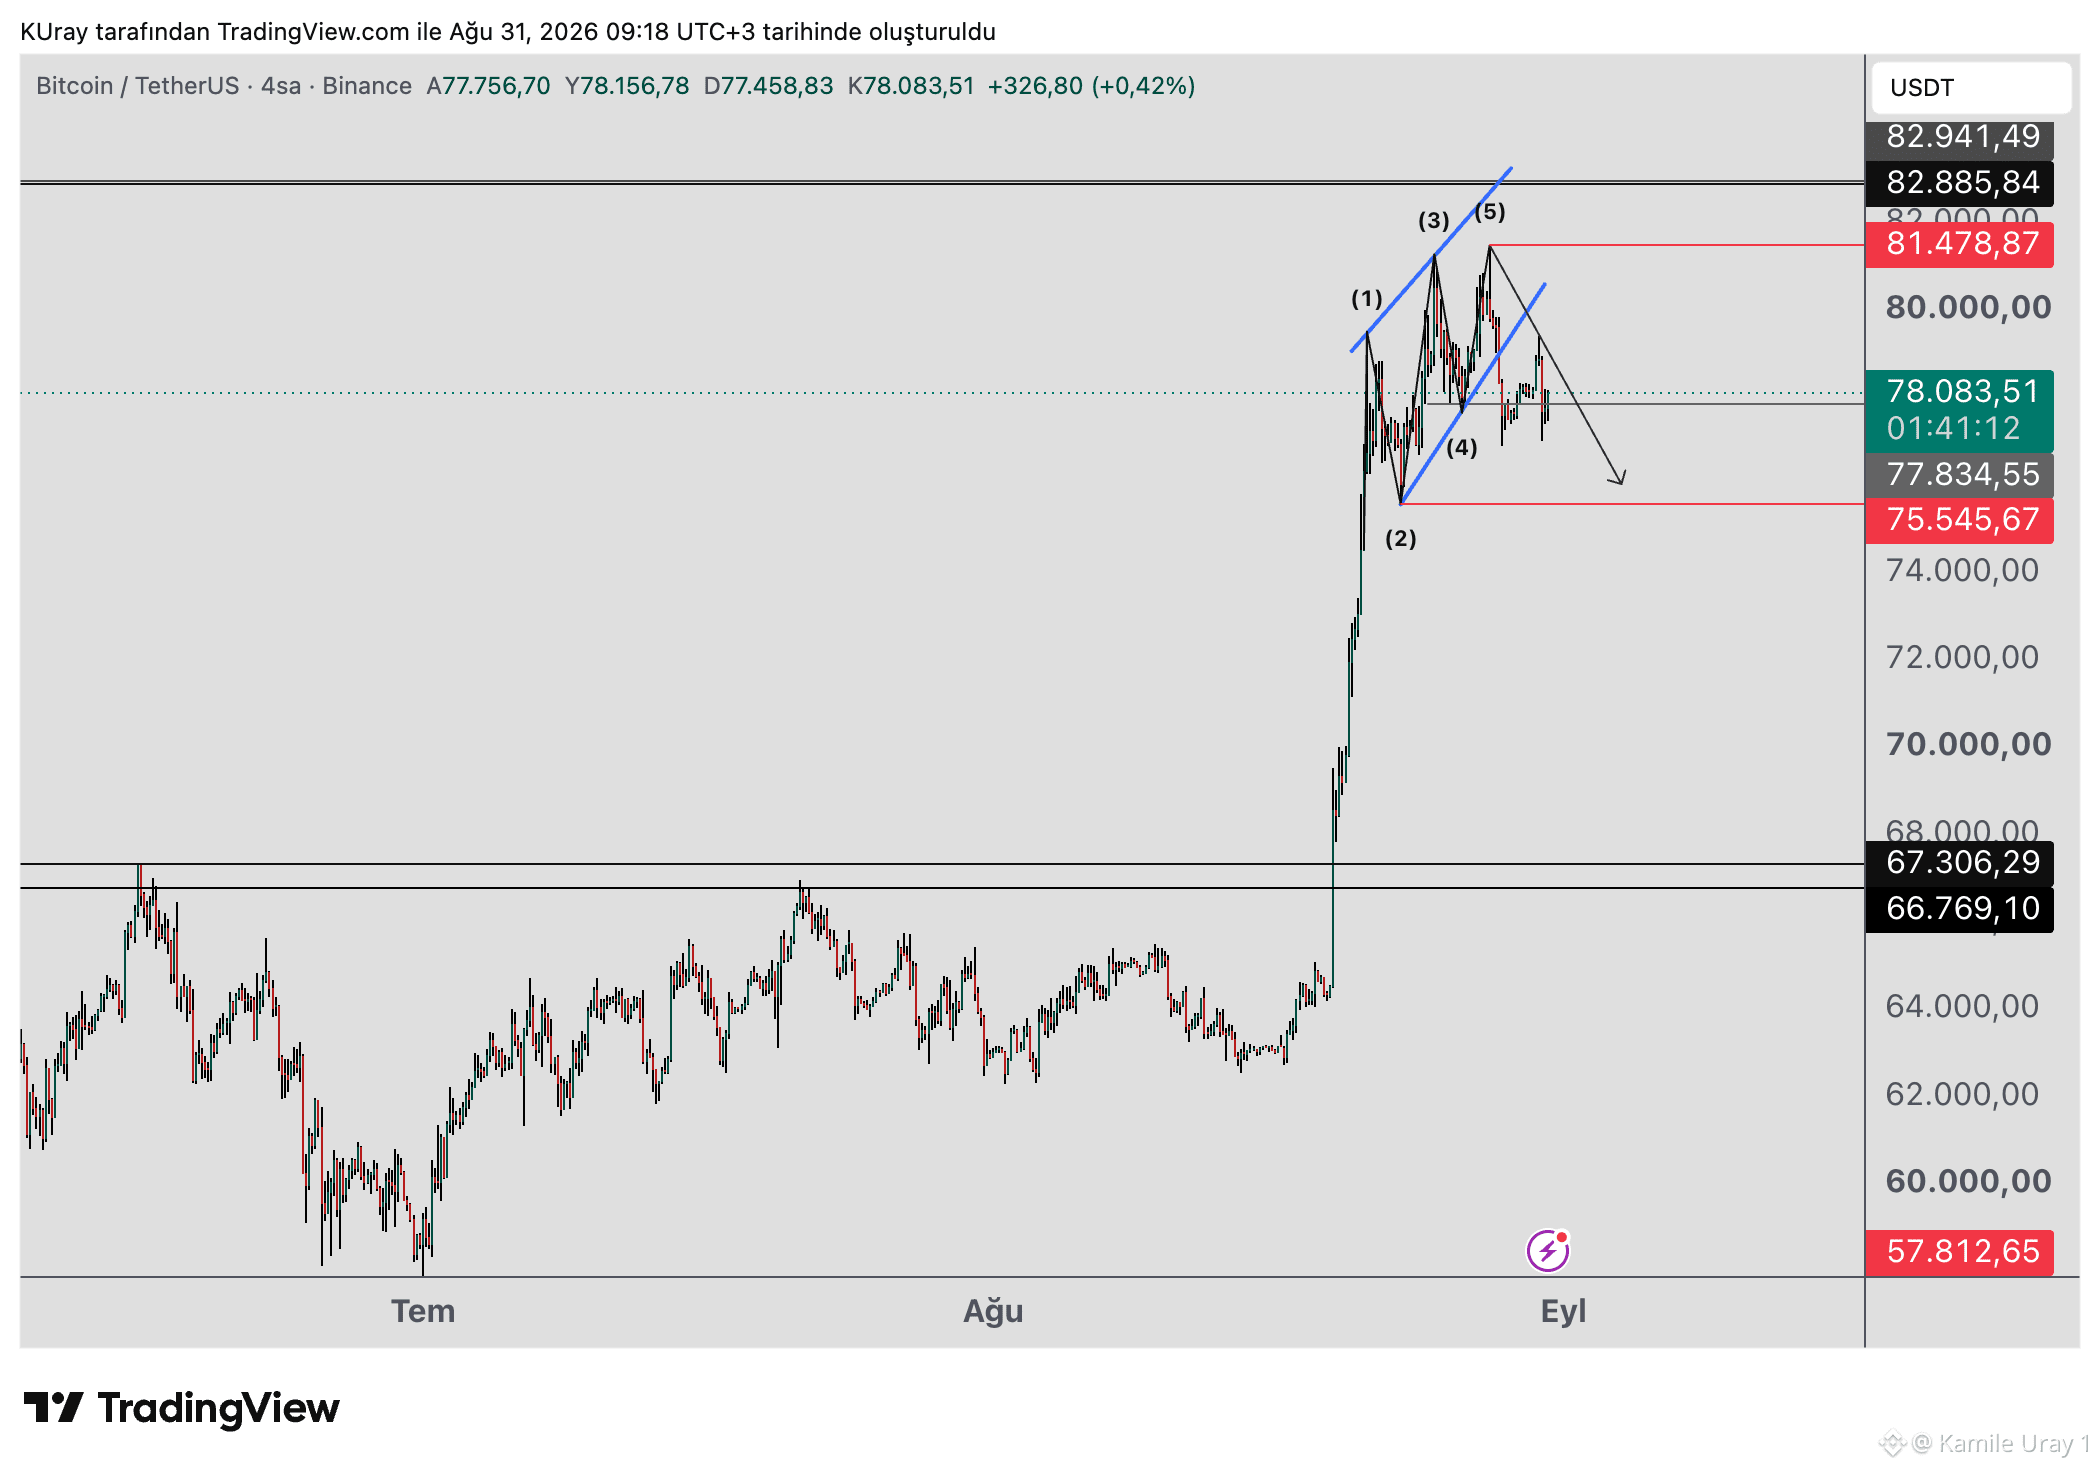
#BTC dropped before it could complete the Wolfe Wave pattern; the wedge structure played out instead. Sell pressure had built up at the peaks marked '3' and '5' within the wedge. Candlesticks with long upper wicks formed at the highs—a key indicator that this structure was likely to trigger a move. Additionally, an RSI divergence during the rise provided a secondary bearish signal, confirming the wedge's validity. We will now monitor the 81,478 peak; failure to close a 4-hour candle above this level implies the decline will continue. The 75,545 level serves as the first support during the drop; if the price holds below this, the decline could extend further, potentially testing the support zone around 67,000–66,000. This decline likely forms the final shoulder of an Inverse Head and Shoulders (IH&S) pattern; if the price holds above 83,000, the pattern activates, and a continued rise toward upper resistance levels would be expected. If the price closes above 82,885 on both daily and weekly timeframes, it would mark the first higher high relative to the recent bearish wave, providing a positive signal that the upward trend is set to continue.
#BTC dropped before it could complete the Wolfe Wave pattern; the wedge structure played out instead. Sell pressure had built up at the peaks marked '3' and '5' within the wedge. Candlesticks with long upper wicks formed at the highs—a key indicator that this structure was likely to trigger a move. Additionally, an RSI divergence during the rise provided a secondary bearish signal, confirming the wedge's validity. We will now monitor the 81,478 peak; failure to close a 4-hour candle above this level implies the decline will continue. The 75,545 level serves as the first support during the drop; if the price holds below this, the decline could extend further, potentially testing the support zone around 67,000–66,000. This decline likely forms the final shoulder of an Inverse Head and Shoulders (IH&S) pattern; if the price holds above 83,000, the pattern activates, and a continued rise toward upper resistance levels would be expected. If the price closes above 82,885 on both daily and weekly timeframes, it would mark the first higher high relative to the recent bearish wave, providing a positive signal that the upward trend is set to continue.
53
Tərcüməyə bax
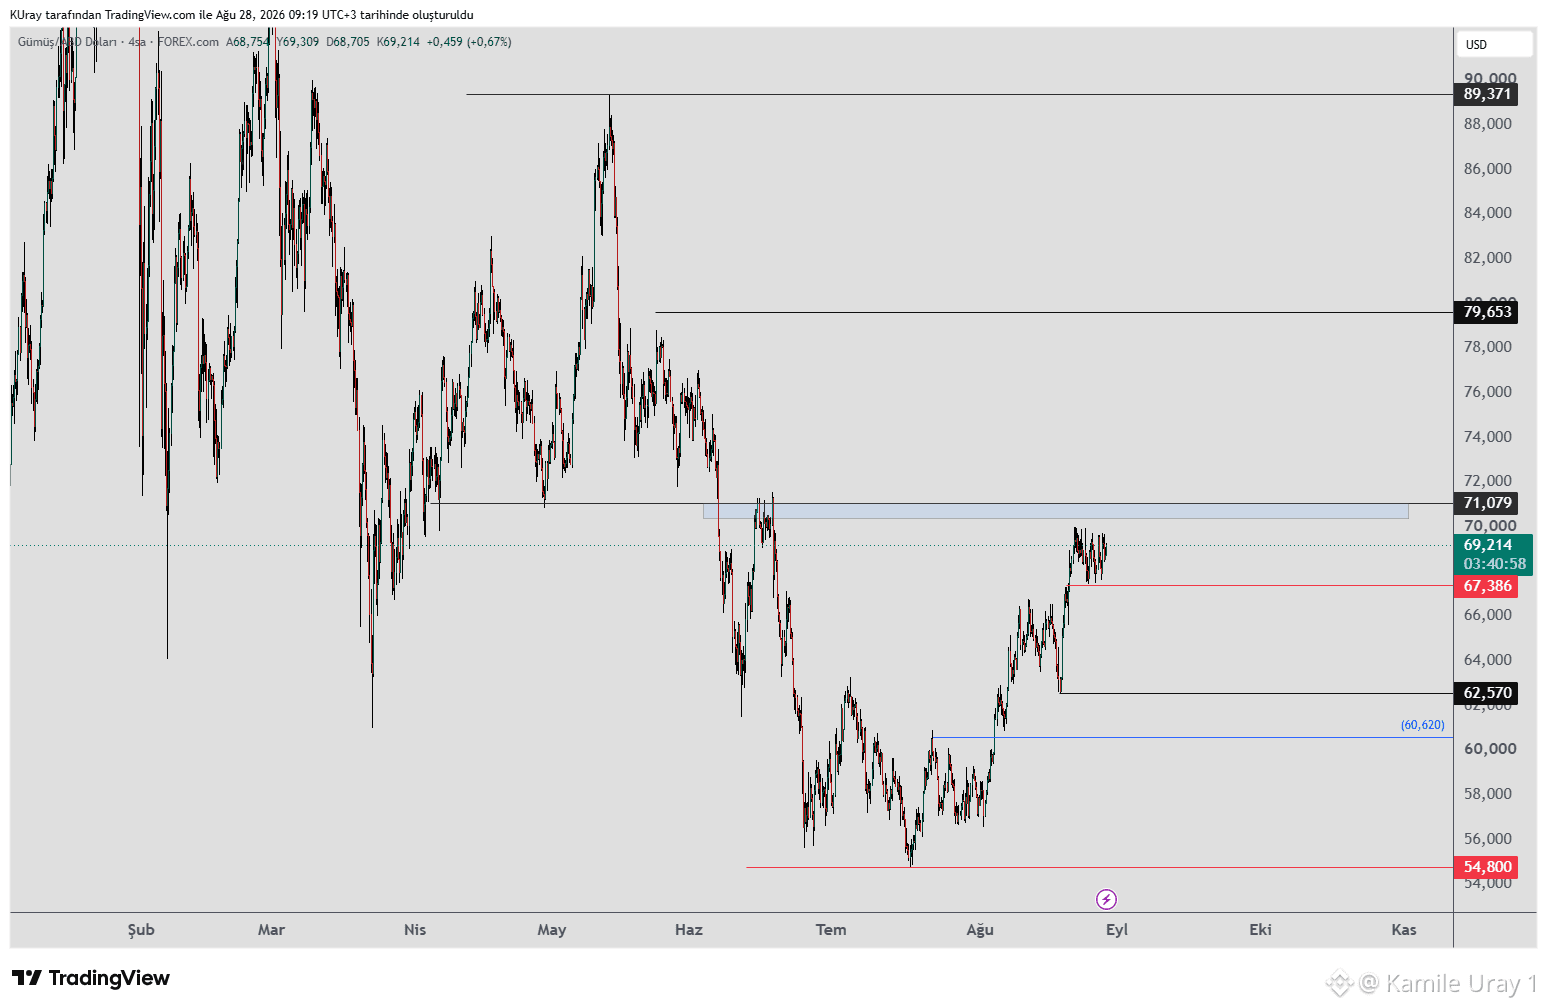
#xag #Silver is trading within a narrow range.
It is holding the 67 level but failing to close above 71; it is currently in a consolidation phase. Remaining above the 67 level keeps the possibility of an upward move alive.
If it sustains a position above the blue box at the 71 level, we will monitor the 79–89 resistance levels.
However, if it fails to break the blue box resistance and closes below 67, the decline could continue.
Regarding the downside, the potential for an upward move remains as long as the price holds above the 62 level on the 4-hour chart. If it drops below 62, we will look to lower support levels.
#xag #Silver is trading within a narrow range.
It is holding the 67 level but failing to close above 71; it is currently in a consolidation phase. Remaining above the 67 level keeps the possibility of an upward move alive.
If it sustains a position above the blue box at the 71 level, we will monitor the 79–89 resistance levels.
However, if it fails to break the blue box resistance and closes below 67, the decline could continue.
Regarding the downside, the potential for an upward move remains as long as the price holds above the 62 level on the 4-hour chart. If it drops below 62, we will look to lower support levels.
It is holding the 67 level but failing to close above 71; it is currently in a consolidation phase. Remaining above the 67 level keeps the possibility of an upward move alive.
If it sustains a position above the blue box at the 71 level, we will monitor the 79–89 resistance levels.
However, if it fails to break the blue box resistance and closes below 67, the decline could continue.
Regarding the downside, the potential for an upward move remains as long as the price holds above the 62 level on the 4-hour chart. If it drops below 62, we will look to lower support levels.
62
Tərcüməyə bax
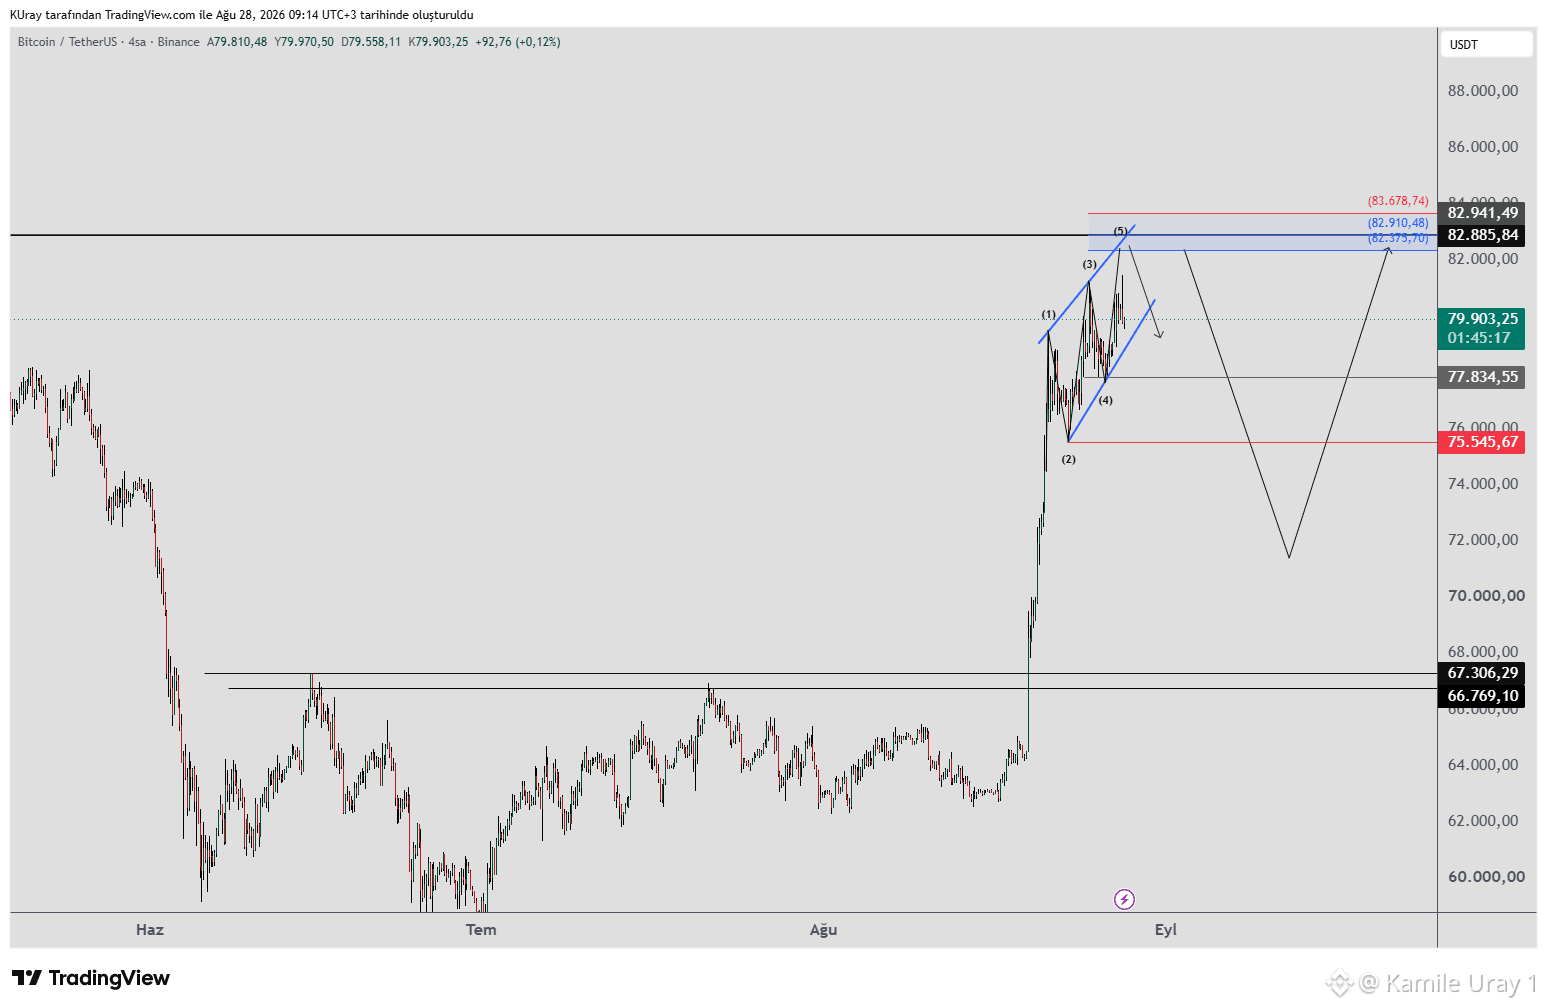
We are monitoring the potential for a Wolfe Wave pattern on #BTC . If the price rises to the 82,400–82,900 zone, a downward movement could begin from there.
The stop level for the pattern is a 4-hour candle close above 83,769; in that event, the pattern would be invalidated.
On the downside, the 75,545 level is the initial target. If the price drops below this, the decline could extend further. This drop would likely form the final shoulder of an inverse head-and-shoulders (H&S) structure; if the price then holds above 83,000, the pattern would activate, and a continued rise toward upper resistance levels would be expected.
If a daily or weekly close occurs above 82,885, it would mark the first higher peak relative to the most recent downward wave. This serves as a positive signal indicating that the upward trend is likely to continue.
We are monitoring the potential for a Wolfe Wave pattern on #BTC . If the price rises to the 82,400–82,900 zone, a downward movement could begin from there.
The stop level for the pattern is a 4-hour candle close above 83,769; in that event, the pattern would be invalidated.
On the downside, the 75,545 level is the initial target. If the price drops below this, the decline could extend further. This drop would likely form the final shoulder of an inverse head-and-shoulders (H&S) structure; if the price then holds above 83,000, the pattern would activate, and a continued rise toward upper resistance levels would be expected.
If a daily or weekly close occurs above 82,885, it would mark the first higher peak relative to the most recent downward wave. This serves as a positive signal indicating that the upward trend is likely to continue.
The stop level for the pattern is a 4-hour candle close above 83,769; in that event, the pattern would be invalidated.
On the downside, the 75,545 level is the initial target. If the price drops below this, the decline could extend further. This drop would likely form the final shoulder of an inverse head-and-shoulders (H&S) structure; if the price then holds above 83,000, the pattern would activate, and a continued rise toward upper resistance levels would be expected.
If a daily or weekly close occurs above 82,885, it would mark the first higher peak relative to the most recent downward wave. This serves as a positive signal indicating that the upward trend is likely to continue.
76
Tərcüməyə bax
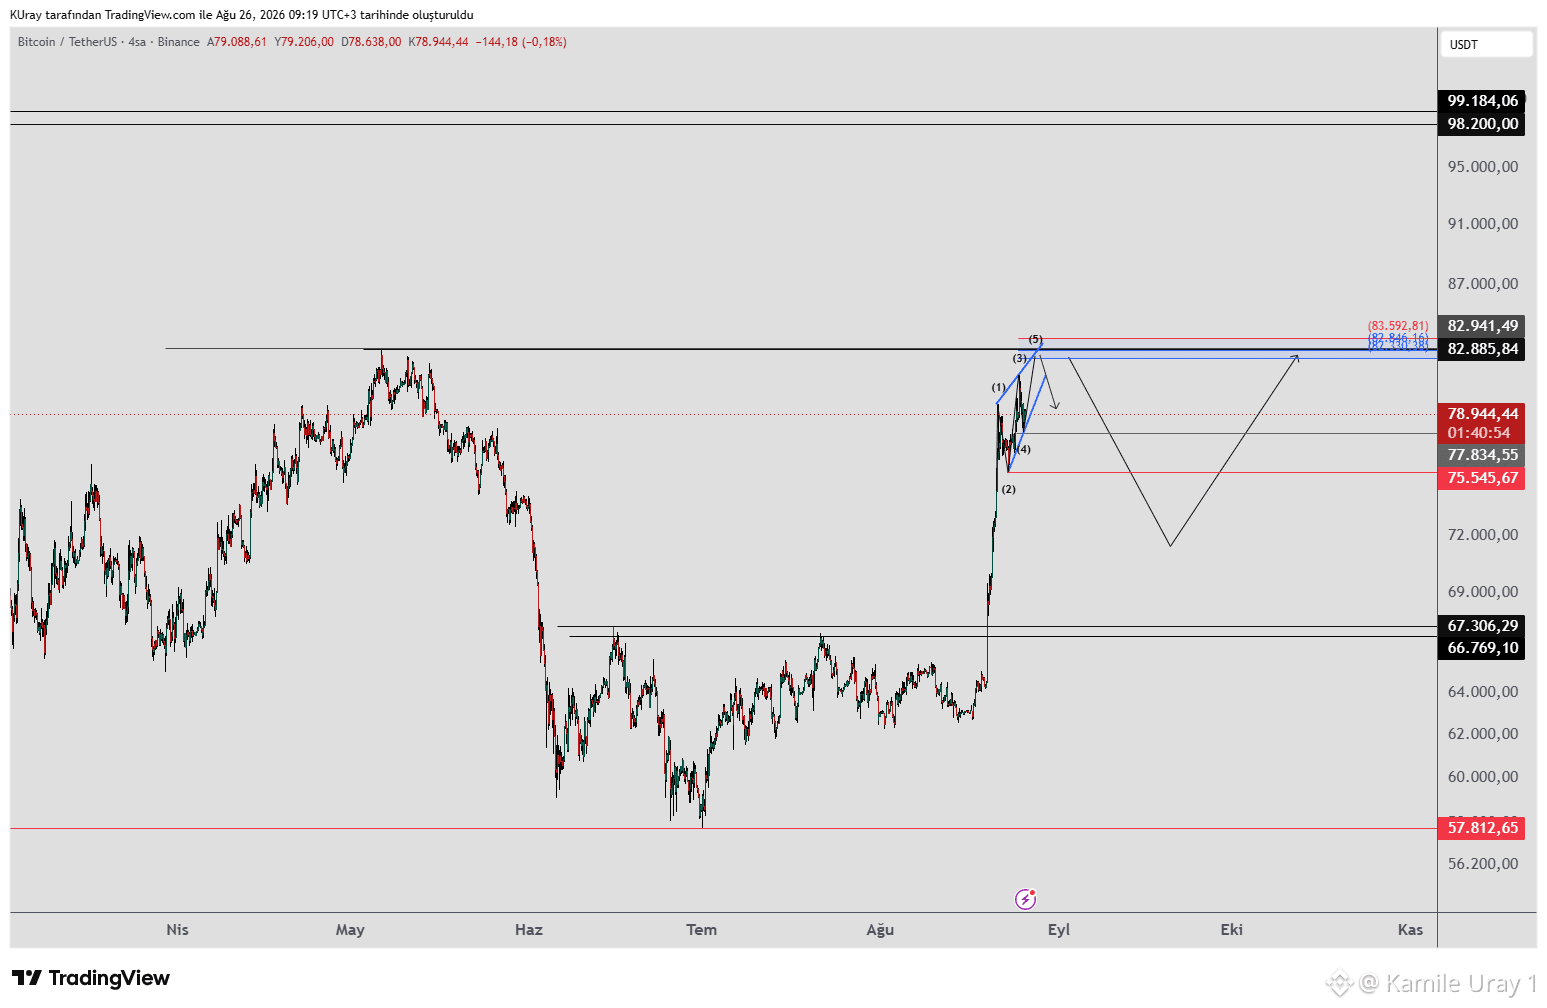
BTC continues to hold the 75,545 level on the 4-hour timeframe. However, the wave amplitudes have begun to shrink during the ascent, and a divergence has formed on the RSI. The upward movement has started to resemble a Wolfe Wave pattern. This pattern is structured as follows: If the price remains above the 77,834 low, there could be one more upward wave. The 82,330–82,846 zone acts as resistance during the rise; a downward movement could originate from here. The stop level for the pattern is a 4-hour candle close above 83,592. On the downside, the 75,545 level is the initial target; if the price drops below this, the decline could extend further. This decline would likely form the final shoulder of an Inverse Head and Shoulders (H&S) structure; if the price holds above 83,000, the pattern would activate, and a continued rise toward upper resistance levels would be expected. If a close above 82,885 occurs on the daily and weekly charts, it would mark the first higher high relative to the most recent downward wave. This serves as a positive signal that the upward trend is likely to continue.
BTC continues to hold the 75,545 level on the 4-hour timeframe. However, the wave amplitudes have begun to shrink during the ascent, and a divergence has formed on the RSI. The upward movement has started to resemble a Wolfe Wave pattern. This pattern is structured as follows: If the price remains above the 77,834 low, there could be one more upward wave. The 82,330–82,846 zone acts as resistance during the rise; a downward movement could originate from here. The stop level for the pattern is a 4-hour candle close above 83,592. On the downside, the 75,545 level is the initial target; if the price drops below this, the decline could extend further. This decline would likely form the final shoulder of an Inverse Head and Shoulders (H&S) structure; if the price holds above 83,000, the pattern would activate, and a continued rise toward upper resistance levels would be expected. If a close above 82,885 occurs on the daily and weekly charts, it would mark the first higher high relative to the most recent downward wave. This serves as a positive signal that the upward trend is likely to continue.
77
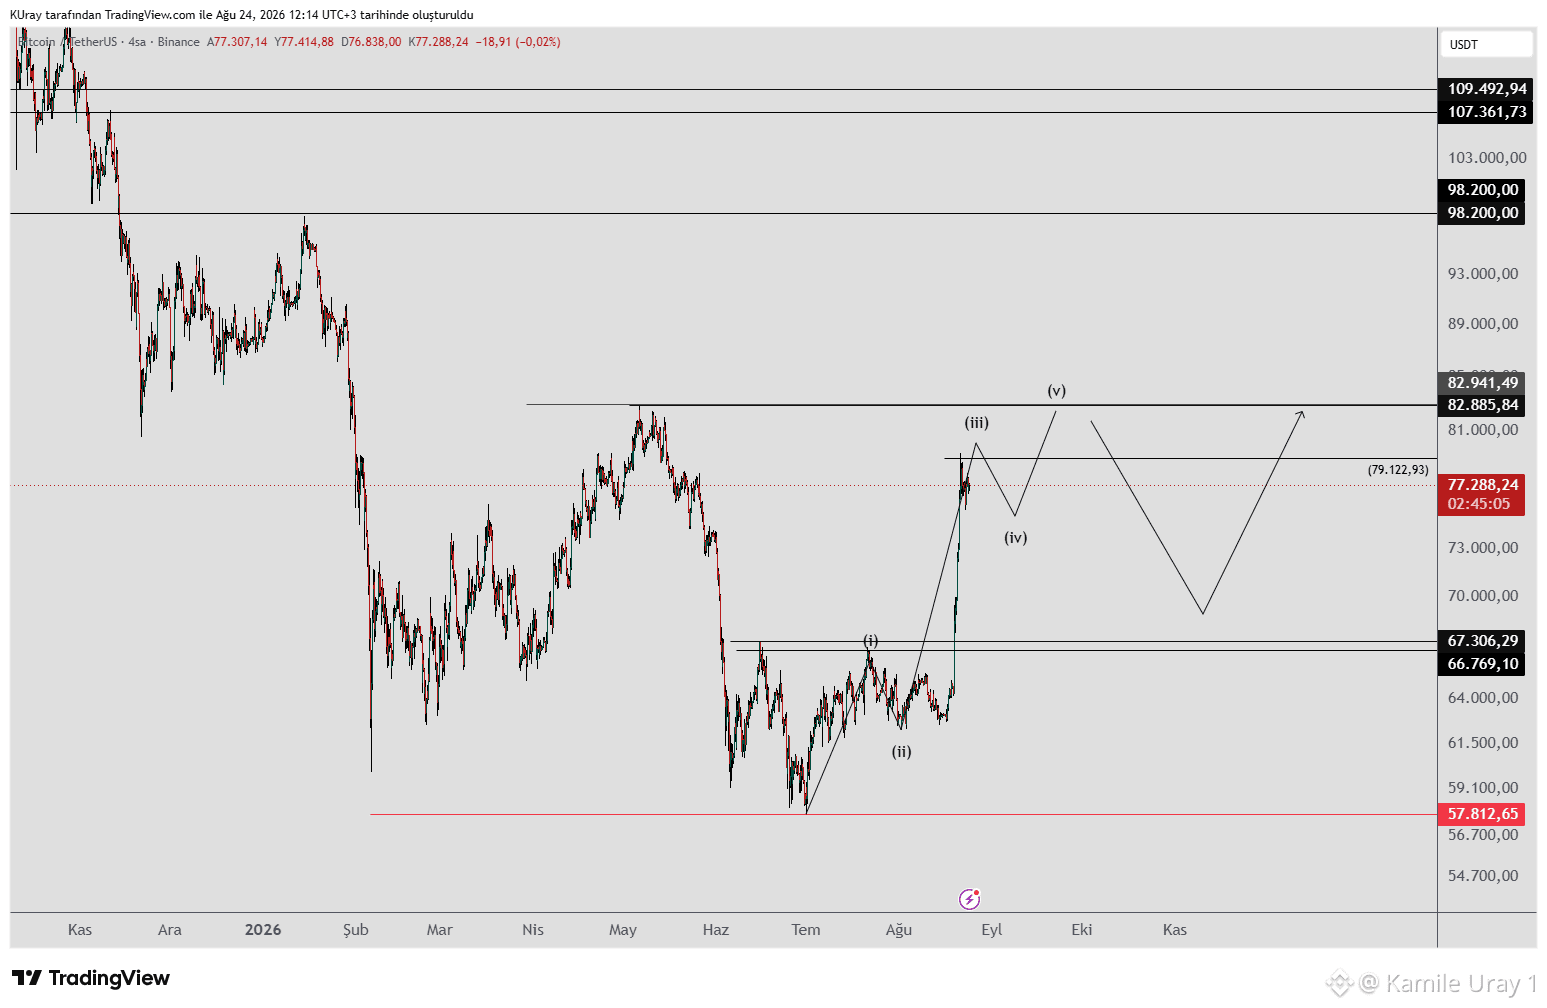
#BTC 62,275 səviyyəsindən yuxarı qaldığı müddətdə boğa baxışını qoruduq; mən 67,000-də tərs baş-çiyinlər (H&S) modelinin formalaşmasını gözləmişdim. Model özünü doğrultdu və hədəfinə çatdı. Yeni bir qraf paylaşmasam da, əsas səviyyələri işarələmişdim və hərəkətin qraf vasitəsilə izlənə biləcəyinə inanırəm.
71,000–75,000 müqavimət səviyyələri də artıq aşılıb. 4 saatlıq struktura baxanda beşdalğalı bir hərəkət ehtimalı var. 3-cü dalğa başa çatmış kimi görünür və hazırda 4-cü dalğadayıq; burada qısa bir konsolidasiya sonrası başqa bir yüksəliş itələməsi baş verə bilər.
Bu, mitinq zamanı 82,885 müqavimət səviyyəsinin test edilmə ehtimalını artırır. Əgər qiymət həm gündəlik, həm də həftəlik vaxt çərçivələrində 82,885-dən yuxarı bağlanarsa, bu, ən son düşüş dalğası ilə müqayisədə ilk daha yüksək zirvəni göstərəcək—bu isə yüksəliş meylinin davam etməsinin ehtimalını artıran müsbət siqnaldır.
Qiymət mənim qeyd etdiyim dalğa modelinə uyğun hərəkət etsə, tərs H&S və ya fincan-bənd (cup-and-handle) kimi əlavə qazanclara uyğun bir struktur formalaşa bilər; bu da 82,885 səviyyəsi qırıldıqdan sonra qiymətin daha da yüksəlməsinə səbəb ola bilər.
Dalğa strukturunu izləməyə davam edəcəyik.
#BTC 62,275 səviyyəsindən yuxarı qaldığı müddətdə boğa baxışını qoruduq; mən 67,000-də tərs baş-çiyinlər (H&S) modelinin formalaşmasını gözləmişdim. Model özünü doğrultdu və hədəfinə çatdı. Yeni bir qraf paylaşmasam da, əsas səviyyələri işarələmişdim və hərəkətin qraf vasitəsilə izlənə biləcəyinə inanırəm.
71,000–75,000 müqavimət səviyyələri də artıq aşılıb. 4 saatlıq struktura baxanda beşdalğalı bir hərəkət ehtimalı var. 3-cü dalğa başa çatmış kimi görünür və hazırda 4-cü dalğadayıq; burada qısa bir konsolidasiya sonrası başqa bir yüksəliş itələməsi baş verə bilər.
Bu, mitinq zamanı 82,885 müqavimət səviyyəsinin test edilmə ehtimalını artırır. Əgər qiymət həm gündəlik, həm də həftəlik vaxt çərçivələrində 82,885-dən yuxarı bağlanarsa, bu, ən son düşüş dalğası ilə müqayisədə ilk daha yüksək zirvəni göstərəcək—bu isə yüksəliş meylinin davam etməsinin ehtimalını artıran müsbət siqnaldır.
Qiymət mənim qeyd etdiyim dalğa modelinə uyğun hərəkət etsə, tərs H&S və ya fincan-bənd (cup-and-handle) kimi əlavə qazanclara uyğun bir struktur formalaşa bilər; bu da 82,885 səviyyəsi qırıldıqdan sonra qiymətin daha da yüksəlməsinə səbəb ola bilər.
Dalğa strukturunu izləməyə davam edəcəyik.
71,000–75,000 müqavimət səviyyələri də artıq aşılıb. 4 saatlıq struktura baxanda beşdalğalı bir hərəkət ehtimalı var. 3-cü dalğa başa çatmış kimi görünür və hazırda 4-cü dalğadayıq; burada qısa bir konsolidasiya sonrası başqa bir yüksəliş itələməsi baş verə bilər.
Bu, mitinq zamanı 82,885 müqavimət səviyyəsinin test edilmə ehtimalını artırır. Əgər qiymət həm gündəlik, həm də həftəlik vaxt çərçivələrində 82,885-dən yuxarı bağlanarsa, bu, ən son düşüş dalğası ilə müqayisədə ilk daha yüksək zirvəni göstərəcək—bu isə yüksəliş meylinin davam etməsinin ehtimalını artıran müsbət siqnaldır.
Qiymət mənim qeyd etdiyim dalğa modelinə uyğun hərəkət etsə, tərs H&S və ya fincan-bənd (cup-and-handle) kimi əlavə qazanclara uyğun bir struktur formalaşa bilər; bu da 82,885 səviyyəsi qırıldıqdan sonra qiymətin daha da yüksəlməsinə səbəb ola bilər.
Dalğa strukturunu izləməyə davam edəcəyik.
75
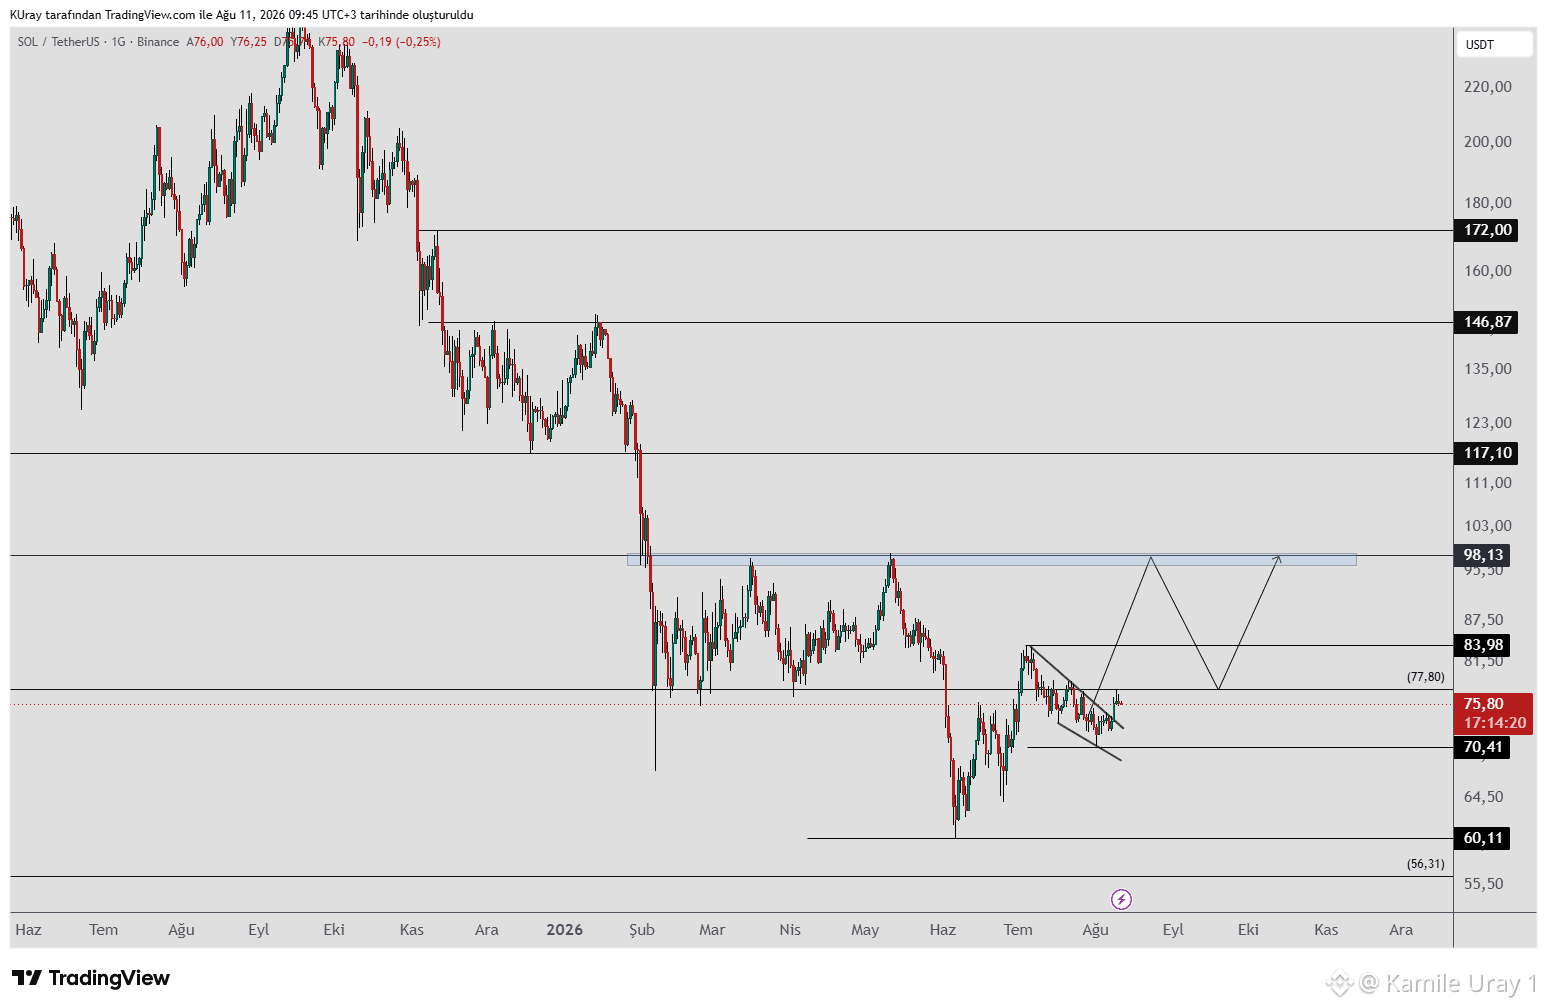
Sol tərəfdəki paz (wedge) strukturu dağılıb. 70 səviyyəsi (aşağı) qorunub saxlanarsa, yuxarıya doğru hərəkət üçün potensial var; 83 və 93 müqavimət səviyyələrinə nəzarət edilə bilər. Oxlarla göstərdiyim hərəkətlərə uyğun gedərsə, tərs baş-çiyinlər (H&S) patterni formalaşacaq; mavi qutu qırıldıqdan və qiymət onun üzərində mövqe tutduqdan sonra 117–146 müqavimət səviyyələrini sınaqdan keçirə bilər.
Sol tərəfdəki paz (wedge) strukturu dağılıb. 70 səviyyəsi (aşağı) qorunub saxlanarsa, yuxarıya doğru hərəkət üçün potensial var; 83 və 93 müqavimət səviyyələrinə nəzarət edilə bilər. Oxlarla göstərdiyim hərəkətlərə uyğun gedərsə, tərs baş-çiyinlər (H&S) patterni formalaşacaq; mavi qutu qırıldıqdan və qiymət onun üzərində mövqe tutduqdan sonra 117–146 müqavimət səviyyələrini sınaqdan keçirə bilər.
58
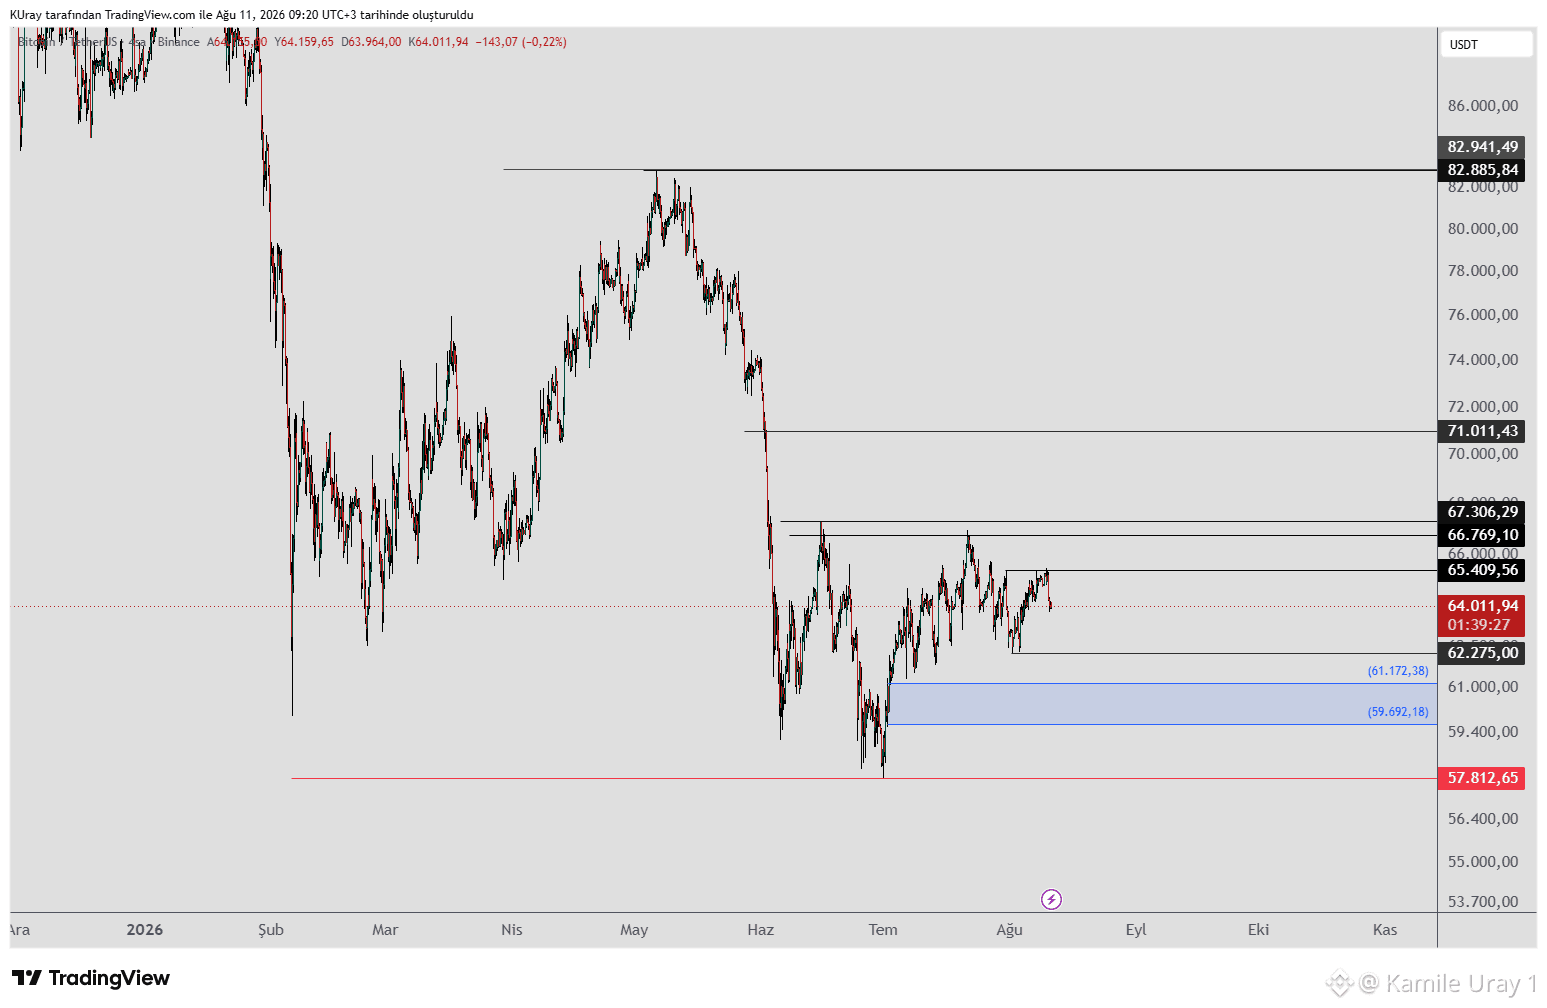
#BTC 62,275 səviyyəsindən yuxarıda qalan hissə bullish ssenarini canlı saxlayır. Əgər 65,409-dan yuxarı bağlanış olarsa, tərs baş-çiyinlər (H&S) modelinin "çiyin" hissəsi tamamlana bilər; 67,000-dən yuxarı bağlanış modeli aktivləşdirər və yüksəliş meylinin davamı gözlənilə bilər.
67,000-dən yuxarıda qalmaq 71,000, 75,000 və 82,885-də müqavimət səviyyələrinin sınaqdan keçirilməsi ehtimalını yaradır.
Əgər 82,885-dən yuxarı bağlanış həm gündəlik, həm də həftəlik zaman çərçivələrində baş versə, bu, ən son eniş dalğası ilə müqayisədə ilk daha yüksək zirvəni qeyd edər. Bu, yüksəliş meylinin davam etməsinin ehtimalını artıran müsbət siqnaldır.
4 saatlıq qrafikdə 65,409-dan yuxarı bağlana bilməmək enişə gətirib çıxara bilər; 62,275-dən aşağı bağlanış isə son yüksəlişi sadəcə eniş meylində korektiv bir sıçrayış kimi yenidən təsnif edər və enişin davamı gözlənilər.
Enış zamanı 59,000–61,000 aralığı dəstək zonası rolunu oynayır (0.618–0.786 Fibonacci səviyyələri ilə üst-üstə düşür). Bu, alıcıların daxil ola biləcəyi bir ərazidir; əgər qiymət burada dəstək tapsa, yüksəlişə doğru növbəti cəhdin ardı gəlməsi mümkündür.
Enış dərinləşərsə və həftəlik bağlanış 57,000-dən aşağı düşərsə, qiymət 49,000–50,000 aralığındakı dəstək səviyyələrini sınaqdan keçirə bilər.
#BTC 62,275 səviyyəsindən yuxarıda qalan hissə bullish ssenarini canlı saxlayır. Əgər 65,409-dan yuxarı bağlanış olarsa, tərs baş-çiyinlər (H&S) modelinin "çiyin" hissəsi tamamlana bilər; 67,000-dən yuxarı bağlanış modeli aktivləşdirər və yüksəliş meylinin davamı gözlənilə bilər.
67,000-dən yuxarıda qalmaq 71,000, 75,000 və 82,885-də müqavimət səviyyələrinin sınaqdan keçirilməsi ehtimalını yaradır.
Əgər 82,885-dən yuxarı bağlanış həm gündəlik, həm də həftəlik zaman çərçivələrində baş versə, bu, ən son eniş dalğası ilə müqayisədə ilk daha yüksək zirvəni qeyd edər. Bu, yüksəliş meylinin davam etməsinin ehtimalını artıran müsbət siqnaldır.
4 saatlıq qrafikdə 65,409-dan yuxarı bağlana bilməmək enişə gətirib çıxara bilər; 62,275-dən aşağı bağlanış isə son yüksəlişi sadəcə eniş meylində korektiv bir sıçrayış kimi yenidən təsnif edər və enişin davamı gözlənilər.
Enış zamanı 59,000–61,000 aralığı dəstək zonası rolunu oynayır (0.618–0.786 Fibonacci səviyyələri ilə üst-üstə düşür). Bu, alıcıların daxil ola biləcəyi bir ərazidir; əgər qiymət burada dəstək tapsa, yüksəlişə doğru növbəti cəhdin ardı gəlməsi mümkündür.
Enış dərinləşərsə və həftəlik bağlanış 57,000-dən aşağı düşərsə, qiymət 49,000–50,000 aralığındakı dəstək səviyyələrini sınaqdan keçirə bilər.
67,000-dən yuxarıda qalmaq 71,000, 75,000 və 82,885-də müqavimət səviyyələrinin sınaqdan keçirilməsi ehtimalını yaradır.
Əgər 82,885-dən yuxarı bağlanış həm gündəlik, həm də həftəlik zaman çərçivələrində baş versə, bu, ən son eniş dalğası ilə müqayisədə ilk daha yüksək zirvəni qeyd edər. Bu, yüksəliş meylinin davam etməsinin ehtimalını artıran müsbət siqnaldır.
4 saatlıq qrafikdə 65,409-dan yuxarı bağlana bilməmək enişə gətirib çıxara bilər; 62,275-dən aşağı bağlanış isə son yüksəlişi sadəcə eniş meylində korektiv bir sıçrayış kimi yenidən təsnif edər və enişin davamı gözlənilər.
Enış zamanı 59,000–61,000 aralığı dəstək zonası rolunu oynayır (0.618–0.786 Fibonacci səviyyələri ilə üst-üstə düşür). Bu, alıcıların daxil ola biləcəyi bir ərazidir; əgər qiymət burada dəstək tapsa, yüksəlişə doğru növbəti cəhdin ardı gəlməsi mümkündür.
Enış dərinləşərsə və həftəlik bağlanış 57,000-dən aşağı düşərsə, qiymət 49,000–50,000 aralığındakı dəstək səviyyələrini sınaqdan keçirə bilər.
77
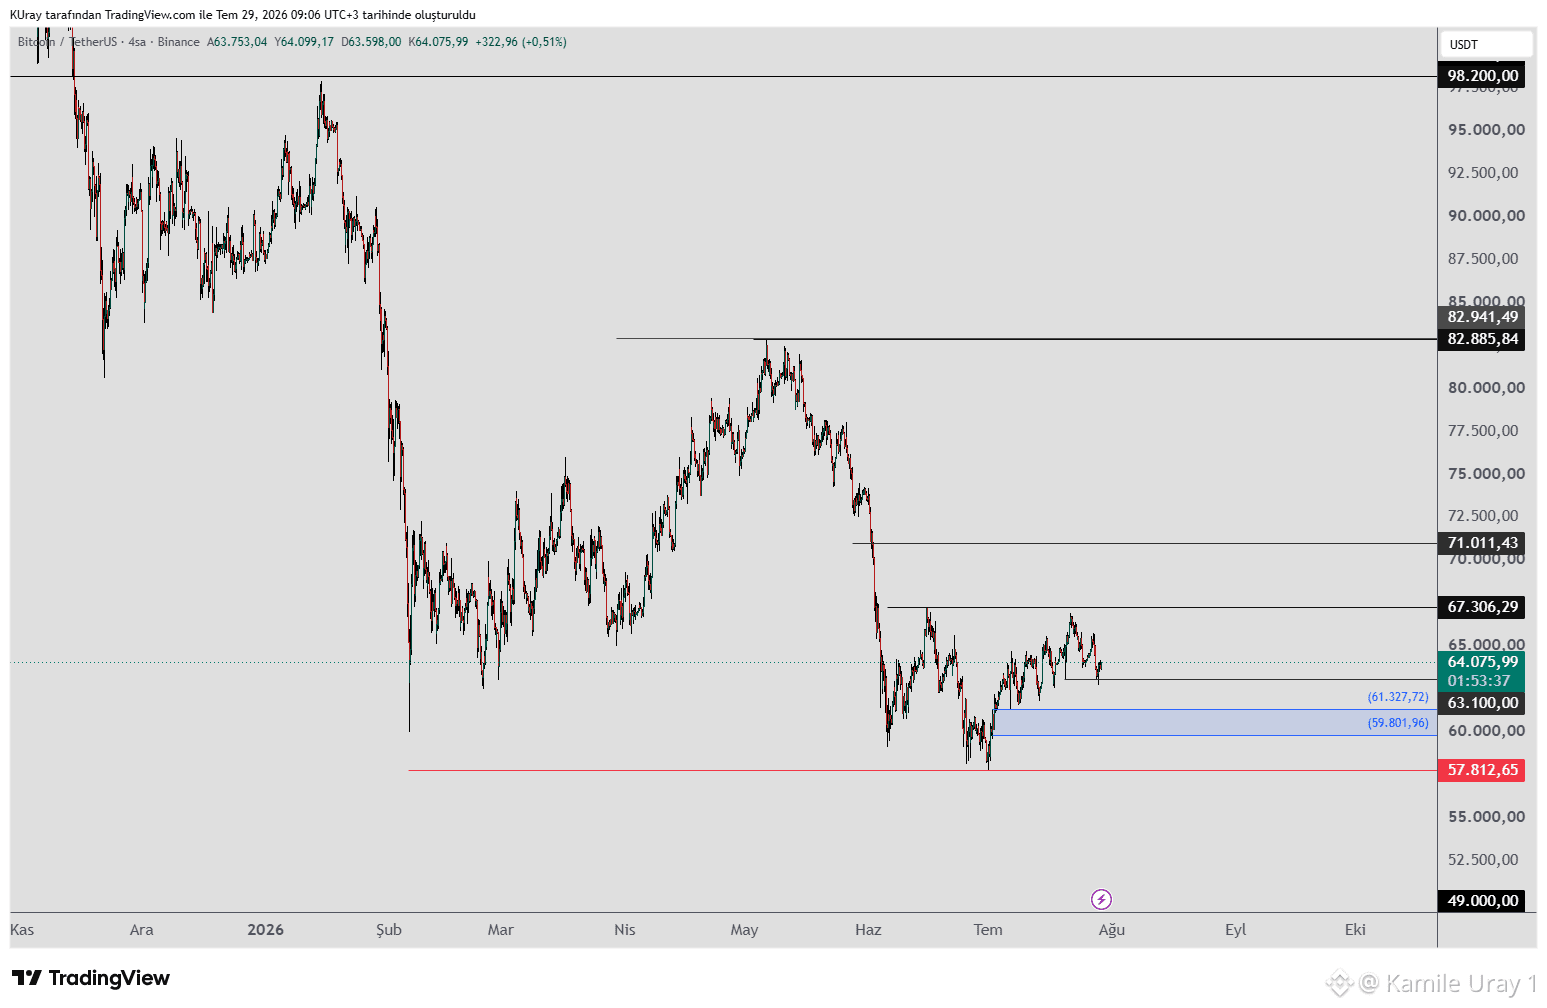
#BTC 63,100 səviyyəsini saxlayır; 67,500 müqavimətinə doğru yuxarı hərəkət davam edə bilər. Əgər bu müqavimət səviyyəsindən yuxarıda möhkəmlənərsə, 71,000, 75,000 və 82,885 müqavimət səviyyələrinin sınaqdan keçirilməsi ehtimalı var.
Əgər günlük və ya həftəlik bağlanış 82,885-dən yuxarı baş verərsə, bu, yaxın keçmişdəki eniş dalğası ilə müqayisədə ilk daha yüksək zirvəni göstərəcək. Bu, yüksəliş meylinin davam etmə ehtimalı üçün müsbət siqnaldır.
Əgər 63,100-dən aşağı düşərsə, 59,000–61,000 aralığı Fibonacci dəstək zonası kimi çıxış edir. Əgər bu səviyyə saxlanarsa, yuxarı istiqamətdə növbəti cəhd izlənə bilər.
Əgər eniş davam edərsə və həftəlik bağlanış 57,000-dən aşağı olarsa, davam edən eniş tendensiyasının ehtimalı artır və bu, 49,000–50,000 dəstək səviyyələrinə doğru düşüşə səbəb ola bilər.
#BTC 63,100 səviyyəsini saxlayır; 67,500 müqavimətinə doğru yuxarı hərəkət davam edə bilər. Əgər bu müqavimət səviyyəsindən yuxarıda möhkəmlənərsə, 71,000, 75,000 və 82,885 müqavimət səviyyələrinin sınaqdan keçirilməsi ehtimalı var.
Əgər günlük və ya həftəlik bağlanış 82,885-dən yuxarı baş verərsə, bu, yaxın keçmişdəki eniş dalğası ilə müqayisədə ilk daha yüksək zirvəni göstərəcək. Bu, yüksəliş meylinin davam etmə ehtimalı üçün müsbət siqnaldır.
Əgər 63,100-dən aşağı düşərsə, 59,000–61,000 aralığı Fibonacci dəstək zonası kimi çıxış edir. Əgər bu səviyyə saxlanarsa, yuxarı istiqamətdə növbəti cəhd izlənə bilər.
Əgər eniş davam edərsə və həftəlik bağlanış 57,000-dən aşağı olarsa, davam edən eniş tendensiyasının ehtimalı artır və bu, 49,000–50,000 dəstək səviyyələrinə doğru düşüşə səbəb ola bilər.
Əgər günlük və ya həftəlik bağlanış 82,885-dən yuxarı baş verərsə, bu, yaxın keçmişdəki eniş dalğası ilə müqayisədə ilk daha yüksək zirvəni göstərəcək. Bu, yüksəliş meylinin davam etmə ehtimalı üçün müsbət siqnaldır.
Əgər 63,100-dən aşağı düşərsə, 59,000–61,000 aralığı Fibonacci dəstək zonası kimi çıxış edir. Əgər bu səviyyə saxlanarsa, yuxarı istiqamətdə növbəti cəhd izlənə bilər.
Əgər eniş davam edərsə və həftəlik bağlanış 57,000-dən aşağı olarsa, davam edən eniş tendensiyasının ehtimalı artır və bu, 49,000–50,000 dəstək səviyyələrinə doğru düşüşə səbəb ola bilər.
70
Daha çox kontent araşdırmaq üçün daxil olun
Binance Square-də qlobal kriptovalyuta istifadəçilərinə qoşulun
⚡️ Kriptovalyuta haqqında ən son və faydalı məlumatları əldə edin.
💬 Dünyanın ən böyük kriptovalyuta birjası tərəfindən etibar edilir.
👍 Doğrulanmış yaradıcılardan gələn real məlumatları kəşf edin.
E-poçt/Telefon nömrəsi
Trenddə olan mövzular
MetaMaskExitsLidoValidatorsAfterSecurityIncident
44,546 baxış
Müzakirə edir: 721
🚨 METAMASK DƏHŞƏTLİ TƏHLÜKƏSİZLİK İNCİDENTİNDƏN SONRA ETH VALIDATORLARINI ÇIXARMAĞA BAŞLADI.
MetaMask bildirir ki, davam edən təhlükəsizlik insidenti onun infrastrukturunun bir hissəsinə təsir edib və qeyri-qəyyum (non-custodial) staking əməliyyatlarında təsirlənmiş validatorları proaktiv şəkildə çıxarmağa məcbur edib. Şirkət indiyə qədər MetaMask cüzdanlarına qarşı dərhal təhlükə tapmadığını deyir.
Əsas məqam nədir?
Bu validatorlar Lido staking-ə bağlıdır və çıxış prosesi araşdırma davam etdiyi müddətdə müvəqqəti olaraq stakingdən ETH-in çıxarılmasına səbəb ola bilər. Lido ilə bağlı hesabatlarda qeyd olunur ki, tam çıxış, geri çəkilmə (withdrawal) və yenidən qoşulma dövrü təxminən 45 günə qədər çəkə bilər.
Bu o deməkdir ki, bazar iki məsələni ayırmalıdır:
Cüzdan istifadəçilərinə hazırda dərhal risk altında olduqları barədə məlumat verilməyib.
Amma validator infrastrukturu o qədər ciddi olub ki, təcili çıxışı işə salıb.
Ethereum-un ən böyük cüzdan brendlərindən biri ehtiyat tədbiri kimi validatorları geri çəkməyə başlayanda, treyderlər diqqət edir.
Təhlükəsizlik insidentləri bazara təsir etmək üçün mütləq oğurlanmış vəsait tələb etmir.
Bəzən reaksiyanın özü siqnaldır. 👀
$ETH $LDO
#metamaskexitslidovalidatorsaftersecurityincident
KimHotbae
·1 bəyənmə
·2.6k baxış
MicronBeatsEarningsLiftsGuidance
27,830 baxış
Müzakirə edir: 577
CFTCSubmitsTwoEventContractRulesToWhiteHouse
21,195 baxış
Müzakirə edir: 500