
Bit_Guru
42.5k Paylaşımlar

Bit_Guru
 Square Verified+
Şikayət et
İstifadəçini blokla
Only Live Trader on Binance Square 💛 // Binance, CMC & X kols handle @bitgu_ru // PnL is always Live

Live Trader

Creator Awards 2024
Açıq ticarət
Daimi treyder
2.6 il
63 İzlənilir
156.6K+ İzləyicilər
300.5K+ Bəyəndi
3 Nişanlar
Postlar
Portfel
Hamısı
Sitatlar
Videolar
Canlı
BƏRKİDİLDİ
·
--
Məqalə
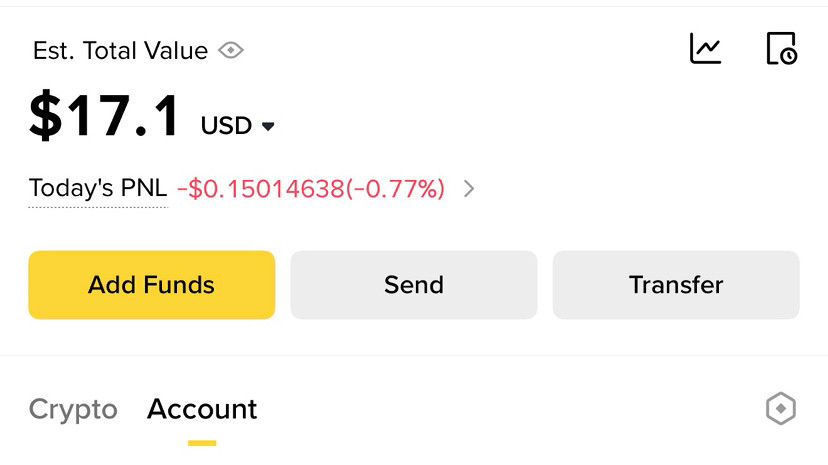
$17 ilə yalnız $100 qazanmaq mümkündürmü?Bir çox insan düşünür ki, ticarətdə real pul qazanmaq üçün böyük hesab lazım olduğunu düşünür. Bu, doğru deyil. Həqiqət sadədir, bu, nə qədər pul ilə başladığınızla bağlı deyil, sahib olduğunuz şeyləri necə idarə etdiyinizlə bağlıdır.
Bəli, $17-ni $100-ə çevirmək tamamilə mümkündür. Amma şansla, qumarla və ya gördüyünüz hər pumpın ardınca qaçmaqla deyil. Bu, disiplin, səbr və aydın bir plan tələb edir.
İlk öncə, bir şeyi başa düşməlisiniz: kiçik kapital ağıllı icra tələb edir. Böyük səhvlərə yol verə bilməzsiniz. Yüksək risklə bir pis ticarət hesabınızı sıfırlaya bilər. Buna görə də, risk idarəçiliyi sizin ən güclü silahınıza çevrilir.
$17 ilə yalnız $100 qazanmaq mümkündürmü?
Bir çox insan düşünür ki, ticarətdə real pul qazanmaq üçün böyük hesab lazım olduğunu düşünür. Bu, doğru deyil. Həqiqət sadədir, bu, nə qədər pul ilə başladığınızla bağlı deyil, sahib olduğunuz şeyləri necə idarə etdiyinizlə bağlıdır.
Bəli, $17-ni $100-ə çevirmək tamamilə mümkündür. Amma şansla, qumarla və ya gördüyünüz hər pumpın ardınca qaçmaqla deyil. Bu, disiplin, səbr və aydın bir plan tələb edir.
İlk öncə, bir şeyi başa düşməlisiniz: kiçik kapital ağıllı icra tələb edir. Böyük səhvlərə yol verə bilməzsiniz. Yüksək risklə bir pis ticarət hesabınızı sıfırlaya bilər. Buna görə də, risk idarəçiliyi sizin ən güclü silahınıza çevrilir.
Bəli, $17-ni $100-ə çevirmək tamamilə mümkündür. Amma şansla, qumarla və ya gördüyünüz hər pumpın ardınca qaçmaqla deyil. Bu, disiplin, səbr və aydın bir plan tələb edir.
İlk öncə, bir şeyi başa düşməlisiniz: kiçik kapital ağıllı icra tələb edir. Böyük səhvlərə yol verə bilməzsiniz. Yüksək risklə bir pis ticarət hesabınızı sıfırlaya bilər. Buna görə də, risk idarəçiliyi sizin ən güclü silahınıza çevrilir.
313
55
746
689k
BƏRKİDİLDİ
·
--
Artım
Kripto bazarında bu şeyleri anlamak için 4 il geçirdi, amma siz yalnızca 2 dəqiqə oxumaq lazım: 🤏
1. Bazardakı vəziyyətdən asılı olmayaraq, bir şey dəyişməz qalır: insanların 8%-i 21 milyon Bitcoinə sahib olacaq.
2. Maliyyə, kapital və risk idarəetmə bacarıqları, texniki analiz və ya kripto araşdırmalarından 100 dəfə daha önəmlidir.
3. Yuxuda qazanc: Kripto bazarında aktiv şəkildə ticarət etmədən pul qazanmanın bir çox yolu var.
Ortalama olaraq, #Bitcoin son 15 ildə illik 100%-dən çox artmışdır. Amma, niyə bu qədər az insan pul qazanır? Çünki tez zəngin olmaq ümumi bir mentalitetdir. Əgər gündə ən azı 4 saatınızı kriptoya həsr edə bilmirsinizsə, Bitcoin və ETH-yə bağlı qalın—70% BTC-də və 30% ETH-də.
Heç kəsə güvənməyin: Güvən ümid, məyusluq və səhvlərə səbəb olur. Müstəqil öyrənin və hərəkətlərinizin məsuliyyətini alın. Bu, avtomatik minting təcrübəsi qazanmağın yoludur!
Sərmayə qoymağın son məqsədi: Həyatı daha mənalı etmək. Əgər kripto sərmayəsi bunu edə bilirsə, edin. Əks halda, yenidən düşünün.
Kripto indi maliyyə bazarıdır: Əvvəlcə texnologiyadan doğulmuşdur, indi makroiqtisadiyyatdan təsirlənir və əsas maliyyə bazarları ilə əlaqəlidir.
İnsanlar sizi Bitcoin almaqdan çəkindirsələr də, unutmayın ki, bir şey geniş şəkildə qəbul edildikdə, fürsət itirilə bilər. İndi şansınızı ələ keçirin!
Ağıllı sərmayə qoyun, mənalı seçimlər edin və kripto gələcək üçün yolu açsın.
#CryptoInvesting #ethbeta #Write2Earn! #BinanceTurns7 $BTC $ETH $SOL
{spot}(SOLUSDT)
{spot}(ETHUSDT)
{spot}(BTCUSDT)
Kripto bazarında bu şeyleri anlamak için 4 il geçirdi, amma siz yalnızca 2 dəqiqə oxumaq lazım: 🤏
1. Bazardakı vəziyyətdən asılı olmayaraq, bir şey dəyişməz qalır: insanların 8%-i 21 milyon Bitcoinə sahib olacaq.
2. Maliyyə, kapital və risk idarəetmə bacarıqları, texniki analiz və ya kripto araşdırmalarından 100 dəfə daha önəmlidir.
3. Yuxuda qazanc: Kripto bazarında aktiv şəkildə ticarət etmədən pul qazanmanın bir çox yolu var.
Ortalama olaraq, #Bitcoin son 15 ildə illik 100%-dən çox artmışdır. Amma, niyə bu qədər az insan pul qazanır? Çünki tez zəngin olmaq ümumi bir mentalitetdir. Əgər gündə ən azı 4 saatınızı kriptoya həsr edə bilmirsinizsə, Bitcoin və ETH-yə bağlı qalın—70% BTC-də və 30% ETH-də.
Heç kəsə güvənməyin: Güvən ümid, məyusluq və səhvlərə səbəb olur. Müstəqil öyrənin və hərəkətlərinizin məsuliyyətini alın. Bu, avtomatik minting təcrübəsi qazanmağın yoludur!
Sərmayə qoymağın son məqsədi: Həyatı daha mənalı etmək. Əgər kripto sərmayəsi bunu edə bilirsə, edin. Əks halda, yenidən düşünün.
Kripto indi maliyyə bazarıdır: Əvvəlcə texnologiyadan doğulmuşdur, indi makroiqtisadiyyatdan təsirlənir və əsas maliyyə bazarları ilə əlaqəlidir.
İnsanlar sizi Bitcoin almaqdan çəkindirsələr də, unutmayın ki, bir şey geniş şəkildə qəbul edildikdə, fürsət itirilə bilər. İndi şansınızı ələ keçirin!
Ağıllı sərmayə qoyun, mənalı seçimlər edin və kripto gələcək üçün yolu açsın.
#CryptoInvesting #ethbeta #Write2Earn! #BinanceTurns7 $BTC $ETH $SOL
1. Bazardakı vəziyyətdən asılı olmayaraq, bir şey dəyişməz qalır: insanların 8%-i 21 milyon Bitcoinə sahib olacaq.
2. Maliyyə, kapital və risk idarəetmə bacarıqları, texniki analiz və ya kripto araşdırmalarından 100 dəfə daha önəmlidir.
3. Yuxuda qazanc: Kripto bazarında aktiv şəkildə ticarət etmədən pul qazanmanın bir çox yolu var.
Ortalama olaraq, #Bitcoin son 15 ildə illik 100%-dən çox artmışdır. Amma, niyə bu qədər az insan pul qazanır? Çünki tez zəngin olmaq ümumi bir mentalitetdir. Əgər gündə ən azı 4 saatınızı kriptoya həsr edə bilmirsinizsə, Bitcoin və ETH-yə bağlı qalın—70% BTC-də və 30% ETH-də.
Heç kəsə güvənməyin: Güvən ümid, məyusluq və səhvlərə səbəb olur. Müstəqil öyrənin və hərəkətlərinizin məsuliyyətini alın. Bu, avtomatik minting təcrübəsi qazanmağın yoludur!
Sərmayə qoymağın son məqsədi: Həyatı daha mənalı etmək. Əgər kripto sərmayəsi bunu edə bilirsə, edin. Əks halda, yenidən düşünün.
Kripto indi maliyyə bazarıdır: Əvvəlcə texnologiyadan doğulmuşdur, indi makroiqtisadiyyatdan təsirlənir və əsas maliyyə bazarları ilə əlaqəlidir.
İnsanlar sizi Bitcoin almaqdan çəkindirsələr də, unutmayın ki, bir şey geniş şəkildə qəbul edildikdə, fürsət itirilə bilər. İndi şansınızı ələ keçirin!
Ağıllı sərmayə qoyun, mənalı seçimlər edin və kripto gələcək üçün yolu açsın.
#CryptoInvesting #ethbeta #Write2Earn! #BinanceTurns7 $BTC $ETH $SOL

302
102
2.2k
1.1M
·
--
Gözlə, gözlə, gözlə… 🚨 $LAB DOWN!
Giriş: 0.051296 - 0.051347
SL: 0.051484
TP1: 0.051026 | TP2: 0.050891 | TP3: 0.050756
Gözlə, gözlə, gözlə… 🚨 $LAB DOWN!
Giriş: 0.051296 - 0.051347
SL: 0.051484
TP1: 0.051026 | TP2: 0.050891 | TP3: 0.050756
Giriş: 0.051296 - 0.051347
SL: 0.051484
TP1: 0.051026 | TP2: 0.050891 | TP3: 0.050756
272
·
--
Artım
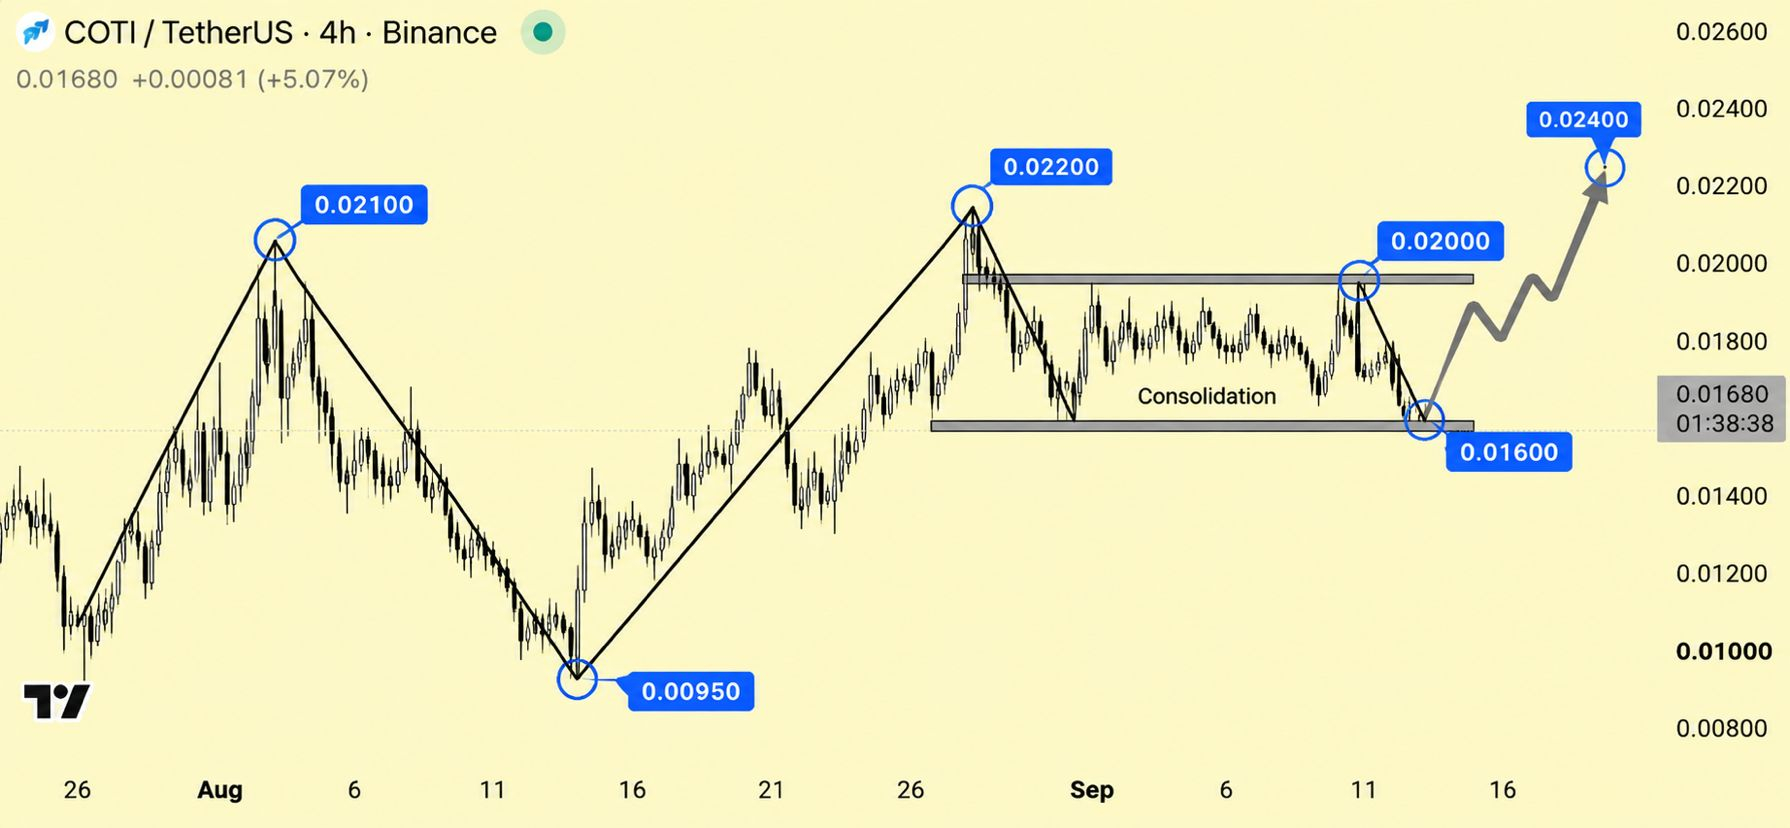
COTI Yenə Bir İtələmə üçün Hazırlanır! $COTI uzun sürən konsolidasyadan sonra 0.01600 dəstəyini saxlayır və indi bərpa əlamətləri göstərir. Əgər alıcılar güclə 0.02000-ni geri alsalar, struktur 0.02200-a doğru yolu aça bilər və növbəti əsas hədəf kimi potensial olaraq 0.02400-ni də hədəfləyə bilər.
{future}(COTIUSDT)
COTI Yenə Bir İtələmə üçün Hazırlanır! $COTI uzun sürən konsolidasyadan sonra 0.01600 dəstəyini saxlayır və indi bərpa əlamətləri göstərir. Əgər alıcılar güclə 0.02000-ni geri alsalar, struktur 0.02200-a doğru yolu aça bilər və növbəti əsas hədəf kimi potensial olaraq 0.02400-ni də hədəfləyə bilər.
2
192
·
--
Tərcüməyə bax
This $LA setup is hot… ‼️🔥 UP!
Entry: 0.071832 - 0.071904
SL: 0.071548
TP1: 0.07258 | TP2: 0.072918 | TP3: 0.073256
This $LA setup is hot… ‼️🔥 UP!
Entry: 0.071832 - 0.071904
SL: 0.071548
TP1: 0.07258 | TP2: 0.072918 | TP3: 0.073256
Entry: 0.071832 - 0.071904
SL: 0.071548
TP1: 0.07258 | TP2: 0.072918 | TP3: 0.073256
341
·
--
Qardaşlar, $FIL -a diqqətlə baxın… 🔥 UP!
Giriş: 0.98772 - 0.98871
SL: 0.98602
TP1: 0.99443 | TP2: 0.9973 | TP3: 1.0002
Qardaşlar, $FIL -a diqqətlə baxın… 🔥 UP!
Giriş: 0.98772 - 0.98871
SL: 0.98602
TP1: 0.99443 | TP2: 0.9973 | TP3: 1.0002
Giriş: 0.98772 - 0.98871
SL: 0.98602
TP1: 0.99443 | TP2: 0.9973 | TP3: 1.0002
487
·
--
$RENDER … buraxmayın ‼️ AŞAĞI hərəkət!
Giriş: 1.3807 - 1.3821
SL: 1.391
TP1: 1.3608 | TP2: 1.3509 | TP3: 1.3409
$RENDER … buraxmayın ‼️ AŞAĞI hərəkət!
Giriş: 1.3807 - 1.3821
SL: 1.391
TP1: 1.3608 | TP2: 1.3509 | TP3: 1.3409
Giriş: 1.3807 - 1.3821
SL: 1.391
TP1: 1.3608 | TP2: 1.3509 | TP3: 1.3409
1
400
·
--
POLYXUSDT Texniki Baxış: Skaner Siqnalları, Əsas Səviyyələr və Bazar Riskləri𝗣𝗢𝗟𝗬𝗫 𝘀𝗸𝗮𝗻𝗲𝗿𝗶𝗻 𝗳𝗼𝗸𝘂𝘀𝘂𝗻𝘂 𝗸𝗲ç𝗶𝗿
POLYXUSDT qeyri-adi dərəcədə geniş qiymət hərəkəti dövründən sonra skanerdə görünür və dərhal struktur aşağı meyl göstərir. Skaner POLYX-i ən böyük məğlub kimi təsnif edib və 98.67 etibarlılıq balı ilə SHORT (satış) quraşdırması hazırlayıb. Bu bal skaner daxilindəki oxunuşu təsvir edir; növbəti hərəkət barədə qətiyyət yaratmır.
14 sentyabr 2026-cı il tarixində skaner zaman damğasında POLYX 0.03963 USDT yaxınlığında kotirovka olunmuşdu. Skaner 15 dəqiqəlik təxminən 0.95% azalma qeydə aldı, hot-list məlumatları isə seçilmiş hərəkət pəncərəsində 12.805% azalma göstərdi. Binance-in bazar məlumatları son qiymətin 0.03959, açılışın 0.04012 və gün üzrə dəyişmənin -1.321% olduğunu göstərdi. CoinGecko qiymətin 0.03972 yaxınlığında olduğunu və 24 saatlıq azalmanın 5.14% olduğunu bildirdi.
POLYXUSDT Texniki Baxış: Skaner Siqnalları, Əsas Səviyyələr və Bazar Riskləri
𝗣𝗢𝗟𝗬𝗫 𝘀𝗸𝗮𝗻𝗲𝗿𝗶𝗻 𝗳𝗼𝗸𝘂𝘀𝘂𝗻𝘂 𝗸𝗲ç𝗶𝗿
POLYXUSDT qeyri-adi dərəcədə geniş qiymət hərəkəti dövründən sonra skanerdə görünür və dərhal struktur aşağı meyl göstərir. Skaner POLYX-i ən böyük məğlub kimi təsnif edib və 98.67 etibarlılıq balı ilə SHORT (satış) quraşdırması hazırlayıb. Bu bal skaner daxilindəki oxunuşu təsvir edir; növbəti hərəkət barədə qətiyyət yaratmır.
14 sentyabr 2026-cı il tarixində skaner zaman damğasında POLYX 0.03963 USDT yaxınlığında kotirovka olunmuşdu. Skaner 15 dəqiqəlik təxminən 0.95% azalma qeydə aldı, hot-list məlumatları isə seçilmiş hərəkət pəncərəsində 12.805% azalma göstərdi. Binance-in bazar məlumatları son qiymətin 0.03959, açılışın 0.04012 və gün üzrə dəyişmənin -1.321% olduğunu göstərdi. CoinGecko qiymətin 0.03972 yaxınlığında olduğunu və 24 saatlıq azalmanın 5.14% olduğunu bildirdi.
POLYXUSDT qeyri-adi dərəcədə geniş qiymət hərəkəti dövründən sonra skanerdə görünür və dərhal struktur aşağı meyl göstərir. Skaner POLYX-i ən böyük məğlub kimi təsnif edib və 98.67 etibarlılıq balı ilə SHORT (satış) quraşdırması hazırlayıb. Bu bal skaner daxilindəki oxunuşu təsvir edir; növbəti hərəkət barədə qətiyyət yaratmır.
14 sentyabr 2026-cı il tarixində skaner zaman damğasında POLYX 0.03963 USDT yaxınlığında kotirovka olunmuşdu. Skaner 15 dəqiqəlik təxminən 0.95% azalma qeydə aldı, hot-list məlumatları isə seçilmiş hərəkət pəncərəsində 12.805% azalma göstərdi. Binance-in bazar məlumatları son qiymətin 0.03959, açılışın 0.04012 və gün üzrə dəyişmənin -1.321% olduğunu göstərdi. CoinGecko qiymətin 0.03972 yaxınlığında olduğunu və 24 saatlıq azalmanın 5.14% olduğunu bildirdi.
1
316
·
--
Qardaşlar, $POLYX nömrəsinə yaxından baxın… 🔥 AŞAĞI!
Giriş: 0.03965 - 0.039689
SL: 0.039947
TP1: 0.039079 | TP2: 0.038794 | TP3: 0.038508
Qardaşlar, $POLYX nömrəsinə yaxından baxın… 🔥 AŞAĞI!
Giriş: 0.03965 - 0.039689
SL: 0.039947
TP1: 0.039079 | TP2: 0.038794 | TP3: 0.038508
Giriş: 0.03965 - 0.039689
SL: 0.039947
TP1: 0.039079 | TP2: 0.038794 | TP3: 0.038508
2
410
·
--
$FLOCK … 👀🚨 DOWN quruluşuna bax!
Giriş: 0.068864 - 0.068933
SL: 0.069181
TP1: 0.068233 | TP2: 0.067917 | TP3: 0.067601
$FLOCK … 👀🚨 DOWN quruluşuna bax!
Giriş: 0.068864 - 0.068933
SL: 0.069181
TP1: 0.068233 | TP2: 0.067917 | TP3: 0.067601
Giriş: 0.068864 - 0.068933
SL: 0.069181
TP1: 0.068233 | TP2: 0.067917 | TP3: 0.067601
502
·
--
Gözləyin… $POWR ciddiləşir! ⚡ AŞAĞI!
Giriş: 0.05995 - 0.06001
SL: 0.060399
TP1: 0.059087 | TP2: 0.058656 | TP3: 0.058224
Gözləyin… $POWR ciddiləşir! ⚡ AŞAĞI!
Giriş: 0.05995 - 0.06001
SL: 0.060399
TP1: 0.059087 | TP2: 0.058656 | TP3: 0.058224
Giriş: 0.05995 - 0.06001
SL: 0.060399
TP1: 0.059087 | TP2: 0.058656 | TP3: 0.058224
302
·
--
Bu $ARK setup isti… ‼️🔥 AŞAĞI!
Giriş: 0.16668 - 0.16685
SL: 0.16793
TP1: 0.16428 | TP2: 0.16308 | TP3: 0.16189
Bu $ARK setup isti… ‼️🔥 AŞAĞI!
Giriş: 0.16668 - 0.16685
SL: 0.16793
TP1: 0.16428 | TP2: 0.16308 | TP3: 0.16189
Giriş: 0.16668 - 0.16685
SL: 0.16793
TP1: 0.16428 | TP2: 0.16308 | TP3: 0.16189
481
·
--
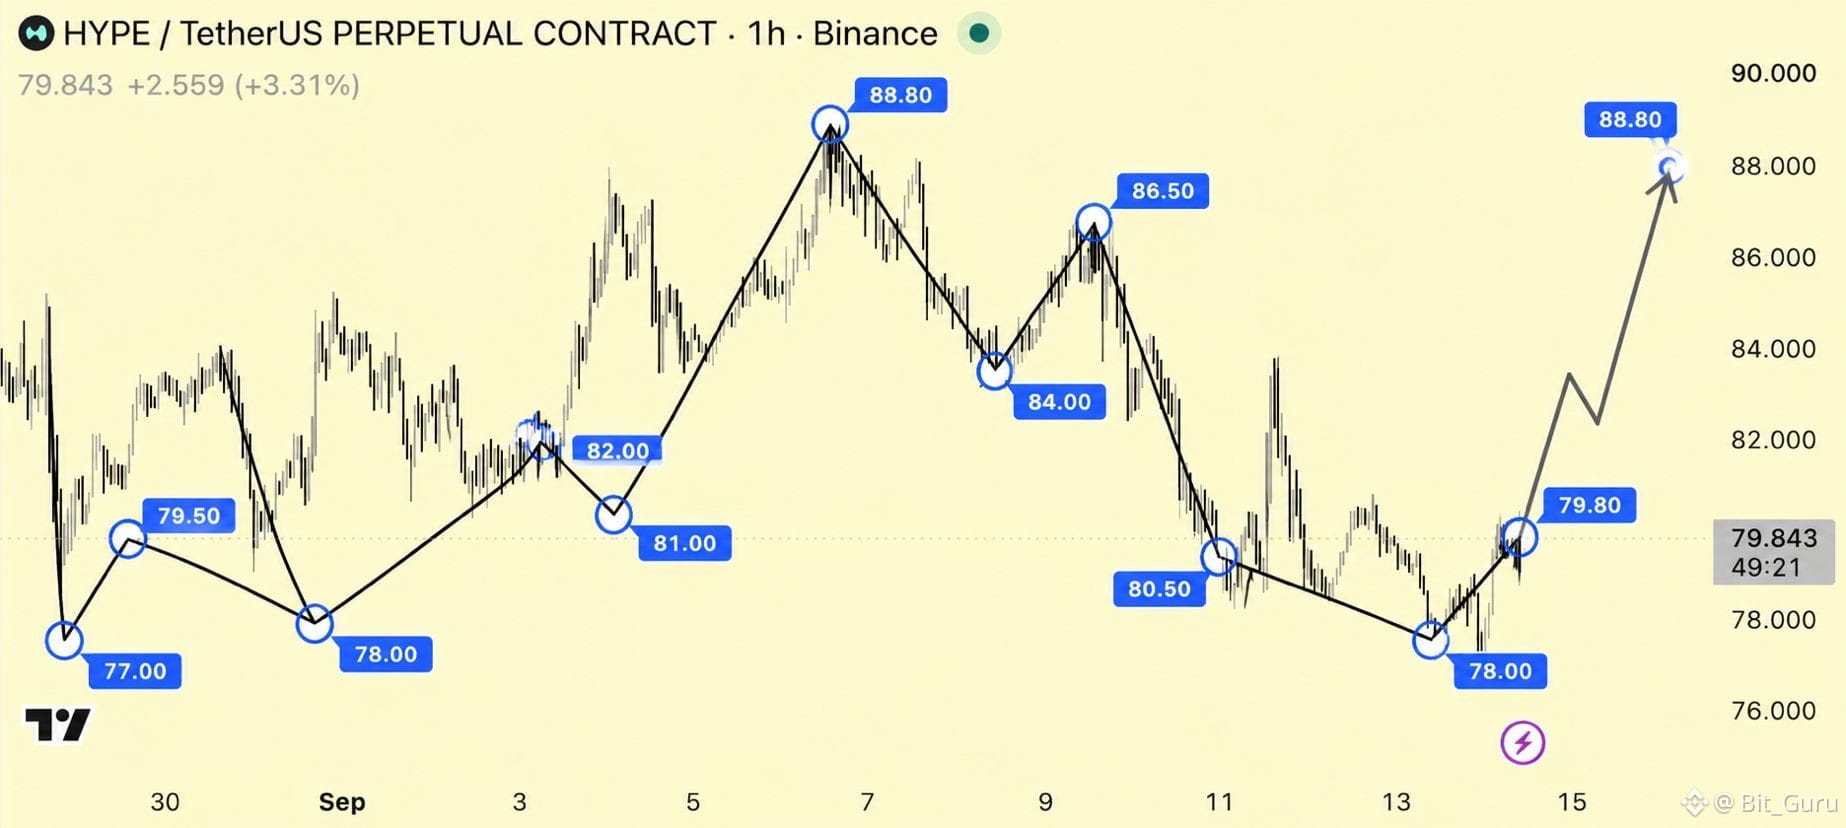
$HYPE Güclü Bərpa Göstərir! HYPE 78.00 səviyyəsindən geri sıçrayıb və 79.80-i bərpa edərək, son satışdan sonra yeni daha yüksək minimum (higher low) formalaşdırıb. Əgər alıcılar bu quruluşu qoruya bilsə, 82.00 və daha sonra 86.50 istiqamətində hərəkət mümkündür; 88.80 isə əsas yüksəliş hədəfidir.
{future}(HYPEUSDT)
$HYPE Güclü Bərpa Göstərir! HYPE 78.00 səviyyəsindən geri sıçrayıb və 79.80-i bərpa edərək, son satışdan sonra yeni daha yüksək minimum (higher low) formalaşdırıb. Əgər alıcılar bu quruluşu qoruya bilsə, 82.00 və daha sonra 86.50 istiqamətində hərəkət mümkündür; 88.80 isə əsas yüksəliş hədəfidir.
248
·
--
Qardaşlar, $WAXP nöqtəsinə diqqətlə baxın… 🔥 UP!
Giriş: 0.00556664 - 0.00557221
SL: 0.00553435
TP1: 0.00564210 | TP2: 0.00567705 | TP3: 0.00571200
Qardaşlar, $WAXP nöqtəsinə diqqətlə baxın… 🔥 UP!
Giriş: 0.00556664 - 0.00557221
SL: 0.00553435
TP1: 0.00564210 | TP2: 0.00567705 | TP3: 0.00571200
Giriş: 0.00556664 - 0.00557221
SL: 0.00553435
TP1: 0.00564210 | TP2: 0.00567705 | TP3: 0.00571200
485
·
--
UBUSDT Analizi: Momentum, Əsas Səviyyələr və Unibase-in Bitməmiş Fundamental Perspektiviİlk dalğa qiymət hərəkəti olaraqdır, hekayə isə deyil
UBUSDT RR Trader skanerində LONG istiqaməti, 100 etibarlılıq balı və TOP_GAINER sıralamasında 12-ci yerdə göründü. Bu, qısamüddətli bazar baxımından diqqətçəkəndir, amma qrafik sadə, düzxətli yüksəlişdən daha mürəkkəbdir. UB tokeni ilə əlaqəli layihə olan Unibase süni intellekt və infrastruktur sektorlarına aid edilir; token isə son vaxtlar qiymətdə kəskin artım yaşayaraq qeyri-sabit bərpa nümayiş etdirib.
UBUSDT Analizi: Momentum, Əsas Səviyyələr və Unibase-in Bitməmiş Fundamental Perspektivi
İlk dalğa qiymət hərəkəti olaraqdır, hekayə isə deyil
UBUSDT RR Trader skanerində LONG istiqaməti, 100 etibarlılıq balı və TOP_GAINER sıralamasında 12-ci yerdə göründü. Bu, qısamüddətli bazar baxımından diqqətçəkəndir, amma qrafik sadə, düzxətli yüksəlişdən daha mürəkkəbdir. UB tokeni ilə əlaqəli layihə olan Unibase süni intellekt və infrastruktur sektorlarına aid edilir; token isə son vaxtlar qiymətdə kəskin artım yaşayaraq qeyri-sabit bərpa nümayiş etdirib.
UBUSDT RR Trader skanerində LONG istiqaməti, 100 etibarlılıq balı və TOP_GAINER sıralamasında 12-ci yerdə göründü. Bu, qısamüddətli bazar baxımından diqqətçəkəndir, amma qrafik sadə, düzxətli yüksəlişdən daha mürəkkəbdir. UB tokeni ilə əlaqəli layihə olan Unibase süni intellekt və infrastruktur sektorlarına aid edilir; token isə son vaxtlar qiymətdə kəskin artım yaşayaraq qeyri-sabit bərpa nümayiş etdirib.
215
·
--
$ZK … ‼️ yüksəliş hərəkətini qaçırmayın!
Giriş: 0.00964251 - 0.00965217
Stop Loss (SL): 0.00957974
Take Profit 1 (TP1): 0.00979123 | Take Profit 2 (TP2): 0.00986076 | Take Profit 3 (TP3): 0.00993029
$ZK … ‼️ yüksəliş hərəkətini qaçırmayın!
Giriş: 0.00964251 - 0.00965217
Stop Loss (SL): 0.00957974
Take Profit 1 (TP1): 0.00979123 | Take Profit 2 (TP2): 0.00986076 | Take Profit 3 (TP3): 0.00993029
Giriş: 0.00964251 - 0.00965217
Stop Loss (SL): 0.00957974
Take Profit 1 (TP1): 0.00979123 | Take Profit 2 (TP2): 0.00986076 | Take Profit 3 (TP3): 0.00993029
374
·
--
Yaxın izləyin, $TRIA … 🔥 AŞAĞI!
Giriş: 0.00344972 - 0.00345317
SL: 0.00347926
TP1: 0.00340007 | TP2: 0.00337525 | TP3: 0.00335042
Yaxın izləyin, $TRIA … 🔥 AŞAĞI!
Giriş: 0.00344972 - 0.00345317
SL: 0.00347926
TP1: 0.00340007 | TP2: 0.00337525 | TP3: 0.00335042
Giriş: 0.00344972 - 0.00345317
SL: 0.00347926
TP1: 0.00340007 | TP2: 0.00337525 | TP3: 0.00335042
549
·
--
$MAGMA … 👀🚨 UP quraşdırmasına baxın!
Giriş: 0.24872 - 0.24897
SL: 0.2471
TP1: 0.25255 | TP2: 0.25435 | TP3: 0.25614
$MAGMA … 👀🚨 UP quraşdırmasına baxın!
Giriş: 0.24872 - 0.24897
SL: 0.2471
TP1: 0.25255 | TP2: 0.25435 | TP3: 0.25614
Giriş: 0.24872 - 0.24897
SL: 0.2471
TP1: 0.25255 | TP2: 0.25435 | TP3: 0.25614
692
·
--
Tərcüməyə bax
Look at $KAVA … 👀🚨 DOWN setup!
Entry: 0.063472 - 0.063535
SL: 0.063927
TP1: 0.062658 | TP2: 0.062252 | TP3: 0.061845
Look at $KAVA … 👀🚨 DOWN setup!
Entry: 0.063472 - 0.063535
SL: 0.063927
TP1: 0.062658 | TP2: 0.062252 | TP3: 0.061845
Entry: 0.063472 - 0.063535
SL: 0.063927
TP1: 0.062658 | TP2: 0.062252 | TP3: 0.061845
1
443
·
--
Tərcüməyə bax
EVAAUSDT: A Bearish Technical Setup Against a Firm Bitcoin Backdrop𝗣𝗿𝗶𝗰𝗲 𝗮𝗰𝘁𝗶𝗼𝗻 𝗰𝗼𝗺𝗲𝘀 𝗯𝗲𝗳𝗼𝗿𝗲 𝘁𝗵𝗲 𝘁𝗼𝗸𝗲𝗻 𝘀𝘁𝗼𝗿𝘆
EVAAUSDT has become notable because it is falling while the supplied Bitcoin snapshot remains relatively firm. The RR Trader scanner selected the pair as a short-side setup, showing a confidence score of 100 and classifying EVAA as a TOP_LOSER. That score is a scanner output, not a guarantee or a probability of success. It indicates that the system detected a particular combination of downside momentum, nearby technical levels, and market activity.
At the scanner snapshot, EVAA was quoted at 0.4808 USDT. The scanner recorded a 15-minute move of -0.6406%, a hot-list decline of -10.086%, and a volume ratio of 1.098. Binance market data showed a last price of 0.4784 USDT, a 24-hour change of -7.215%, and quote volume of approximately 1.89 million USDT. A separate CoinGecko snapshot placed EVAA at 0.47827, down 6.92% over 24 hours. These readings are not identical because they come from different snapshots and market coverage, but they describe the same broad condition: EVAA is trading under pressure near 0.48 USDT.
𝗪𝗵𝗮𝘁 𝘁𝗵𝗲 𝗿𝗲𝘀𝗲𝗮𝗿𝗰𝗵 𝘀𝗮𝘆𝘀 𝗮𝗯𝗼𝘂𝘁 𝗘𝗩𝗔𝗔 𝗣𝗿𝗼𝘁𝗼𝗰𝗼𝗹
The available data identifies EVAA Protocol as a decentralized finance project in the lending and borrowing category. The asset is also tagged under the TON ecosystem, the BNB Chain ecosystem, the Animoca Brands portfolio, and a Binance Alpha Spotlight category. These labels establish the project’s broad classification, but they do not provide a complete description of its products or operations.
The research feed does not include a project description, whitepaper, confirmed launch history, or detailed explanation of EVAA’s lending model. As a result, the exact collateral types, supported markets, liquidation rules, interest-rate design, governance structure, and deployment status across the tagged ecosystems cannot be confirmed from the supplied material.
That distinction matters. A category label can show where a project is positioned, but it cannot establish protocol quality, user growth, contract safety, or sustainable demand for the token. The available evidence supports describing EVAA as a recognizable DeFi project associated with lending and borrowing, while leaving several important product details unresolved.
𝗧𝗼𝗸𝗲𝗻 𝘂𝘁𝗶𝗹𝗶𝘁𝘆 𝗿𝗲𝗺𝗮𝗶𝗻𝘀 𝗮𝗻 𝗼𝗽𝗲𝗻 𝗾𝘂𝗲𝘀𝘁𝗶𝗼𝗻
The research identifies EVAA as the protocol token, but it does not confirm the token’s precise utility. Governance, incentives, fees, staking, and liquidity programs are all possible functions in DeFi, yet none can be stated as established facts here. A token associated with a lending protocol is not automatically required for borrowing or supplying assets.
The more important question is whether EVAA has a defined role inside the protocol and whether that role creates sustained demand. The supplied feed does not provide enough information to answer that question. It also contains no verified recent news, announcement record, development activity data, or community metrics.
The ecosystem labels may increase the project’s visibility, but no current announcement is supplied to connect those labels to a new product, integration, or price-moving event. The responsible conclusion is therefore limited: EVAA has a DeFi identity and ecosystem associations, but its token utility and recent fundamental catalysts are not established by this dataset.
𝗦𝘂𝗽𝗽𝗹𝘆, 𝗧𝗩𝗟, 𝗮𝗻𝗱 𝗱𝗶𝗹𝘂𝘁𝗶𝗼𝗻 𝗿𝗶𝘀𝗸
EVAA has a maximum supply of 50 million tokens and a reported circulating supply of 6,617,972. That means approximately 13.2% of the maximum supply is circulating. The timing and structure of future releases are not available in the research, so the potential impact of additional supply cannot be modeled precisely.
CoinGecko’s snapshot placed EVAA’s market capitalization at approximately $3.16 million and its fully diluted valuation at approximately $23.85 million. The gap between those figures highlights a meaningful dilution consideration. If more tokens enter circulation without a corresponding increase in demand, additional supply could contribute to selling pressure. The data does not identify vesting schedules, treasury holdings, investor allocations, team allocations, or unlock dates.
Reported total value locked was approximately $8.83 million, while the market-cap-to-TVL ratio was 0.36. This relationship is informative, but it does not prove that the token is undervalued. TVL can change quickly and does not, by itself, establish protocol revenue, user retention, or sustainable demand.
The reported market-cap rank was 1,964. Combined with the relatively small market capitalization, that indicates an asset whose price may be sensitive to comparatively modest flows. Small-cap markets can also produce wider price swings, which is relevant when a technical setup depends on narrow levels.
𝗧𝗵𝗲 𝗺𝗮𝗿𝗸𝗲𝘁 𝘀𝘁𝗿𝘂𝗰𝘁𝘂𝗿𝗲 𝗶𝘀 𝗰𝗹𝗲𝗮𝗿𝗹𝘆 𝘄𝗲𝗮𝗸
EVAA’s recent performance shows a broad deterioration. The token was down 26.40% over seven days, 36.13% over 14 days, 38.00% over 30 days, and 52.57% over 60 days. Over 200 days, it remained up 4.30%, indicating that the latest weakness followed an earlier period of recovery rather than representing a uniform decline over the entire available comparison period.
The hourly data shows repeated movement toward lower trading levels. EVAA opened the observed period near 0.5148, briefly traded around 0.5067 to 0.5072, and then moved lower. A high-volume hourly decline carried price from roughly 0.5067 toward 0.4948. Subsequent trading moved through the 0.4791 area, tested a low near 0.4645, and later recovered toward 0.4843 before slipping back.
The four-hour candles show a similar pattern. Price reached approximately 0.5348 during the observed window before producing a broad decline toward 0.4645. The rebound from that low has not decisively reclaimed the earlier 0.49 to 0.50 region. That leaves the market vulnerable to a lower-high structure, in which a temporary bounce fails below prior support and sellers remain active on rallies.
The selloff has already been substantial, however. The reported 24-hour range extended from approximately 0.46914 to 0.513877, which is wide relative to the current price. That volatility creates room for sharp countertrend movements and makes a single short-term signal less reliable in isolation.
𝗪𝗵𝘆 𝘁𝗵𝗲 𝘀𝗰𝗮𝗻𝗻𝗲𝗿 𝗳𝗹𝗮𝗴𝗴𝗲𝗱 𝗮 𝘀𝗵𝗼𝗿𝘁 𝘀𝗲𝘁𝘂𝗽
The scanner’s setup is concentrated around a narrow technical zone. It marked support at 0.4791 and resistance at 0.4823. The displayed entry band was 0.4810404 to 0.4815212, with an invalidation reference at 0.4839693. Its downside reference points were 0.4753357, 0.4724833, and 0.4696310. The calculated risk-reward ratio was 2.33.
The technical logic is straightforward. Price was near the scanner’s entry band and close to resistance after a heavy multi-session decline. If the bounce fails below 0.4823 and selling pressure continues, the setup identifies room toward 0.4753 and the lower reference levels. The 1.098 volume ratio indicates activity slightly above the scanner’s comparison baseline. That gives the move some participation context, although it does not confirm the direction of the next move.
The confidence score should be treated as a ranking output rather than a forecast. Price may move away from the displayed entry zone, and a level that appears relevant in one snapshot can lose significance during a fast market. A sustained move above the 0.4839693 invalidation reference would weaken the immediate bearish structure. That is an interpretation of the supplied levels, not a prediction.
𝗕𝗶𝘁𝗰𝗼𝗶𝗻 𝗶𝘀 𝗳𝗶𝗿𝗺, 𝘄𝗵𝗶𝗰𝗵 𝗺𝗮𝗸𝗲𝘀 𝗘𝗩𝗔𝗔’𝘀 𝘄𝗲𝗮𝗸𝗻𝗲𝘀𝘀 𝗺𝗼𝗿𝗲 𝗼𝗯𝘃𝗶𝗼𝘂𝘀
The supplied Bitcoin market snapshot showed BTC at 77,719.90 USDT, up 1.223% over 24 hours. Its observed range was 76,350.10 to 77,963.00. Against that backdrop, EVAA’s approximately 7% daily decline and much larger multi-week losses show clear relative weakness.
This comparison does not establish a direct cause. It does show that EVAA is not simply moving lower in lockstep with the supplied Bitcoin market. If Bitcoin remains firm, capital may stay concentrated in larger assets, leaving a small token such as EVAA exposed to continued selling. If Bitcoin reverses sharply, broader risk reduction could add pressure to an asset that already has a small market capitalization and a large recent drawdown.
Bitcoin is therefore best treated as a context filter rather than a direct signal. A stable BTC market could allow a relief bounce in EVAA, but Bitcoin strength does not guarantee that EVAA will recover. The current data favors the interpretation that EVAA is underperforming the broader market represented by the supplied BTC snapshot.
𝗖𝗮𝘁𝗮𝗹𝘆𝘀𝘁𝘀 𝗮𝗿𝗲 𝗻𝗼𝘁 𝗰𝗼𝗻𝗳𝗶𝗿𝗺𝗲𝗱
No verified recent news or catalyst was supplied for EVAA Protocol. The research contains no confirmed product launch, partnership, governance vote, token burn, listing event, integration, audit update, or incentive campaign. It would therefore be speculative to attribute the decline to a specific event.
Potential positive developments remain conditional. A credible protocol update, sustainable TVL growth, deeper lending liquidity, clearer token utility, a transparent emissions schedule, or evidence of increased usage could change the market’s assessment. A technical recovery would carry more weight if it were accompanied by stronger spot volume and a reclaim of former support rather than a brief move caused by thin liquidity.
The risks are substantial. The circulating supply is only a fraction of the maximum supply, and unlock information is unavailable. The token is small-cap and has declined more than 50% over 60 days. It is also approximately 96.49% below the recorded all-time high of $13.62 from October 26, 2025.
DeFi projects can involve smart-contract, oracle, liquidation, bridge, governance, and counterparty risks. The research does not provide audit status, exploit history, reserve details, or contract-administrator information, so those risks cannot be assessed as low from the supplied data.
𝗪𝗵𝗮𝘁 𝘁𝗼 𝘄𝗮𝘁𝗰𝗵 𝗻𝗲𝘅𝘁
The first technical question is whether EVAA can reclaim and hold the 0.4823 resistance area. A move above the scanner’s 0.4839693 invalidation reference would weaken the immediate short structure, particularly if accompanied by expanding spot volume. Failure around 0.4791 would preserve the current downside structure, while 0.4753357, 0.4724833, and 0.4696310 mark the scanner’s next downside reference levels. The recent four-hour low near 0.4645 is another structural point from the supplied market data.
Beyond price, the key questions involve participation and information. It is worth observing whether volume expands during rebounds or mainly during selloffs, whether BTC holds its recent range, and whether open interest changes alongside price. Open interest was reported at 6,330,594.4 EVAA, but the research does not include funding, liquidation, or long-short positioning data. Open interest alone cannot establish whether traders are predominantly bullish or bearish.
Fundamentally, the unresolved areas include token unlocks, utility, audits, liquidity, and protocol usage. A bounce without better information may represent only a technical reaction. A recovery supported by clearer fundamentals would provide a stronger basis for interpreting the move.
𝗕𝗮𝗹𝗮𝗻𝗰𝗲𝗱 𝗰𝗼𝗻𝗰𝗹𝘂𝘀𝗶𝗼𝗻
EVAA Protocol has a DeFi profile centered on lending and borrowing, with reported TVL that is larger than its market capitalization. At the same time, the token’s market structure is weak, its dilution picture is unresolved, and the research contains no fresh catalyst that explains or reverses the selloff.
The RR Trader scanner is highlighting a defined bearish setup near 0.48 USDT, with nearby levels at 0.4791 and 0.4823, an invalidation reference near 0.48397, and lower reference points extending toward 0.46963. Those levels provide a framework for interpreting price action, not certainty about the outcome.
The most balanced reading is that EVAA is showing pronounced relative weakness in a small-cap market after a sharp multi-week decline. Its reported ecosystem associations and TVL provide context, but they do not resolve the unanswered questions around token utility, supply releases, protocol usage, and security. Until those gaps narrow, the combination of extreme drawdown, low circulating-supply ratio, limited verified documentation, and high volatility leaves the asset with an unusually elevated risk profile.
EVAAUSDT: A Bearish Technical Setup Against a Firm Bitcoin Backdrop
𝗣𝗿𝗶𝗰𝗲 𝗮𝗰𝘁𝗶𝗼𝗻 𝗰𝗼𝗺𝗲𝘀 𝗯𝗲𝗳𝗼𝗿𝗲 𝘁𝗵𝗲 𝘁𝗼𝗸𝗲𝗻 𝘀𝘁𝗼𝗿𝘆
EVAAUSDT has become notable because it is falling while the supplied Bitcoin snapshot remains relatively firm. The RR Trader scanner selected the pair as a short-side setup, showing a confidence score of 100 and classifying EVAA as a TOP_LOSER. That score is a scanner output, not a guarantee or a probability of success. It indicates that the system detected a particular combination of downside momentum, nearby technical levels, and market activity.
At the scanner snapshot, EVAA was quoted at 0.4808 USDT. The scanner recorded a 15-minute move of -0.6406%, a hot-list decline of -10.086%, and a volume ratio of 1.098. Binance market data showed a last price of 0.4784 USDT, a 24-hour change of -7.215%, and quote volume of approximately 1.89 million USDT. A separate CoinGecko snapshot placed EVAA at 0.47827, down 6.92% over 24 hours. These readings are not identical because they come from different snapshots and market coverage, but they describe the same broad condition: EVAA is trading under pressure near 0.48 USDT.
𝗪𝗵𝗮𝘁 𝘁𝗵𝗲 𝗿𝗲𝘀𝗲𝗮𝗿𝗰𝗵 𝘀𝗮𝘆𝘀 𝗮𝗯𝗼𝘂𝘁 𝗘𝗩𝗔𝗔 𝗣𝗿𝗼𝘁𝗼𝗰𝗼𝗹
The available data identifies EVAA Protocol as a decentralized finance project in the lending and borrowing category. The asset is also tagged under the TON ecosystem, the BNB Chain ecosystem, the Animoca Brands portfolio, and a Binance Alpha Spotlight category. These labels establish the project’s broad classification, but they do not provide a complete description of its products or operations.
The research feed does not include a project description, whitepaper, confirmed launch history, or detailed explanation of EVAA’s lending model. As a result, the exact collateral types, supported markets, liquidation rules, interest-rate design, governance structure, and deployment status across the tagged ecosystems cannot be confirmed from the supplied material.
That distinction matters. A category label can show where a project is positioned, but it cannot establish protocol quality, user growth, contract safety, or sustainable demand for the token. The available evidence supports describing EVAA as a recognizable DeFi project associated with lending and borrowing, while leaving several important product details unresolved.
𝗧𝗼𝗸𝗲𝗻 𝘂𝘁𝗶𝗹𝗶𝘁𝘆 𝗿𝗲𝗺𝗮𝗶𝗻𝘀 𝗮𝗻 𝗼𝗽𝗲𝗻 𝗾𝘂𝗲𝘀𝘁𝗶𝗼𝗻
The research identifies EVAA as the protocol token, but it does not confirm the token’s precise utility. Governance, incentives, fees, staking, and liquidity programs are all possible functions in DeFi, yet none can be stated as established facts here. A token associated with a lending protocol is not automatically required for borrowing or supplying assets.
The more important question is whether EVAA has a defined role inside the protocol and whether that role creates sustained demand. The supplied feed does not provide enough information to answer that question. It also contains no verified recent news, announcement record, development activity data, or community metrics.
The ecosystem labels may increase the project’s visibility, but no current announcement is supplied to connect those labels to a new product, integration, or price-moving event. The responsible conclusion is therefore limited: EVAA has a DeFi identity and ecosystem associations, but its token utility and recent fundamental catalysts are not established by this dataset.
𝗦𝘂𝗽𝗽𝗹𝘆, 𝗧𝗩𝗟, 𝗮𝗻𝗱 𝗱𝗶𝗹𝘂𝘁𝗶𝗼𝗻 𝗿𝗶𝘀𝗸
EVAA has a maximum supply of 50 million tokens and a reported circulating supply of 6,617,972. That means approximately 13.2% of the maximum supply is circulating. The timing and structure of future releases are not available in the research, so the potential impact of additional supply cannot be modeled precisely.
CoinGecko’s snapshot placed EVAA’s market capitalization at approximately $3.16 million and its fully diluted valuation at approximately $23.85 million. The gap between those figures highlights a meaningful dilution consideration. If more tokens enter circulation without a corresponding increase in demand, additional supply could contribute to selling pressure. The data does not identify vesting schedules, treasury holdings, investor allocations, team allocations, or unlock dates.
Reported total value locked was approximately $8.83 million, while the market-cap-to-TVL ratio was 0.36. This relationship is informative, but it does not prove that the token is undervalued. TVL can change quickly and does not, by itself, establish protocol revenue, user retention, or sustainable demand.
The reported market-cap rank was 1,964. Combined with the relatively small market capitalization, that indicates an asset whose price may be sensitive to comparatively modest flows. Small-cap markets can also produce wider price swings, which is relevant when a technical setup depends on narrow levels.
𝗧𝗵𝗲 𝗺𝗮𝗿𝗸𝗲𝘁 𝘀𝘁𝗿𝘂𝗰𝘁𝘂𝗿𝗲 𝗶𝘀 𝗰𝗹𝗲𝗮𝗿𝗹𝘆 𝘄𝗲𝗮𝗸
EVAA’s recent performance shows a broad deterioration. The token was down 26.40% over seven days, 36.13% over 14 days, 38.00% over 30 days, and 52.57% over 60 days. Over 200 days, it remained up 4.30%, indicating that the latest weakness followed an earlier period of recovery rather than representing a uniform decline over the entire available comparison period.
The hourly data shows repeated movement toward lower trading levels. EVAA opened the observed period near 0.5148, briefly traded around 0.5067 to 0.5072, and then moved lower. A high-volume hourly decline carried price from roughly 0.5067 toward 0.4948. Subsequent trading moved through the 0.4791 area, tested a low near 0.4645, and later recovered toward 0.4843 before slipping back.
The four-hour candles show a similar pattern. Price reached approximately 0.5348 during the observed window before producing a broad decline toward 0.4645. The rebound from that low has not decisively reclaimed the earlier 0.49 to 0.50 region. That leaves the market vulnerable to a lower-high structure, in which a temporary bounce fails below prior support and sellers remain active on rallies.
The selloff has already been substantial, however. The reported 24-hour range extended from approximately 0.46914 to 0.513877, which is wide relative to the current price. That volatility creates room for sharp countertrend movements and makes a single short-term signal less reliable in isolation.
𝗪𝗵𝘆 𝘁𝗵𝗲 𝘀𝗰𝗮𝗻𝗻𝗲𝗿 𝗳𝗹𝗮𝗴𝗴𝗲𝗱 𝗮 𝘀𝗵𝗼𝗿𝘁 𝘀𝗲𝘁𝘂𝗽
The scanner’s setup is concentrated around a narrow technical zone. It marked support at 0.4791 and resistance at 0.4823. The displayed entry band was 0.4810404 to 0.4815212, with an invalidation reference at 0.4839693. Its downside reference points were 0.4753357, 0.4724833, and 0.4696310. The calculated risk-reward ratio was 2.33.
The technical logic is straightforward. Price was near the scanner’s entry band and close to resistance after a heavy multi-session decline. If the bounce fails below 0.4823 and selling pressure continues, the setup identifies room toward 0.4753 and the lower reference levels. The 1.098 volume ratio indicates activity slightly above the scanner’s comparison baseline. That gives the move some participation context, although it does not confirm the direction of the next move.
The confidence score should be treated as a ranking output rather than a forecast. Price may move away from the displayed entry zone, and a level that appears relevant in one snapshot can lose significance during a fast market. A sustained move above the 0.4839693 invalidation reference would weaken the immediate bearish structure. That is an interpretation of the supplied levels, not a prediction.
𝗕𝗶𝘁𝗰𝗼𝗶𝗻 𝗶𝘀 𝗳𝗶𝗿𝗺, 𝘄𝗵𝗶𝗰𝗵 𝗺𝗮𝗸𝗲𝘀 𝗘𝗩𝗔𝗔’𝘀 𝘄𝗲𝗮𝗸𝗻𝗲𝘀𝘀 𝗺𝗼𝗿𝗲 𝗼𝗯𝘃𝗶𝗼𝘂𝘀
The supplied Bitcoin market snapshot showed BTC at 77,719.90 USDT, up 1.223% over 24 hours. Its observed range was 76,350.10 to 77,963.00. Against that backdrop, EVAA’s approximately 7% daily decline and much larger multi-week losses show clear relative weakness.
This comparison does not establish a direct cause. It does show that EVAA is not simply moving lower in lockstep with the supplied Bitcoin market. If Bitcoin remains firm, capital may stay concentrated in larger assets, leaving a small token such as EVAA exposed to continued selling. If Bitcoin reverses sharply, broader risk reduction could add pressure to an asset that already has a small market capitalization and a large recent drawdown.
Bitcoin is therefore best treated as a context filter rather than a direct signal. A stable BTC market could allow a relief bounce in EVAA, but Bitcoin strength does not guarantee that EVAA will recover. The current data favors the interpretation that EVAA is underperforming the broader market represented by the supplied BTC snapshot.
𝗖𝗮𝘁𝗮𝗹𝘆𝘀𝘁𝘀 𝗮𝗿𝗲 𝗻𝗼𝘁 𝗰𝗼𝗻𝗳𝗶𝗿𝗺𝗲𝗱
No verified recent news or catalyst was supplied for EVAA Protocol. The research contains no confirmed product launch, partnership, governance vote, token burn, listing event, integration, audit update, or incentive campaign. It would therefore be speculative to attribute the decline to a specific event.
Potential positive developments remain conditional. A credible protocol update, sustainable TVL growth, deeper lending liquidity, clearer token utility, a transparent emissions schedule, or evidence of increased usage could change the market’s assessment. A technical recovery would carry more weight if it were accompanied by stronger spot volume and a reclaim of former support rather than a brief move caused by thin liquidity.
The risks are substantial. The circulating supply is only a fraction of the maximum supply, and unlock information is unavailable. The token is small-cap and has declined more than 50% over 60 days. It is also approximately 96.49% below the recorded all-time high of $13.62 from October 26, 2025.
DeFi projects can involve smart-contract, oracle, liquidation, bridge, governance, and counterparty risks. The research does not provide audit status, exploit history, reserve details, or contract-administrator information, so those risks cannot be assessed as low from the supplied data.
𝗪𝗵𝗮𝘁 𝘁𝗼 𝘄𝗮𝘁𝗰𝗵 𝗻𝗲𝘅𝘁
The first technical question is whether EVAA can reclaim and hold the 0.4823 resistance area. A move above the scanner’s 0.4839693 invalidation reference would weaken the immediate short structure, particularly if accompanied by expanding spot volume. Failure around 0.4791 would preserve the current downside structure, while 0.4753357, 0.4724833, and 0.4696310 mark the scanner’s next downside reference levels. The recent four-hour low near 0.4645 is another structural point from the supplied market data.
Beyond price, the key questions involve participation and information. It is worth observing whether volume expands during rebounds or mainly during selloffs, whether BTC holds its recent range, and whether open interest changes alongside price. Open interest was reported at 6,330,594.4 EVAA, but the research does not include funding, liquidation, or long-short positioning data. Open interest alone cannot establish whether traders are predominantly bullish or bearish.
Fundamentally, the unresolved areas include token unlocks, utility, audits, liquidity, and protocol usage. A bounce without better information may represent only a technical reaction. A recovery supported by clearer fundamentals would provide a stronger basis for interpreting the move.
𝗕𝗮𝗹𝗮𝗻𝗰𝗲𝗱 𝗰𝗼𝗻𝗰𝗹𝘂𝘀𝗶𝗼𝗻
EVAA Protocol has a DeFi profile centered on lending and borrowing, with reported TVL that is larger than its market capitalization. At the same time, the token’s market structure is weak, its dilution picture is unresolved, and the research contains no fresh catalyst that explains or reverses the selloff.
The RR Trader scanner is highlighting a defined bearish setup near 0.48 USDT, with nearby levels at 0.4791 and 0.4823, an invalidation reference near 0.48397, and lower reference points extending toward 0.46963. Those levels provide a framework for interpreting price action, not certainty about the outcome.
The most balanced reading is that EVAA is showing pronounced relative weakness in a small-cap market after a sharp multi-week decline. Its reported ecosystem associations and TVL provide context, but they do not resolve the unanswered questions around token utility, supply releases, protocol usage, and security. Until those gaps narrow, the combination of extreme drawdown, low circulating-supply ratio, limited verified documentation, and high volatility leaves the asset with an unusually elevated risk profile.
EVAAUSDT has become notable because it is falling while the supplied Bitcoin snapshot remains relatively firm. The RR Trader scanner selected the pair as a short-side setup, showing a confidence score of 100 and classifying EVAA as a TOP_LOSER. That score is a scanner output, not a guarantee or a probability of success. It indicates that the system detected a particular combination of downside momentum, nearby technical levels, and market activity.
At the scanner snapshot, EVAA was quoted at 0.4808 USDT. The scanner recorded a 15-minute move of -0.6406%, a hot-list decline of -10.086%, and a volume ratio of 1.098. Binance market data showed a last price of 0.4784 USDT, a 24-hour change of -7.215%, and quote volume of approximately 1.89 million USDT. A separate CoinGecko snapshot placed EVAA at 0.47827, down 6.92% over 24 hours. These readings are not identical because they come from different snapshots and market coverage, but they describe the same broad condition: EVAA is trading under pressure near 0.48 USDT.
𝗪𝗵𝗮𝘁 𝘁𝗵𝗲 𝗿𝗲𝘀𝗲𝗮𝗿𝗰𝗵 𝘀𝗮𝘆𝘀 𝗮𝗯𝗼𝘂𝘁 𝗘𝗩𝗔𝗔 𝗣𝗿𝗼𝘁𝗼𝗰𝗼𝗹
The available data identifies EVAA Protocol as a decentralized finance project in the lending and borrowing category. The asset is also tagged under the TON ecosystem, the BNB Chain ecosystem, the Animoca Brands portfolio, and a Binance Alpha Spotlight category. These labels establish the project’s broad classification, but they do not provide a complete description of its products or operations.
The research feed does not include a project description, whitepaper, confirmed launch history, or detailed explanation of EVAA’s lending model. As a result, the exact collateral types, supported markets, liquidation rules, interest-rate design, governance structure, and deployment status across the tagged ecosystems cannot be confirmed from the supplied material.
That distinction matters. A category label can show where a project is positioned, but it cannot establish protocol quality, user growth, contract safety, or sustainable demand for the token. The available evidence supports describing EVAA as a recognizable DeFi project associated with lending and borrowing, while leaving several important product details unresolved.
𝗧𝗼𝗸𝗲𝗻 𝘂𝘁𝗶𝗹𝗶𝘁𝘆 𝗿𝗲𝗺𝗮𝗶𝗻𝘀 𝗮𝗻 𝗼𝗽𝗲𝗻 𝗾𝘂𝗲𝘀𝘁𝗶𝗼𝗻
The research identifies EVAA as the protocol token, but it does not confirm the token’s precise utility. Governance, incentives, fees, staking, and liquidity programs are all possible functions in DeFi, yet none can be stated as established facts here. A token associated with a lending protocol is not automatically required for borrowing or supplying assets.
The more important question is whether EVAA has a defined role inside the protocol and whether that role creates sustained demand. The supplied feed does not provide enough information to answer that question. It also contains no verified recent news, announcement record, development activity data, or community metrics.
The ecosystem labels may increase the project’s visibility, but no current announcement is supplied to connect those labels to a new product, integration, or price-moving event. The responsible conclusion is therefore limited: EVAA has a DeFi identity and ecosystem associations, but its token utility and recent fundamental catalysts are not established by this dataset.
𝗦𝘂𝗽𝗽𝗹𝘆, 𝗧𝗩𝗟, 𝗮𝗻𝗱 𝗱𝗶𝗹𝘂𝘁𝗶𝗼𝗻 𝗿𝗶𝘀𝗸
EVAA has a maximum supply of 50 million tokens and a reported circulating supply of 6,617,972. That means approximately 13.2% of the maximum supply is circulating. The timing and structure of future releases are not available in the research, so the potential impact of additional supply cannot be modeled precisely.
CoinGecko’s snapshot placed EVAA’s market capitalization at approximately $3.16 million and its fully diluted valuation at approximately $23.85 million. The gap between those figures highlights a meaningful dilution consideration. If more tokens enter circulation without a corresponding increase in demand, additional supply could contribute to selling pressure. The data does not identify vesting schedules, treasury holdings, investor allocations, team allocations, or unlock dates.
Reported total value locked was approximately $8.83 million, while the market-cap-to-TVL ratio was 0.36. This relationship is informative, but it does not prove that the token is undervalued. TVL can change quickly and does not, by itself, establish protocol revenue, user retention, or sustainable demand.
The reported market-cap rank was 1,964. Combined with the relatively small market capitalization, that indicates an asset whose price may be sensitive to comparatively modest flows. Small-cap markets can also produce wider price swings, which is relevant when a technical setup depends on narrow levels.
𝗧𝗵𝗲 𝗺𝗮𝗿𝗸𝗲𝘁 𝘀𝘁𝗿𝘂𝗰𝘁𝘂𝗿𝗲 𝗶𝘀 𝗰𝗹𝗲𝗮𝗿𝗹𝘆 𝘄𝗲𝗮𝗸
EVAA’s recent performance shows a broad deterioration. The token was down 26.40% over seven days, 36.13% over 14 days, 38.00% over 30 days, and 52.57% over 60 days. Over 200 days, it remained up 4.30%, indicating that the latest weakness followed an earlier period of recovery rather than representing a uniform decline over the entire available comparison period.
The hourly data shows repeated movement toward lower trading levels. EVAA opened the observed period near 0.5148, briefly traded around 0.5067 to 0.5072, and then moved lower. A high-volume hourly decline carried price from roughly 0.5067 toward 0.4948. Subsequent trading moved through the 0.4791 area, tested a low near 0.4645, and later recovered toward 0.4843 before slipping back.
The four-hour candles show a similar pattern. Price reached approximately 0.5348 during the observed window before producing a broad decline toward 0.4645. The rebound from that low has not decisively reclaimed the earlier 0.49 to 0.50 region. That leaves the market vulnerable to a lower-high structure, in which a temporary bounce fails below prior support and sellers remain active on rallies.
The selloff has already been substantial, however. The reported 24-hour range extended from approximately 0.46914 to 0.513877, which is wide relative to the current price. That volatility creates room for sharp countertrend movements and makes a single short-term signal less reliable in isolation.
𝗪𝗵𝘆 𝘁𝗵𝗲 𝘀𝗰𝗮𝗻𝗻𝗲𝗿 𝗳𝗹𝗮𝗴𝗴𝗲𝗱 𝗮 𝘀𝗵𝗼𝗿𝘁 𝘀𝗲𝘁𝘂𝗽
The scanner’s setup is concentrated around a narrow technical zone. It marked support at 0.4791 and resistance at 0.4823. The displayed entry band was 0.4810404 to 0.4815212, with an invalidation reference at 0.4839693. Its downside reference points were 0.4753357, 0.4724833, and 0.4696310. The calculated risk-reward ratio was 2.33.
The technical logic is straightforward. Price was near the scanner’s entry band and close to resistance after a heavy multi-session decline. If the bounce fails below 0.4823 and selling pressure continues, the setup identifies room toward 0.4753 and the lower reference levels. The 1.098 volume ratio indicates activity slightly above the scanner’s comparison baseline. That gives the move some participation context, although it does not confirm the direction of the next move.
The confidence score should be treated as a ranking output rather than a forecast. Price may move away from the displayed entry zone, and a level that appears relevant in one snapshot can lose significance during a fast market. A sustained move above the 0.4839693 invalidation reference would weaken the immediate bearish structure. That is an interpretation of the supplied levels, not a prediction.
𝗕𝗶𝘁𝗰𝗼𝗶𝗻 𝗶𝘀 𝗳𝗶𝗿𝗺, 𝘄𝗵𝗶𝗰𝗵 𝗺𝗮𝗸𝗲𝘀 𝗘𝗩𝗔𝗔’𝘀 𝘄𝗲𝗮𝗸𝗻𝗲𝘀𝘀 𝗺𝗼𝗿𝗲 𝗼𝗯𝘃𝗶𝗼𝘂𝘀
The supplied Bitcoin market snapshot showed BTC at 77,719.90 USDT, up 1.223% over 24 hours. Its observed range was 76,350.10 to 77,963.00. Against that backdrop, EVAA’s approximately 7% daily decline and much larger multi-week losses show clear relative weakness.
This comparison does not establish a direct cause. It does show that EVAA is not simply moving lower in lockstep with the supplied Bitcoin market. If Bitcoin remains firm, capital may stay concentrated in larger assets, leaving a small token such as EVAA exposed to continued selling. If Bitcoin reverses sharply, broader risk reduction could add pressure to an asset that already has a small market capitalization and a large recent drawdown.
Bitcoin is therefore best treated as a context filter rather than a direct signal. A stable BTC market could allow a relief bounce in EVAA, but Bitcoin strength does not guarantee that EVAA will recover. The current data favors the interpretation that EVAA is underperforming the broader market represented by the supplied BTC snapshot.
𝗖𝗮𝘁𝗮𝗹𝘆𝘀𝘁𝘀 𝗮𝗿𝗲 𝗻𝗼𝘁 𝗰𝗼𝗻𝗳𝗶𝗿𝗺𝗲𝗱
No verified recent news or catalyst was supplied for EVAA Protocol. The research contains no confirmed product launch, partnership, governance vote, token burn, listing event, integration, audit update, or incentive campaign. It would therefore be speculative to attribute the decline to a specific event.
Potential positive developments remain conditional. A credible protocol update, sustainable TVL growth, deeper lending liquidity, clearer token utility, a transparent emissions schedule, or evidence of increased usage could change the market’s assessment. A technical recovery would carry more weight if it were accompanied by stronger spot volume and a reclaim of former support rather than a brief move caused by thin liquidity.
The risks are substantial. The circulating supply is only a fraction of the maximum supply, and unlock information is unavailable. The token is small-cap and has declined more than 50% over 60 days. It is also approximately 96.49% below the recorded all-time high of $13.62 from October 26, 2025.
DeFi projects can involve smart-contract, oracle, liquidation, bridge, governance, and counterparty risks. The research does not provide audit status, exploit history, reserve details, or contract-administrator information, so those risks cannot be assessed as low from the supplied data.
𝗪𝗵𝗮𝘁 𝘁𝗼 𝘄𝗮𝘁𝗰𝗵 𝗻𝗲𝘅𝘁
The first technical question is whether EVAA can reclaim and hold the 0.4823 resistance area. A move above the scanner’s 0.4839693 invalidation reference would weaken the immediate short structure, particularly if accompanied by expanding spot volume. Failure around 0.4791 would preserve the current downside structure, while 0.4753357, 0.4724833, and 0.4696310 mark the scanner’s next downside reference levels. The recent four-hour low near 0.4645 is another structural point from the supplied market data.
Beyond price, the key questions involve participation and information. It is worth observing whether volume expands during rebounds or mainly during selloffs, whether BTC holds its recent range, and whether open interest changes alongside price. Open interest was reported at 6,330,594.4 EVAA, but the research does not include funding, liquidation, or long-short positioning data. Open interest alone cannot establish whether traders are predominantly bullish or bearish.
Fundamentally, the unresolved areas include token unlocks, utility, audits, liquidity, and protocol usage. A bounce without better information may represent only a technical reaction. A recovery supported by clearer fundamentals would provide a stronger basis for interpreting the move.
𝗕𝗮𝗹𝗮𝗻𝗰𝗲𝗱 𝗰𝗼𝗻𝗰𝗹𝘂𝘀𝗶𝗼𝗻
EVAA Protocol has a DeFi profile centered on lending and borrowing, with reported TVL that is larger than its market capitalization. At the same time, the token’s market structure is weak, its dilution picture is unresolved, and the research contains no fresh catalyst that explains or reverses the selloff.
The RR Trader scanner is highlighting a defined bearish setup near 0.48 USDT, with nearby levels at 0.4791 and 0.4823, an invalidation reference near 0.48397, and lower reference points extending toward 0.46963. Those levels provide a framework for interpreting price action, not certainty about the outcome.
The most balanced reading is that EVAA is showing pronounced relative weakness in a small-cap market after a sharp multi-week decline. Its reported ecosystem associations and TVL provide context, but they do not resolve the unanswered questions around token utility, supply releases, protocol usage, and security. Until those gaps narrow, the combination of extreme drawdown, low circulating-supply ratio, limited verified documentation, and high volatility leaves the asset with an unusually elevated risk profile.
242
Daha çox kontent araşdırmaq üçün daxil olun
Binance Square-də qlobal kriptovalyuta istifadəçilərinə qoşulun
⚡️ Kriptovalyuta haqqında ən son və faydalı məlumatları əldə edin.
💬 Dünyanın ən böyük kriptovalyuta birjası tərəfindən etibar edilir.
👍 Doğrulanmış yaradıcılardan gələn real məlumatları kəşf edin.
E-poçt/Telefon nömrəsi
Trenddə olan mövzular
BitcoinHoldsAbove$77000
482 baxış
Müzakirə edir: 41
#anthropicceocallsforaislowdown
🚨 $BTC $77K ƏLƏDƏ SAXLAYIR, BAZAR BTC & ETH-ə FOKUSLANIR! 🦅
Bitcoin 4H trend xəttinə hörmət edir, bullish quruluş aktiv olaraq qalır! 🎯
📍 Giriş: 76,826 – 76,500
🎯 Hədəflər: 76,900 ➔ 77,000 ➔ 77,300
🛑 Stop Loss: 76,400
⚠️ Dəqiq Qayda: Əsas struktur qorunduğu müddətdə bu quruluş etibarlıdır. Stop zonası itərsə, ticarət qüvvədən düşür.
⚡ Diqqət Siyahısı (Watchlist) Aktivlər:
🪙 $BTC — Makro volatillikdən əvvəl əsas texniki dəstəyə hörmət edir! 📈
🌐 $ETH — Potensial qırılma üçün əsas tələbat zonalarının ətrafında sıx konsolidasiya edir! 📊
Levracı diqqətlə idarə et və qiymətin əvvəlcədən müəyyən etdiyin ov (hunting) zonasına çatmasını gözlə! 🛡️🧠
❓ Nə edəcəksən? Burada BTC-ni long edirsən, yoxsa daha aşağı girişləri gözləyirsən? Planını aşağıda yaz! 👇
İmtina: DYOR. Maliyyə məsləhəti deyil.
#BitcoinHoldsAbove$77000
#AvalancheIntegratesIntoUAEPassDigitalVault
#AnthropicCEOCallsForAISlowdown
#BrazilCentralBankRaisesVASPCapitalRequirements
Hifza Rubab
·0 bəyənmə
·51 baxış
FedHikeOddsRiseTo89%
1,677 baxış
Müzakirə edir: 104
BitcoinCrosses$78000
2,934 baxış
Müzakirə edir: 134