
Badsha Bilal
81 Paylaşımlar

Badsha Bilal
Şikayət et
İstifadəçini blokla
Açıq ticarət
Daimi treyder
3.6 il
5 İzlənilir
5 İzləyicilər
60 Bəyəndi
Postlar
Portfel
Hamısı
Sitatlar
·
--
30 günlük ticarət $NEAR 353 USDT
$NEAR $SAND $BTC
{spot}(BTCUSDT)
{spot}(NEARUSDT)
{spot}(SANDUSDT)
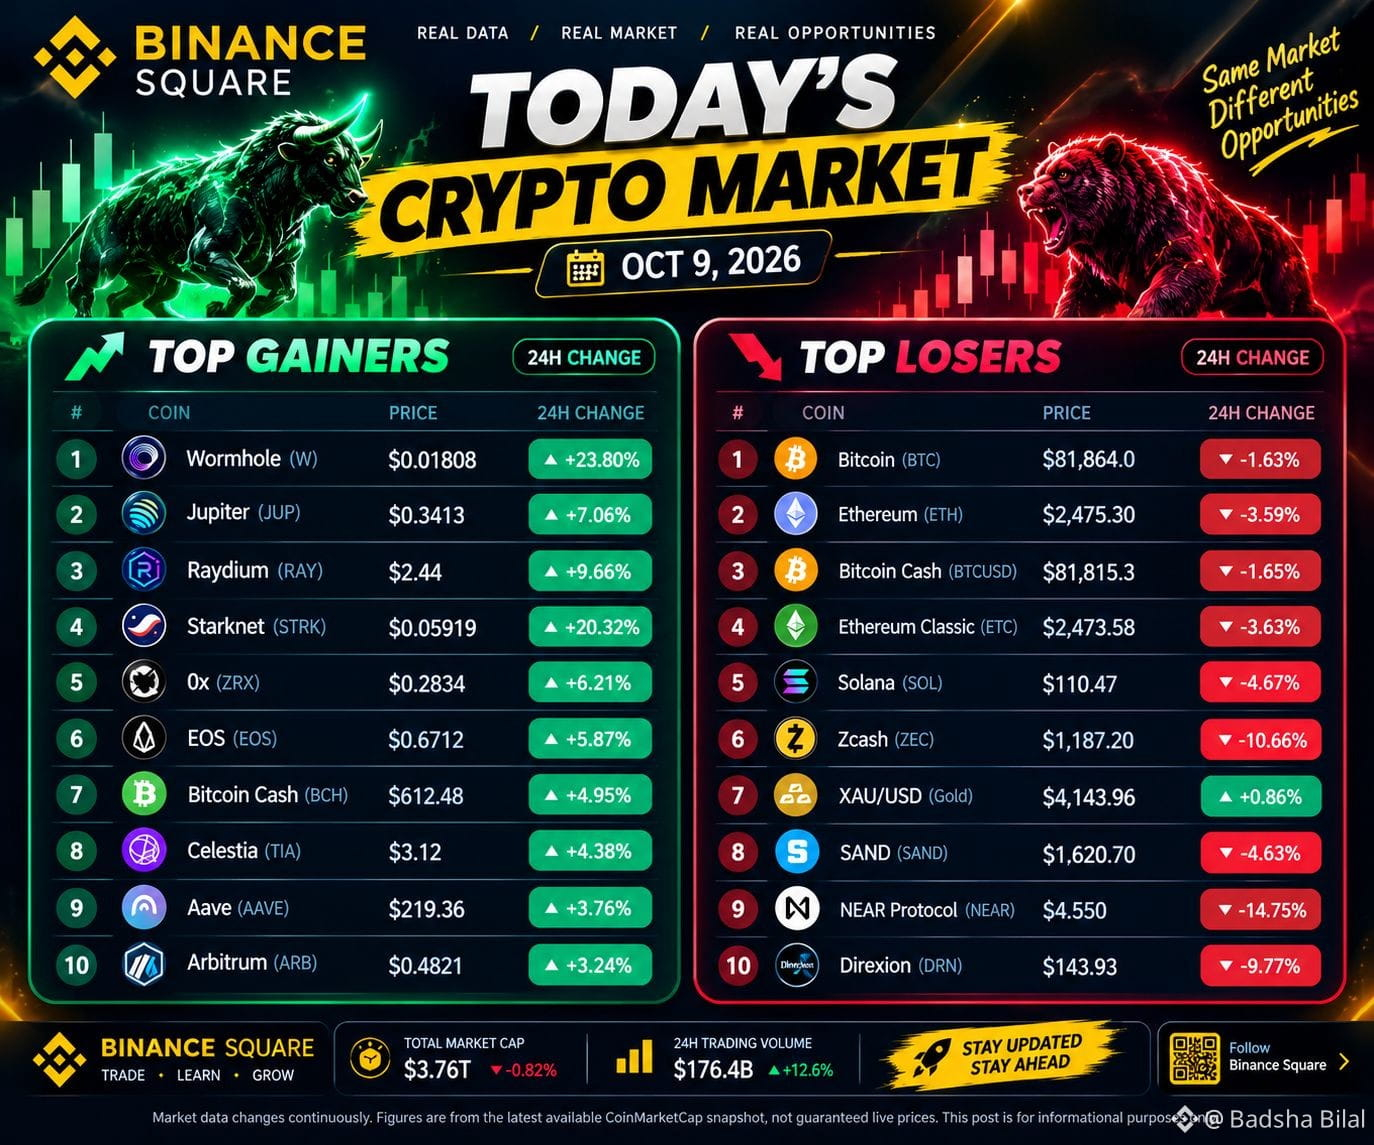
Bu gün, 9 oktyabr bazarı
$NEAR $SAND $BTC
Bu gün, 9 oktyabr bazarı
Bu gün, 9 oktyabr bazarı
363
·
--
Artım
Tərcüməyə bax
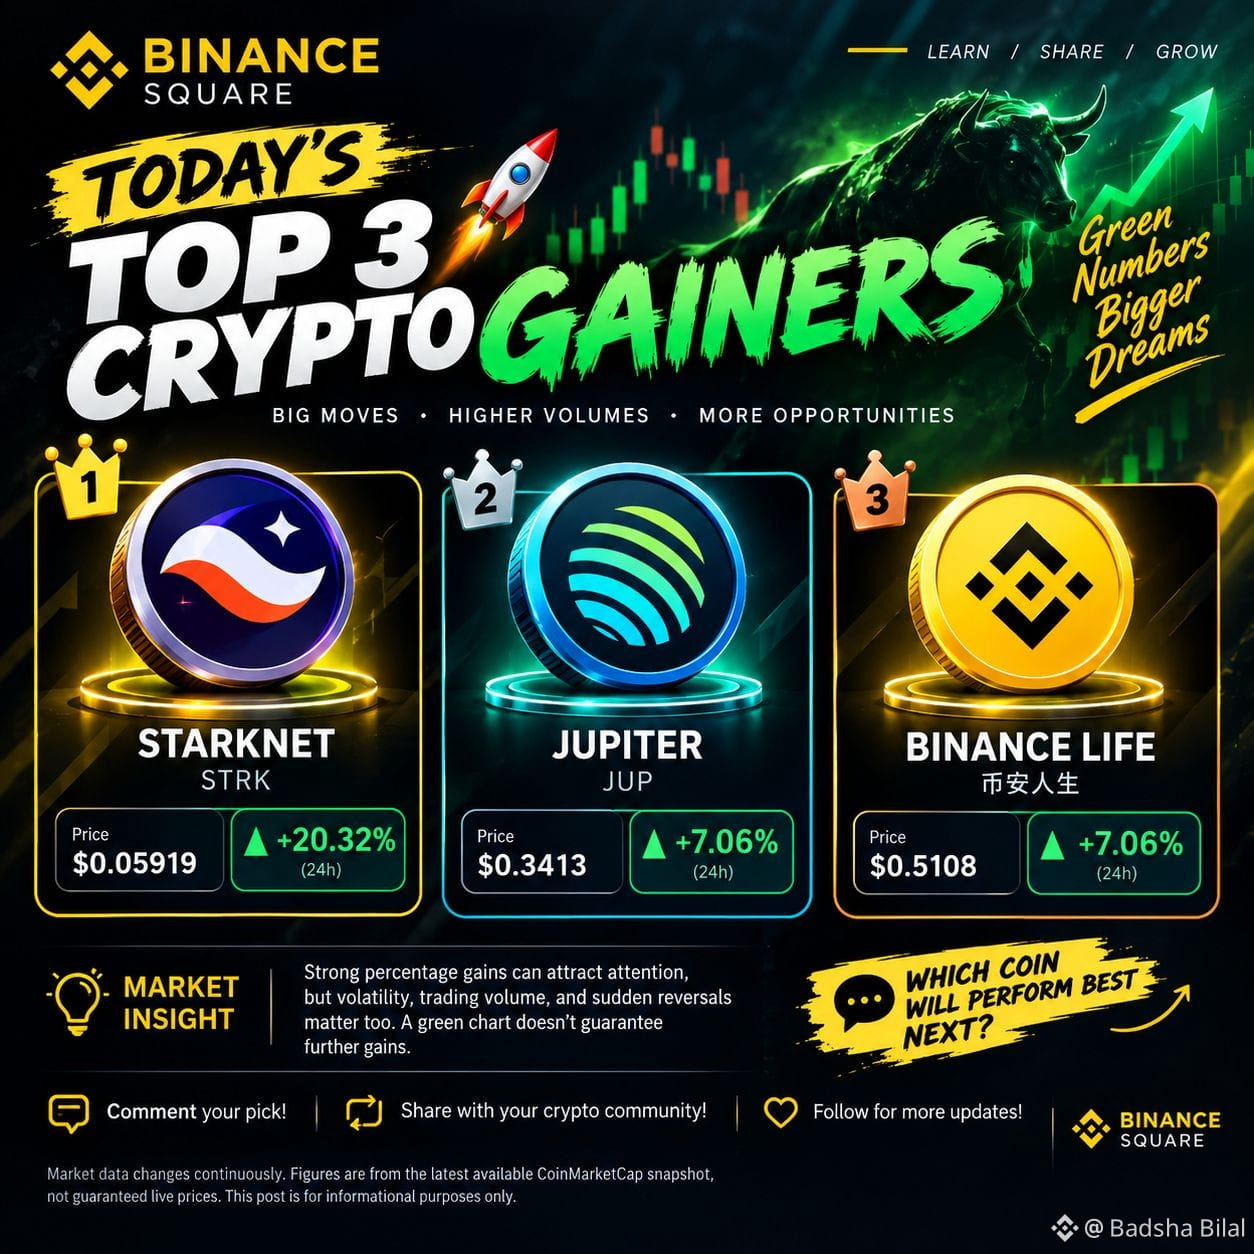
🚀 TODAY’S TOP 3 CRYPTO GAINERS 📈
🔥 Which Crypto Is Leading the Market Today?
The crypto market is moving fast! 👀 Here are 3 cryptocurrencies showing positive momentum in CoinMarketCap’s latest 24-hour snapshot:
🥇 1. Starknet ($STRK )
💰 Price: $0.05919
📈 24H Change: +20.32%
🥈 2. Jupiter ($JUP )
💰 Price: $0.3413
📈 24H Change: +7.06%
🥉 3. Binance Life ($币安人生
)
💰 Price: $0.5108
📈 24H Change: +7.06%
📊 MARKET INSIGHT:
Strong percentage gains can attract attention, but volatility, trading volume, and sudden reversals matter too. A green chart doesn't guarantee further gains.
🔥 YOUR TURN!
Which coin do you think will perform best over the next 24 hours? 👇
💬 Comment your pick!
🔁 Share this post with your crypto community.
❤️ Follow for more crypto market updates!
⚠️ Market data changes continuously. Figures are from the latest available CoinMarketCap snapshot, not guaranteed live prices. This post is for informational purposes only.
{future}(STRKUSDT)
{future}(JUPUSDT)
{spot}(币安人生USDT)
🚀 TODAY’S TOP 3 CRYPTO GAINERS 📈
🔥 Which Crypto Is Leading the Market Today?
The crypto market is moving fast! 👀 Here are 3 cryptocurrencies showing positive momentum in CoinMarketCap’s latest 24-hour snapshot:
🥇 1. Starknet ($STRK )
💰 Price: $0.05919
📈 24H Change: +20.32%
🥈 2. Jupiter ($JUP )
💰 Price: $0.3413
📈 24H Change: +7.06%
🥉 3. Binance Life ($币安人生
)
💰 Price: $0.5108
📈 24H Change: +7.06%
📊 MARKET INSIGHT:
Strong percentage gains can attract attention, but volatility, trading volume, and sudden reversals matter too. A green chart doesn't guarantee further gains.
🔥 YOUR TURN!
Which coin do you think will perform best over the next 24 hours? 👇
💬 Comment your pick!
🔁 Share this post with your crypto community.
❤️ Follow for more crypto market updates!
⚠️ Market data changes continuously. Figures are from the latest available CoinMarketCap snapshot, not guaranteed live prices. This post is for informational purposes only.
🔥 Which Crypto Is Leading the Market Today?
The crypto market is moving fast! 👀 Here are 3 cryptocurrencies showing positive momentum in CoinMarketCap’s latest 24-hour snapshot:
🥇 1. Starknet ($STRK )
💰 Price: $0.05919
📈 24H Change: +20.32%
🥈 2. Jupiter ($JUP )
💰 Price: $0.3413
📈 24H Change: +7.06%
🥉 3. Binance Life ($币安人生
)
💰 Price: $0.5108
📈 24H Change: +7.06%
📊 MARKET INSIGHT:
Strong percentage gains can attract attention, but volatility, trading volume, and sudden reversals matter too. A green chart doesn't guarantee further gains.
🔥 YOUR TURN!
Which coin do you think will perform best over the next 24 hours? 👇
💬 Comment your pick!
🔁 Share this post with your crypto community.
❤️ Follow for more crypto market updates!
⚠️ Market data changes continuously. Figures are from the latest available CoinMarketCap snapshot, not guaranteed live prices. This post is for informational purposes only.
725
·
--
Azalma
61
·
--
Məqalə
Tərcüməyə bax
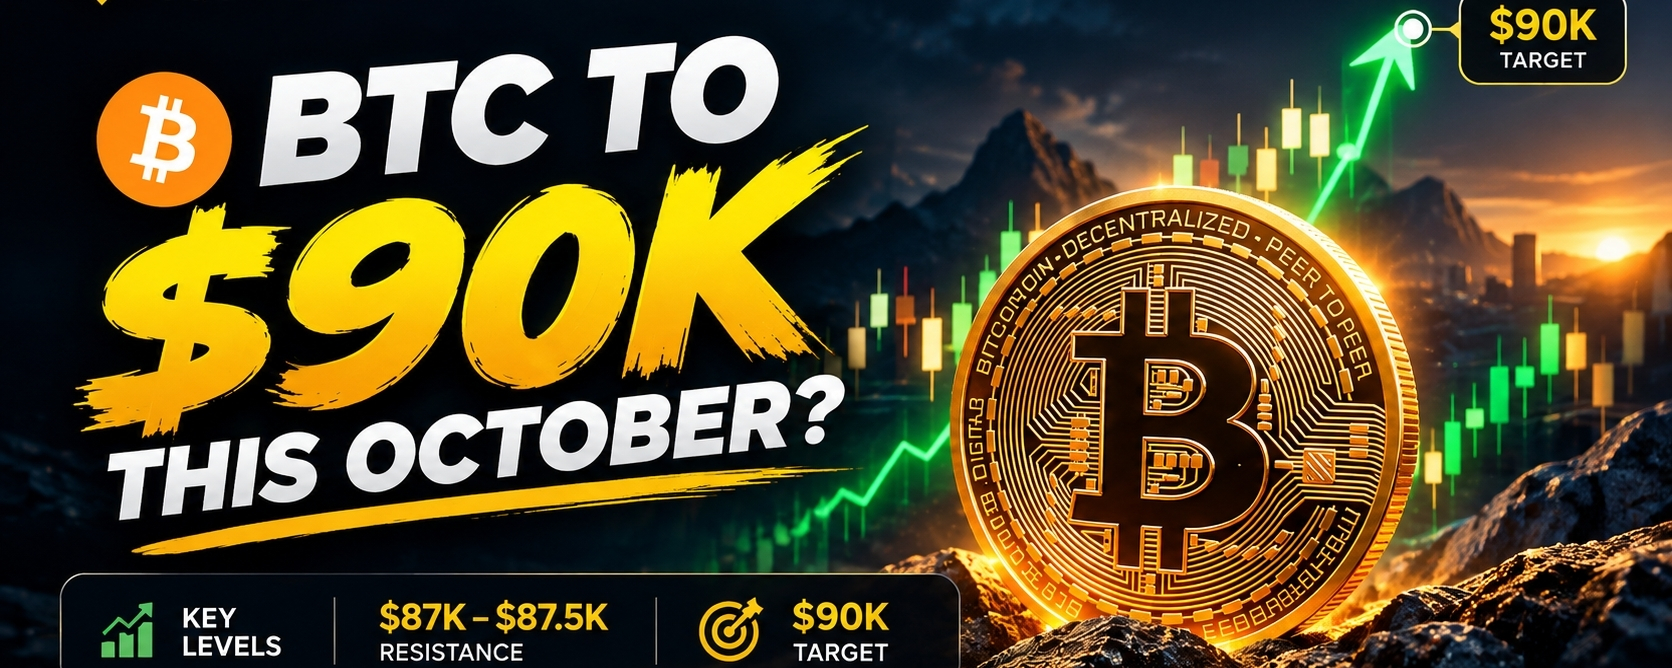
🚨 BTC TO $90K THIS OCTOBER?🚨 $BTC TO $90K THIS OCTOBER?$
Bitcoin is once again approaching a critical zone, and traders are watching one key question:
Can BTC reclaim $90,000 before October ends? 📈
🔑 Key Levels to Watch
🟢 $87K–$87.5K — Resistance
A strong breakout and hold above this zone could open the path toward $90K.
🎯 $90K — Major Target
BTC would need roughly a 7.9% move from ~$83.4K to reach $90K.
🔴 $83K — Key Support
Holding this level could keep the bullish recovery structure alive.
⚠️ $80.9K — Next Major Support
A break below $83K could increase downside pressure.
📊 My Take
$90K is achievable this October, but BTC needs confirmation above $87K–$87.5K first.
If bulls regain control and momentum strengthens, $90K could become the next major psychological target. 🚀
But remember: crypto moves fast. This is market analysis, not financial advice. Always DYOR.
Will BTC hit $90K this October? 👇
{spot}(BTCUSDT)
🚨 BTC TO $90K THIS OCTOBER?
🚨 $BTC TO $90K THIS OCTOBER?$
Bitcoin is once again approaching a critical zone, and traders are watching one key question:
Can BTC reclaim $90,000 before October ends? 📈
🔑 Key Levels to Watch
🟢 $87K–$87.5K — Resistance
A strong breakout and hold above this zone could open the path toward $90K.
🎯 $90K — Major Target
BTC would need roughly a 7.9% move from ~$83.4K to reach $90K.
🔴 $83K — Key Support
Holding this level could keep the bullish recovery structure alive.
⚠️ $80.9K — Next Major Support
A break below $83K could increase downside pressure.
📊 My Take
$90K is achievable this October, but BTC needs confirmation above $87K–$87.5K first.
If bulls regain control and momentum strengthens, $90K could become the next major psychological target. 🚀
But remember: crypto moves fast. This is market analysis, not financial advice. Always DYOR.
Will BTC hit $90K this October? 👇
Bitcoin is once again approaching a critical zone, and traders are watching one key question:
Can BTC reclaim $90,000 before October ends? 📈
🔑 Key Levels to Watch
🟢 $87K–$87.5K — Resistance
A strong breakout and hold above this zone could open the path toward $90K.
🎯 $90K — Major Target
BTC would need roughly a 7.9% move from ~$83.4K to reach $90K.
🔴 $83K — Key Support
Holding this level could keep the bullish recovery structure alive.
⚠️ $80.9K — Next Major Support
A break below $83K could increase downside pressure.
📊 My Take
$90K is achievable this October, but BTC needs confirmation above $87K–$87.5K first.
If bulls regain control and momentum strengthens, $90K could become the next major psychological target. 🚀
But remember: crypto moves fast. This is market analysis, not financial advice. Always DYOR.
Will BTC hit $90K this October? 👇
86
·
--
Artım
Tərcüməyə bax
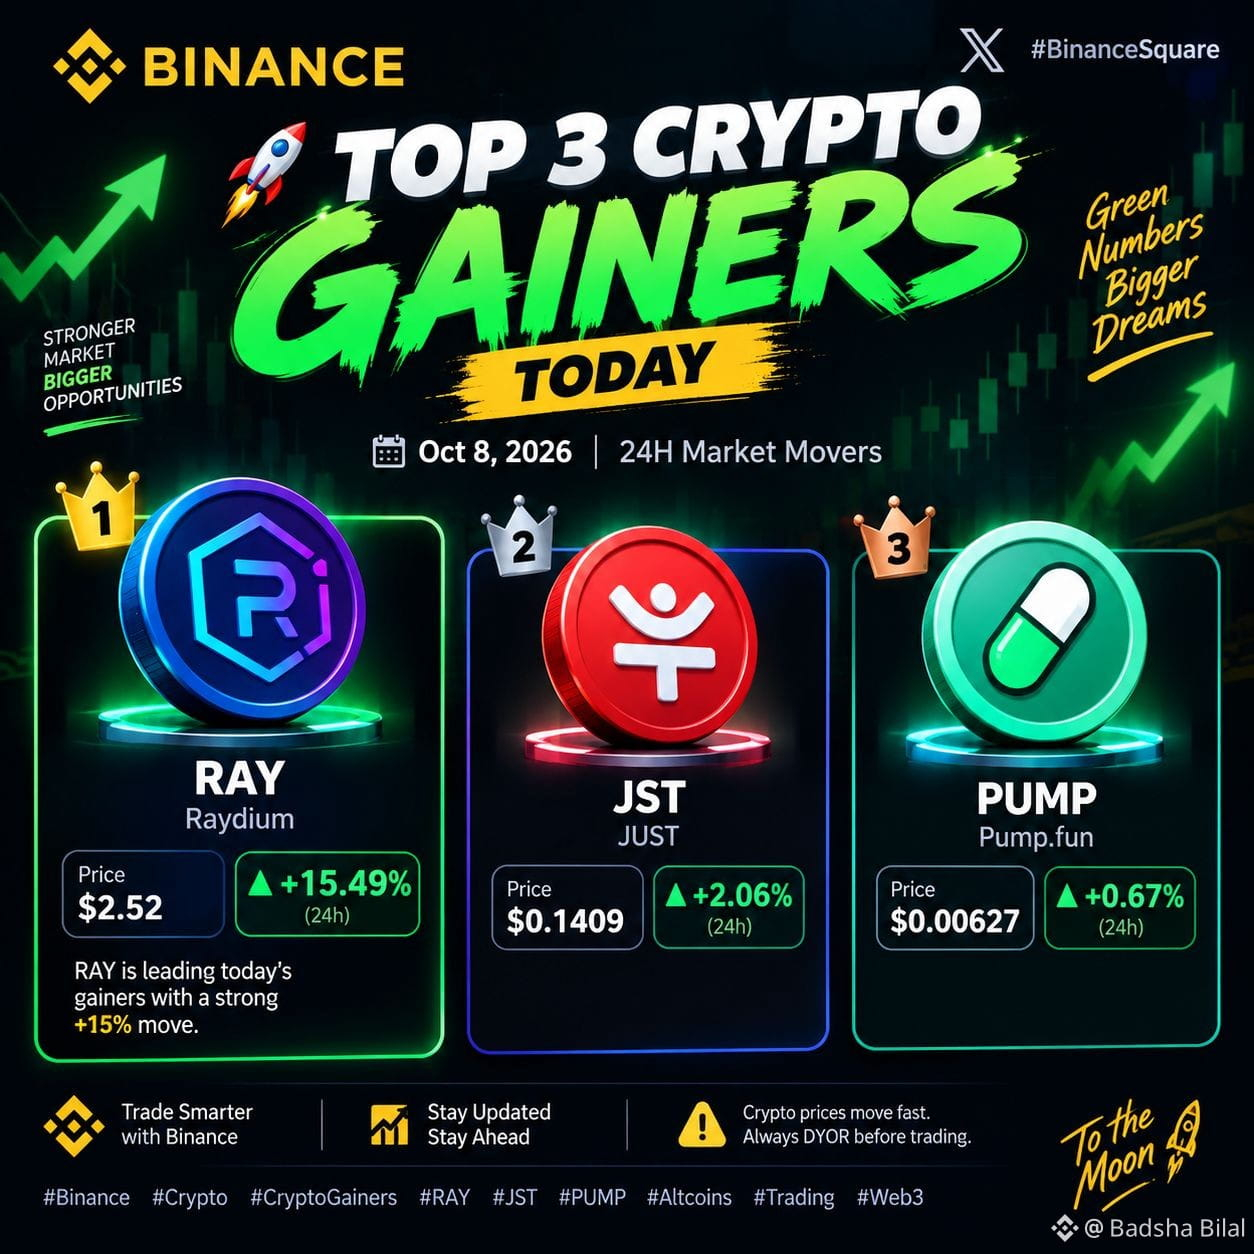
🚀 TODAY'S TOP 3 CRYPTO GAINERS
📈 24H Market Movers — Oct 8, 2026
🥇 $RAY — Raydium
🟢 +15.49%
💰 Price: ~$2.52
🥈 $JST — JUST
🟢 +2.06%
💰 Price: ~$0.1409
🥉 $PUMP — Pump.fun
🟢 +0.67%
💰 Price: ~$0.00627
🔥 RAY is leading today's gainers with a strong +15% move.
⚠️ Crypto prices move fast. Always DYOR before trading.
{spot}(RAYUSDT)
{spot}(JSTUSDT)
{spot}(PUMPUSDT)
#GAINERS
🚀 TODAY'S TOP 3 CRYPTO GAINERS
📈 24H Market Movers — Oct 8, 2026
🥇 $RAY — Raydium
🟢 +15.49%
💰 Price: ~$2.52
🥈 $JST — JUST
🟢 +2.06%
💰 Price: ~$0.1409
🥉 $PUMP — Pump.fun
🟢 +0.67%
💰 Price: ~$0.00627
🔥 RAY is leading today's gainers with a strong +15% move.
⚠️ Crypto prices move fast. Always DYOR before trading.
#GAINERS
📈 24H Market Movers — Oct 8, 2026
🥇 $RAY — Raydium
🟢 +15.49%
💰 Price: ~$2.52
🥈 $JST — JUST
🟢 +2.06%
💰 Price: ~$0.1409
🥉 $PUMP — Pump.fun
🟢 +0.67%
💰 Price: ~$0.00627
🔥 RAY is leading today's gainers with a strong +15% move.
⚠️ Crypto prices move fast. Always DYOR before trading.
#GAINERS
1
481
·
--
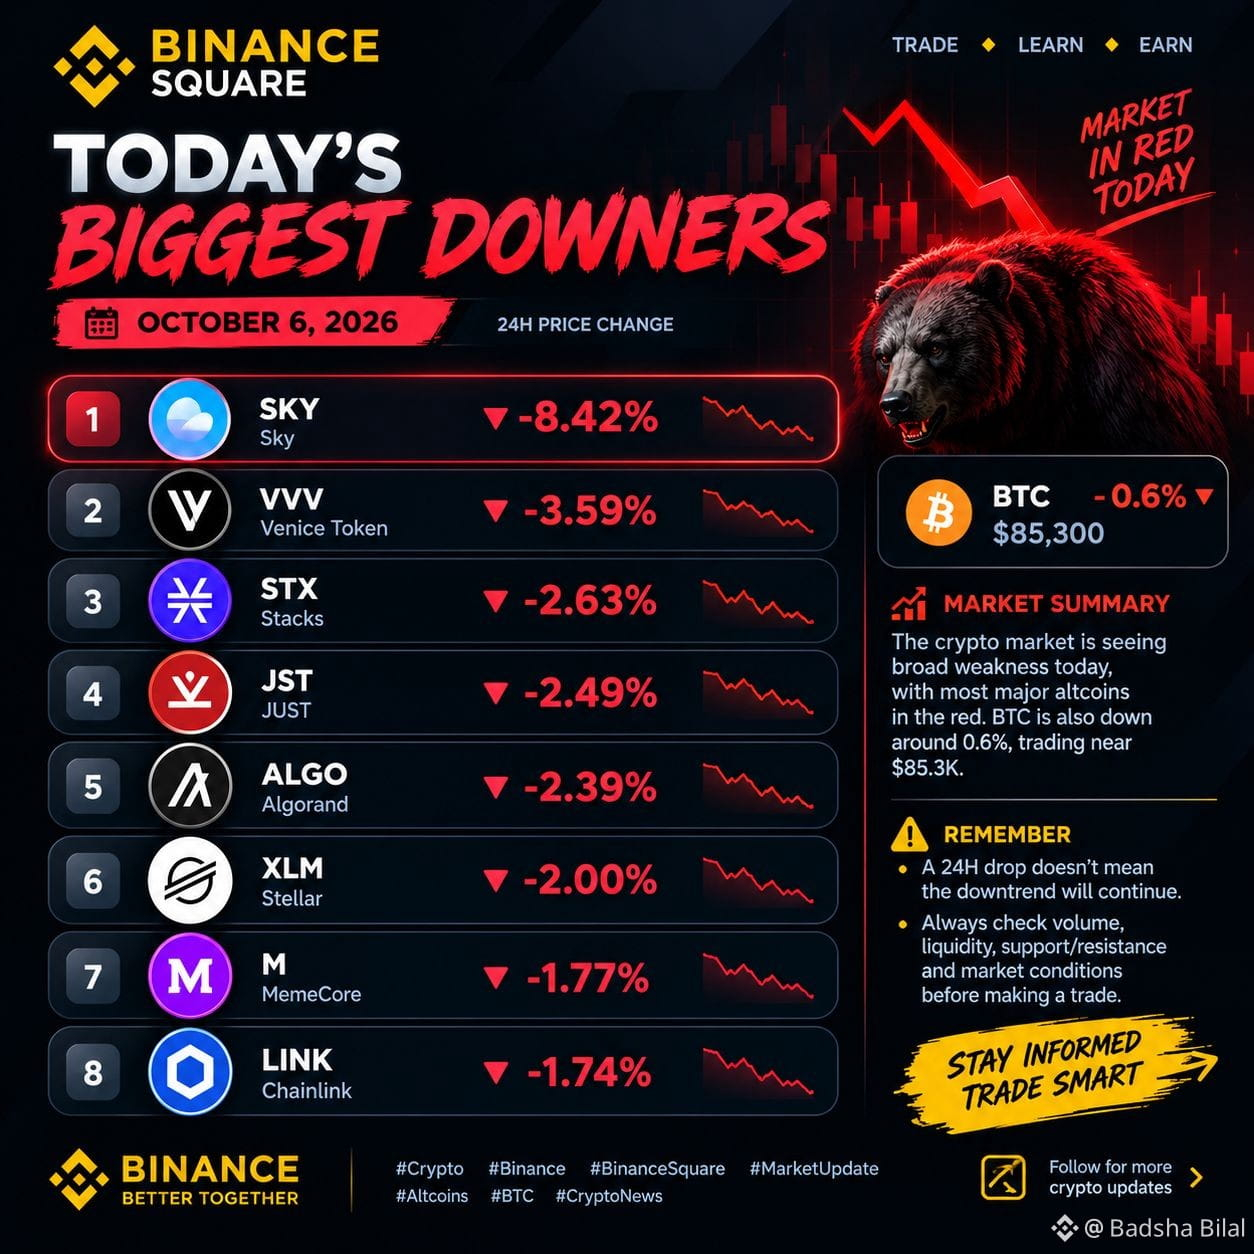
📉 Kriptovalyuta bazarının icmalı — 6 oktyabr 2026
Bu gün bazarda zəiflik müşahidə olunur və bir neçə altkoin qırmızı zonada ticarət edilir.
🔴 Son 24 saatın ən çox ucuzlaşanları: • $SKY —8.42% • $VVV — -3.59% • $STX — -2.63% • JST — -2.49% • ALGO — -2.39% • XLM — -2.00% • M — -1.77% • LINK — -1.74%
⚠️ Son 24 saat ərzində qiymətin düşməsi eniş trendinin mütləq davam edəcəyi demək deyil. Hər hansı ticarət qərarı verməzdən əvvəl həcmə, likvidliyə, dəstək/müqavimət səviyyələrinə və BTC-nin istiqamətinə diqqət yetirin.
📊 Məlumatlı olun. Ağıllı ticarət edin.
#Crypto #BinanceSquare #CryptoMarket #CryptoGainers #CryptoLosers #BTC #Altcoins #Trading
{spot}(SKYUSDT)
{future}(VVVUSDT)
{future}(STXUSDT)
📉 Kriptovalyuta bazarının icmalı — 6 oktyabr 2026
Bu gün bazarda zəiflik müşahidə olunur və bir neçə altkoin qırmızı zonada ticarət edilir.
🔴 Son 24 saatın ən çox ucuzlaşanları: • $SKY —8.42% • $VVV — -3.59% • $STX — -2.63% • JST — -2.49% • ALGO — -2.39% • XLM — -2.00% • M — -1.77% • LINK — -1.74%
⚠️ Son 24 saat ərzində qiymətin düşməsi eniş trendinin mütləq davam edəcəyi demək deyil. Hər hansı ticarət qərarı verməzdən əvvəl həcmə, likvidliyə, dəstək/müqavimət səviyyələrinə və BTC-nin istiqamətinə diqqət yetirin.
📊 Məlumatlı olun. Ağıllı ticarət edin.
#Crypto #BinanceSquare #CryptoMarket #CryptoGainers #CryptoLosers #BTC #Altcoins #Trading
Bu gün bazarda zəiflik müşahidə olunur və bir neçə altkoin qırmızı zonada ticarət edilir.
🔴 Son 24 saatın ən çox ucuzlaşanları: • $SKY —8.42% • $VVV — -3.59% • $STX — -2.63% • JST — -2.49% • ALGO — -2.39% • XLM — -2.00% • M — -1.77% • LINK — -1.74%
⚠️ Son 24 saat ərzində qiymətin düşməsi eniş trendinin mütləq davam edəcəyi demək deyil. Hər hansı ticarət qərarı verməzdən əvvəl həcmə, likvidliyə, dəstək/müqavimət səviyyələrinə və BTC-nin istiqamətinə diqqət yetirin.
📊 Məlumatlı olun. Ağıllı ticarət edin.
#Crypto #BinanceSquare #CryptoMarket #CryptoGainers #CryptoLosers #BTC #Altcoins #Trading
1
771
·
--
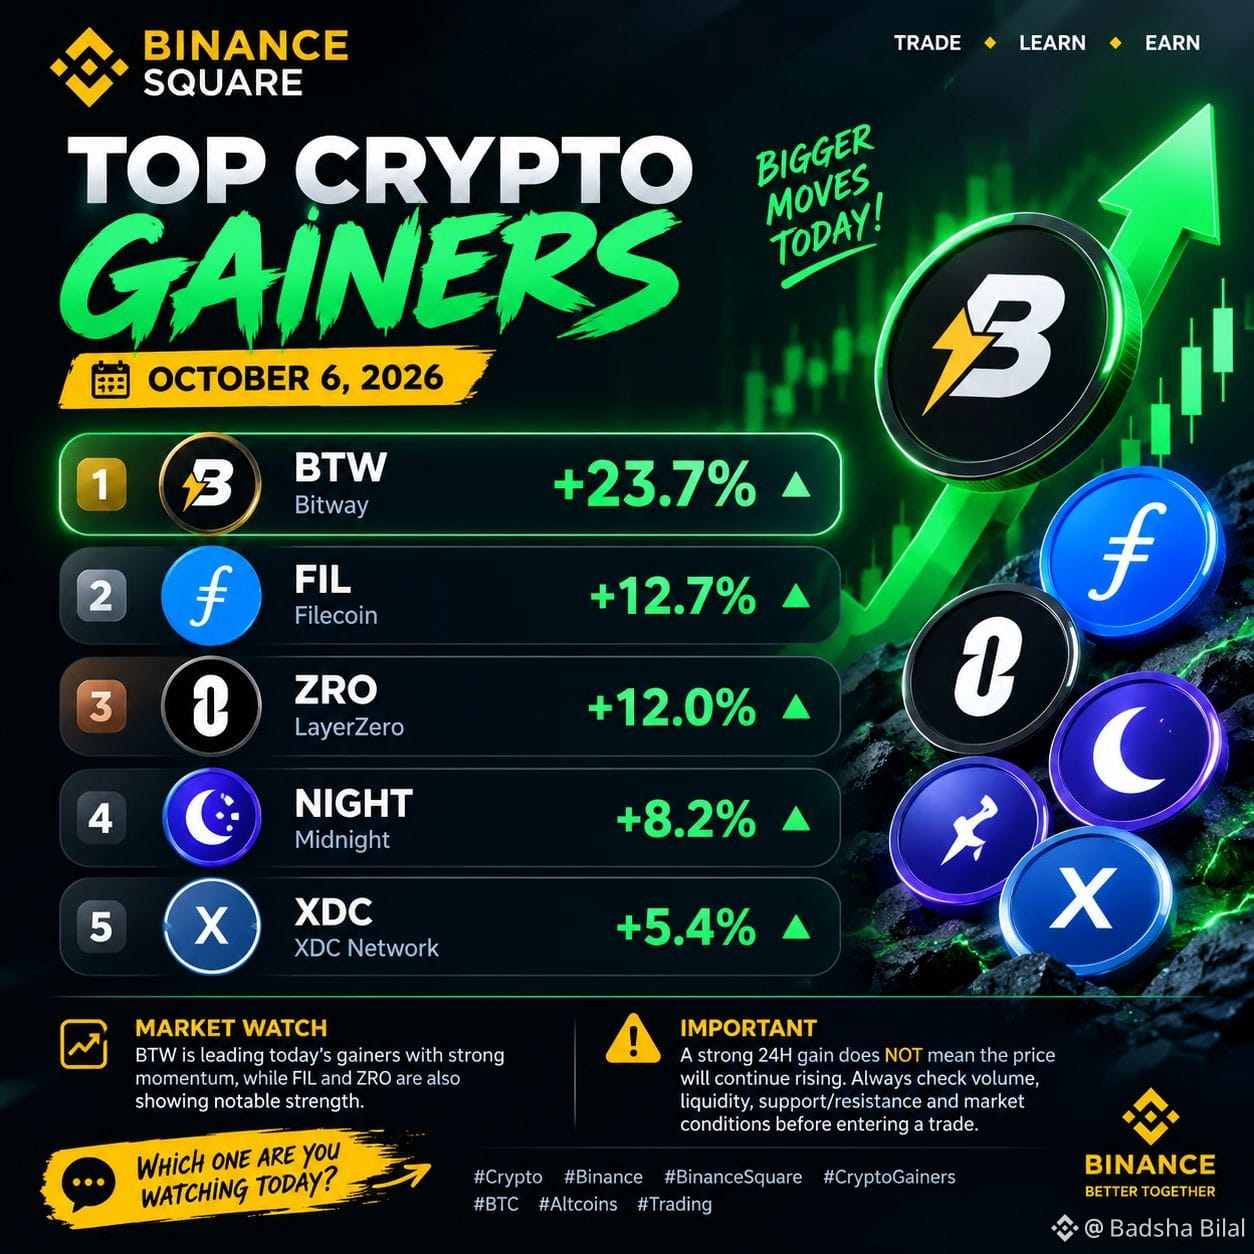
🚀 OKTYABRIN 6-SI, 2026 — ƏN ÇOX QAZANC GƏTİRƏN KRİPTOVALYUTALAR
🔥 $BTW — +23.7%
🔥 $FIL — +12.7%
🔥 $ZRO — +12.0%
⚡ NIGHT — +8.2%
⚡ XDC — +5.4%
📊 Bazara nəzər:
BTW bu gün güclü dinamika ilə ən çox yüksələnlər sırasına başçılıq edir. FIL və ZRO da nəzərəçarpan güc nümayiş etdirir.
⚠️ Vacib: 24 saat ərzində güclü artım qiymətin yüksəlməyə davam edəcəyi demək DEYİL. Əməliyyata başlamazdan əvvəl həmişə ticarət həcmini, likvidliyi, dəstək/müqavimət səviyyələrini və bazar şəraitini yoxlayın.
💡 Bu gün hansını izləyirsiniz?
#Crypto_Jobs🎯 üçün #Binance #BinanceSquare #CryptoGainers #btc70k TC #BinanceLaunchesBinanceIntelligence Altcoins #BinanceLaunchesBinanceIntelligence Trading
{future}(BTWUSDT)
{spot}(FILUSDT)
{spot}(ZROUSDT)
🚀 OKTYABRIN 6-SI, 2026 — ƏN ÇOX QAZANC GƏTİRƏN KRİPTOVALYUTALAR
🔥 $BTW — +23.7%
🔥 $FIL — +12.7%
🔥 $ZRO — +12.0%
⚡ NIGHT — +8.2%
⚡ XDC — +5.4%
📊 Bazara nəzər:
BTW bu gün güclü dinamika ilə ən çox yüksələnlər sırasına başçılıq edir. FIL və ZRO da nəzərəçarpan güc nümayiş etdirir.
⚠️ Vacib: 24 saat ərzində güclü artım qiymətin yüksəlməyə davam edəcəyi demək DEYİL. Əməliyyata başlamazdan əvvəl həmişə ticarət həcmini, likvidliyi, dəstək/müqavimət səviyyələrini və bazar şəraitini yoxlayın.
💡 Bu gün hansını izləyirsiniz?
#Crypto_Jobs🎯 üçün #Binance #BinanceSquare #CryptoGainers #btc70k TC #BinanceLaunchesBinanceIntelligence Altcoins #BinanceLaunchesBinanceIntelligence Trading
🔥 $BTW — +23.7%
🔥 $FIL — +12.7%
🔥 $ZRO — +12.0%
⚡ NIGHT — +8.2%
⚡ XDC — +5.4%
📊 Bazara nəzər:
BTW bu gün güclü dinamika ilə ən çox yüksələnlər sırasına başçılıq edir. FIL və ZRO da nəzərəçarpan güc nümayiş etdirir.
⚠️ Vacib: 24 saat ərzində güclü artım qiymətin yüksəlməyə davam edəcəyi demək DEYİL. Əməliyyata başlamazdan əvvəl həmişə ticarət həcmini, likvidliyi, dəstək/müqavimət səviyyələrini və bazar şəraitini yoxlayın.
💡 Bu gün hansını izləyirsiniz?
#Crypto_Jobs🎯 üçün #Binance #BinanceSquare #CryptoGainers #btc70k TC #BinanceLaunchesBinanceIntelligence Altcoins #BinanceLaunchesBinanceIntelligence Trading
1
1.3k
·
--
Tərcüməyə bax
🚨 Major Security & Hacks
· Bitget Hack Tracing via AI: Chainalysis used AI to trace the $387M Bitget hack across four blockchains in under 10 minutes, linking it to North Korean actors.
· Zano Chain Rollback: The Zano team executed a month-long chain rollback after an attacker exploited a Gateway Address flaw to mint 36.9 million unauthorized ZANO.
· NEAR Intents Exploit: The protocol restored services after a $3.8M exploit. Notably, the hacker sent 1 BNB to a recovery wallet and offered to cooperate.
⚙️ Protocol & Network Updates
· Ethereum Glamsterdam Test: The Glamsterdam upgrade's first public test is scheduled for the Sepolia testnet today (Oct. 6), though devs warn "fake" builders could stall it.
· Zcash NU7 Testnet: The Zcash NU7 upgrade, which cuts block times to 25 seconds, is hitting its testnet today before a planned mainnet activation.
· Solana Alpenglow: Solana's 150-millisecond settlement upgrade has reached its second public test network.
📈 Market & Regulatory
· Market Rally: Bitcoin is consolidating near $84,000 as altcoins (like Quant, up 39%) rally broadly.
· Bitcoin ETF Reversal: Bitcoin ETF flows have turned positive for 2026, erasing a previous $5.8 billion deficit.
· Stablecoin Freezes: Circle and Tether froze roughly $318,000 linked to the Bitget hack.
$BTC
{future}(BTCUSDT)
$ETH
{future}(ETHUSDT)
$XAUT
{future}(XAUTUSDT)
🚨 Major Security & Hacks
· Bitget Hack Tracing via AI: Chainalysis used AI to trace the $387M Bitget hack across four blockchains in under 10 minutes, linking it to North Korean actors.
· Zano Chain Rollback: The Zano team executed a month-long chain rollback after an attacker exploited a Gateway Address flaw to mint 36.9 million unauthorized ZANO.
· NEAR Intents Exploit: The protocol restored services after a $3.8M exploit. Notably, the hacker sent 1 BNB to a recovery wallet and offered to cooperate.
⚙️ Protocol & Network Updates
· Ethereum Glamsterdam Test: The Glamsterdam upgrade's first public test is scheduled for the Sepolia testnet today (Oct. 6), though devs warn "fake" builders could stall it.
· Zcash NU7 Testnet: The Zcash NU7 upgrade, which cuts block times to 25 seconds, is hitting its testnet today before a planned mainnet activation.
· Solana Alpenglow: Solana's 150-millisecond settlement upgrade has reached its second public test network.
📈 Market & Regulatory
· Market Rally: Bitcoin is consolidating near $84,000 as altcoins (like Quant, up 39%) rally broadly.
· Bitcoin ETF Reversal: Bitcoin ETF flows have turned positive for 2026, erasing a previous $5.8 billion deficit.
· Stablecoin Freezes: Circle and Tether froze roughly $318,000 linked to the Bitget hack.
$BTC
$ETH
$XAUT
· Bitget Hack Tracing via AI: Chainalysis used AI to trace the $387M Bitget hack across four blockchains in under 10 minutes, linking it to North Korean actors.
· Zano Chain Rollback: The Zano team executed a month-long chain rollback after an attacker exploited a Gateway Address flaw to mint 36.9 million unauthorized ZANO.
· NEAR Intents Exploit: The protocol restored services after a $3.8M exploit. Notably, the hacker sent 1 BNB to a recovery wallet and offered to cooperate.
⚙️ Protocol & Network Updates
· Ethereum Glamsterdam Test: The Glamsterdam upgrade's first public test is scheduled for the Sepolia testnet today (Oct. 6), though devs warn "fake" builders could stall it.
· Zcash NU7 Testnet: The Zcash NU7 upgrade, which cuts block times to 25 seconds, is hitting its testnet today before a planned mainnet activation.
· Solana Alpenglow: Solana's 150-millisecond settlement upgrade has reached its second public test network.
📈 Market & Regulatory
· Market Rally: Bitcoin is consolidating near $84,000 as altcoins (like Quant, up 39%) rally broadly.
· Bitcoin ETF Reversal: Bitcoin ETF flows have turned positive for 2026, erasing a previous $5.8 billion deficit.
· Stablecoin Freezes: Circle and Tether froze roughly $318,000 linked to the Bitget hack.
$BTC
$ETH
$XAUT
1
126
·
--
Tərcüməyə bax
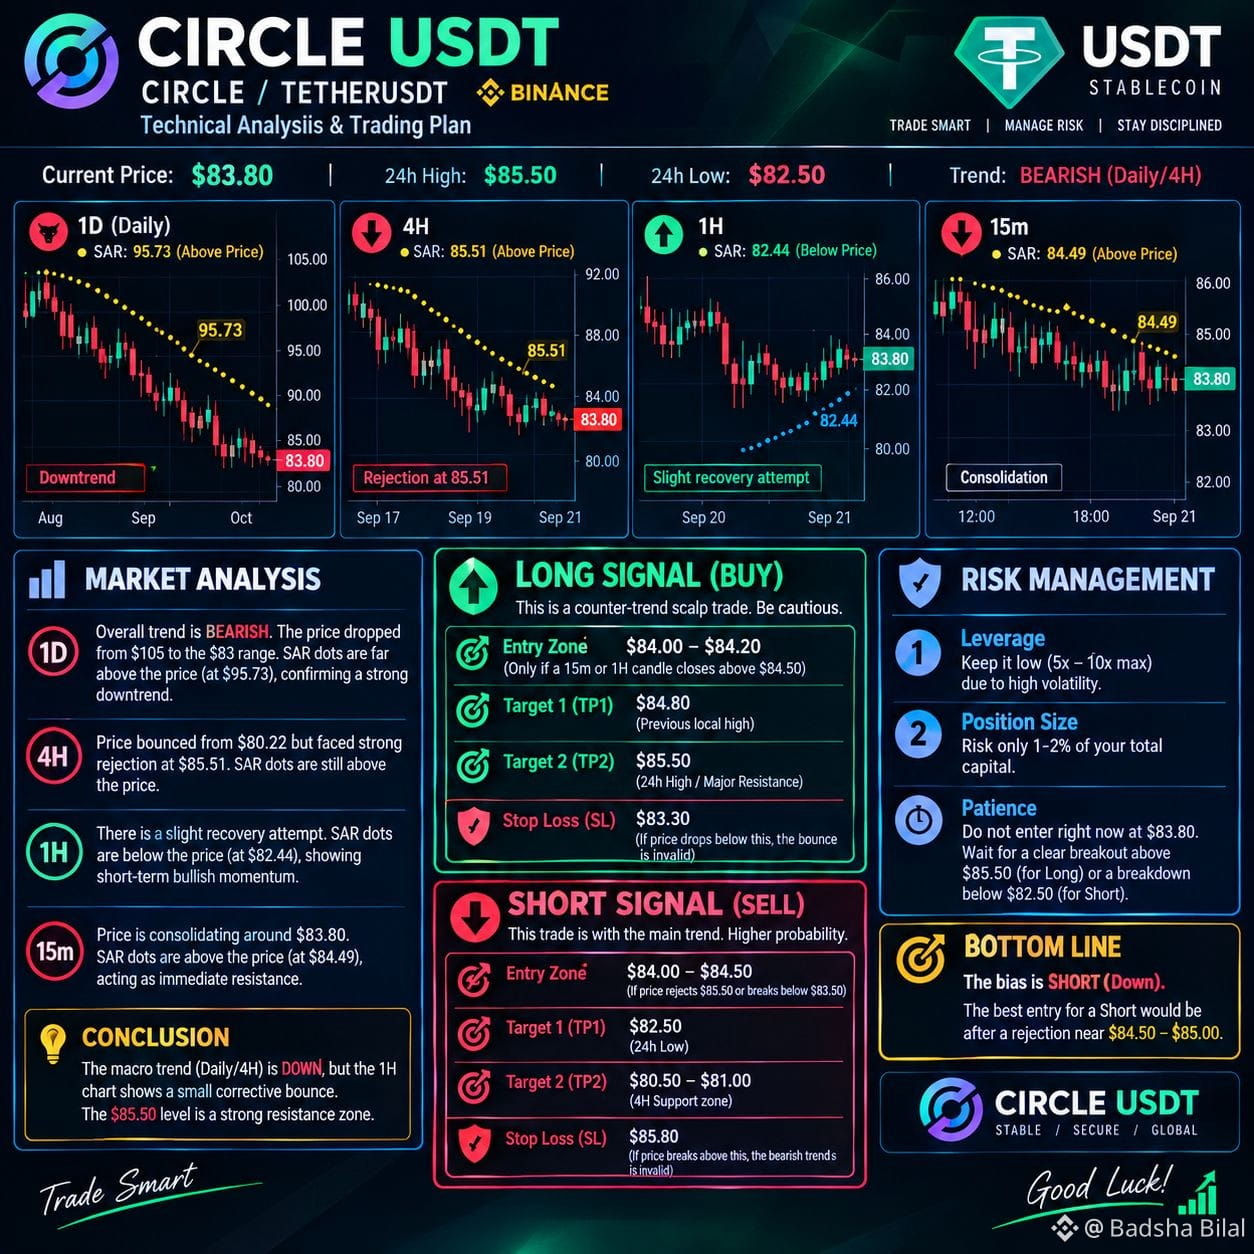
$CRCL 📉 Market Analysis:
1. 1D (Daily) Chart: The overall trend is Bearish. The price dropped from $105 to the $83 range. The SAR dots are far above the price (at $95.73), confirming a strong downtrend.
2. 4H Chart: The price bounced from $80.22 but faced strong rejection at $85.51. The SAR dots are still above the price.
3. 1H Chart: There is a slight recovery attempt. The SAR dots are below the price (at $82.44), showing short-term bullish momentum.
4. 15m Chart: The price is consolidating around $83.80. The SAR dots are above the price (at $84.49), acting as immediate resistance.
Conclusion: The macro trend (Daily/4H) is DOWN, but the 1H chart shows a small corrective bounce. The $85.50 level is a strong resistance zone.
---
🟢 LONG Signal (Buy)
This is a counter-trend scalp trade. Be cautious.
· Entry Zone: $84.00 – $84.20 (Only if a 15m or 1H candle closes firmly above $84.50).
· Target 1 (TP1): $84.80 (Previous local high).
· Target 2 (TP2): $85.50 (24h High / Major Resistance).
· Stop Loss (SL): $83.30 (If price drops below this, the bounce is invalid).
---
🔴 SHORT Signal (Sell)
This trade is with the main trend. Higher probability.
· Entry Zone: $84.00 – $84.50 (If the price rejects the $85.50 zone and starts dropping, or if it breaks below $83.50 now).
· Target 1 (TP1): $82.50 (24h Low).
· Target 2 (TP2): $80.50 – $81.00 (4H Support zone).
· Stop Loss (SL): $85.80 (If price breaks above this, the bearish trend is invalid).
---
⚠️ Risk Management:
1. Leverage: Keep it low (5x-10x max) due to high volatility.
2. Position Size: Risk only 1-2% of your total capital.
3. Patience: Do not enter right now at $83.80. **Wait** for a clear breakout above $85.50 (for Long) or a breakdown below $82.50 (for Short).
Bottom Line: The bias is SHORT (Down). The best entry for a Short would be after a rejection near $84.50-$85.0
{future}(CRCLUSDT)
$CRCL 📉 Market Analysis:
1. 1D (Daily) Chart: The overall trend is Bearish. The price dropped from $105 to the $83 range. The SAR dots are far above the price (at $95.73), confirming a strong downtrend.
2. 4H Chart: The price bounced from $80.22 but faced strong rejection at $85.51. The SAR dots are still above the price.
3. 1H Chart: There is a slight recovery attempt. The SAR dots are below the price (at $82.44), showing short-term bullish momentum.
4. 15m Chart: The price is consolidating around $83.80. The SAR dots are above the price (at $84.49), acting as immediate resistance.
Conclusion: The macro trend (Daily/4H) is DOWN, but the 1H chart shows a small corrective bounce. The $85.50 level is a strong resistance zone.
---
🟢 LONG Signal (Buy)
This is a counter-trend scalp trade. Be cautious.
· Entry Zone: $84.00 – $84.20 (Only if a 15m or 1H candle closes firmly above $84.50).
· Target 1 (TP1): $84.80 (Previous local high).
· Target 2 (TP2): $85.50 (24h High / Major Resistance).
· Stop Loss (SL): $83.30 (If price drops below this, the bounce is invalid).
---
🔴 SHORT Signal (Sell)
This trade is with the main trend. Higher probability.
· Entry Zone: $84.00 – $84.50 (If the price rejects the $85.50 zone and starts dropping, or if it breaks below $83.50 now).
· Target 1 (TP1): $82.50 (24h Low).
· Target 2 (TP2): $80.50 – $81.00 (4H Support zone).
· Stop Loss (SL): $85.80 (If price breaks above this, the bearish trend is invalid).
---
⚠️ Risk Management:
1. Leverage: Keep it low (5x-10x max) due to high volatility.
2. Position Size: Risk only 1-2% of your total capital.
3. Patience: Do not enter right now at $83.80. **Wait** for a clear breakout above $85.50 (for Long) or a breakdown below $82.50 (for Short).
Bottom Line: The bias is SHORT (Down). The best entry for a Short would be after a rejection near $84.50-$85.0
1. 1D (Daily) Chart: The overall trend is Bearish. The price dropped from $105 to the $83 range. The SAR dots are far above the price (at $95.73), confirming a strong downtrend.
2. 4H Chart: The price bounced from $80.22 but faced strong rejection at $85.51. The SAR dots are still above the price.
3. 1H Chart: There is a slight recovery attempt. The SAR dots are below the price (at $82.44), showing short-term bullish momentum.
4. 15m Chart: The price is consolidating around $83.80. The SAR dots are above the price (at $84.49), acting as immediate resistance.
Conclusion: The macro trend (Daily/4H) is DOWN, but the 1H chart shows a small corrective bounce. The $85.50 level is a strong resistance zone.
---
🟢 LONG Signal (Buy)
This is a counter-trend scalp trade. Be cautious.
· Entry Zone: $84.00 – $84.20 (Only if a 15m or 1H candle closes firmly above $84.50).
· Target 1 (TP1): $84.80 (Previous local high).
· Target 2 (TP2): $85.50 (24h High / Major Resistance).
· Stop Loss (SL): $83.30 (If price drops below this, the bounce is invalid).
---
🔴 SHORT Signal (Sell)
This trade is with the main trend. Higher probability.
· Entry Zone: $84.00 – $84.50 (If the price rejects the $85.50 zone and starts dropping, or if it breaks below $83.50 now).
· Target 1 (TP1): $82.50 (24h Low).
· Target 2 (TP2): $80.50 – $81.00 (4H Support zone).
· Stop Loss (SL): $85.80 (If price breaks above this, the bearish trend is invalid).
---
⚠️ Risk Management:
1. Leverage: Keep it low (5x-10x max) due to high volatility.
2. Position Size: Risk only 1-2% of your total capital.
3. Patience: Do not enter right now at $83.80. **Wait** for a clear breakout above $85.50 (for Long) or a breakdown below $82.50 (for Short).
Bottom Line: The bias is SHORT (Down). The best entry for a Short would be after a rejection near $84.50-$85.0
1
417
·
--
Tərcüməyə bax
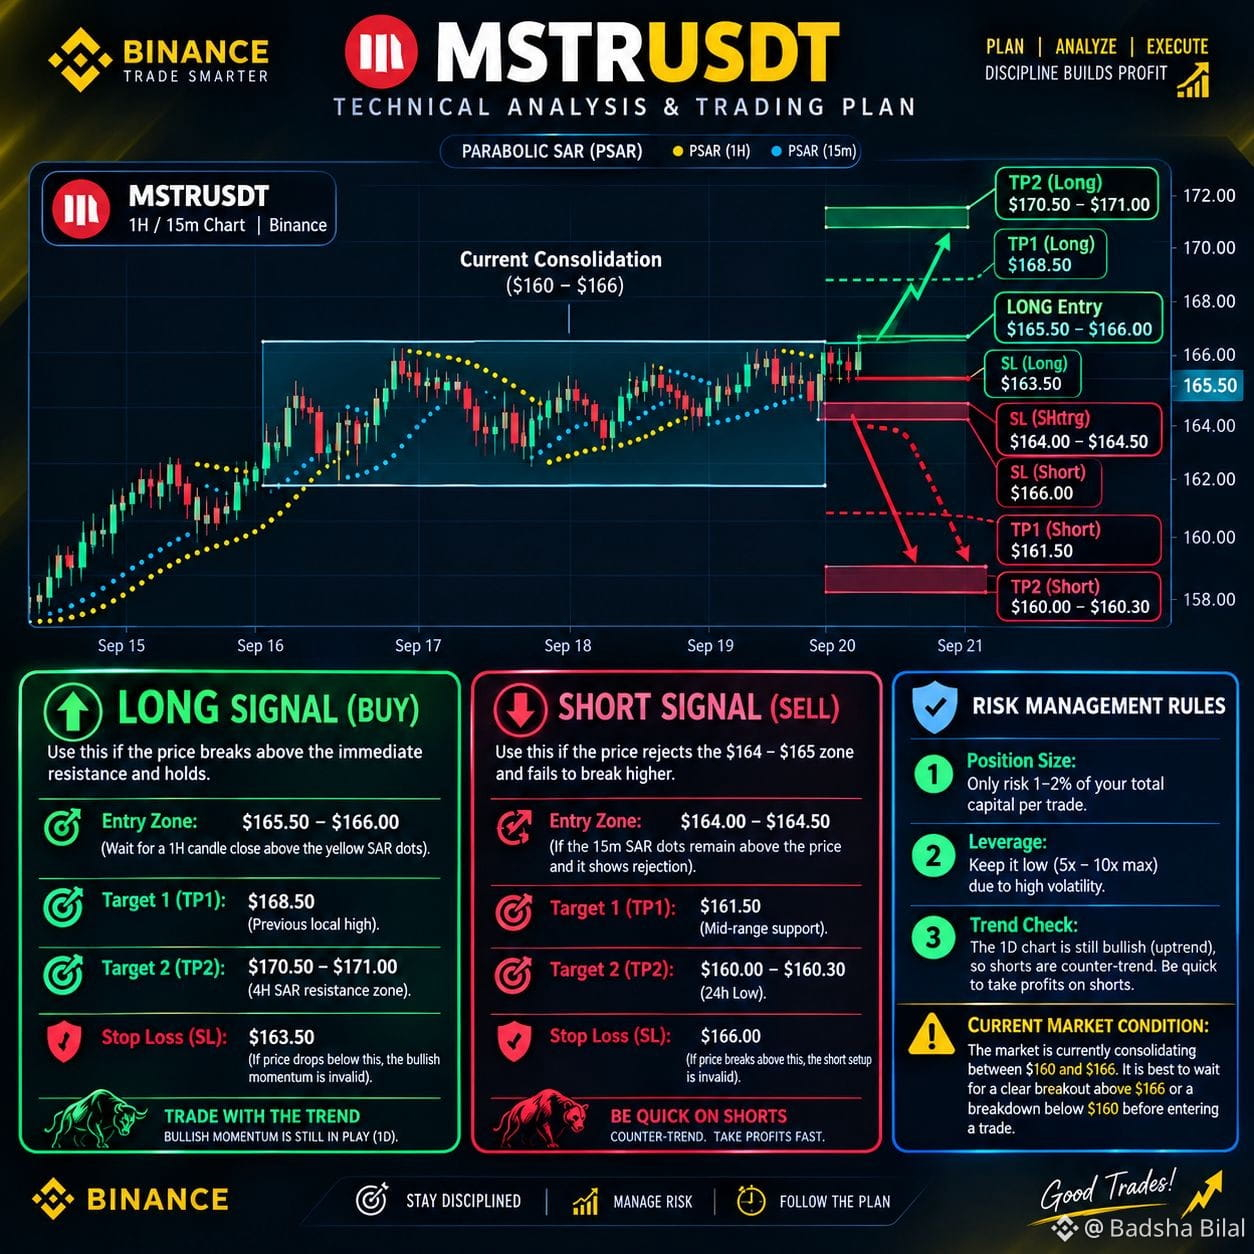
$MSTR 🟢 LONG Signal (Buy)
Use this if the price breaks above the immediate resistance and holds.
· Entry Zone: $165.50 – $166.00 (Wait for a 1H candle close above the yellow SAR dots).
· Target 1 (TP1): $168.50 (Previous local high).
· Target 2 (TP2): $170.50 – $171.00 (4H SAR resistance zone).
· Stop Loss (SL): $163.50 (If price drops below this, the bullish momentum is invalid).
---
🔴 SHORT Signal (Sell)
Use this if the price rejects the $164-$165 zone and fails to break higher.
· Entry Zone: $164.00 – $164.50 (If the 15m SAR dots remain above the price and it shows rejection).
· Target 1 (TP1): $161.50 (Mid-range support).
· Target 2 (TP2): $160.00 – $160.30 (24h Low).
· Stop Loss (SL): $166.00 (If price breaks above this, the short setup is invalid).
---
⚠️ Risk Management Rules:
1. Position Size: Only risk 1-2% of your total capital per trade.
2. Leverage: Keep it low (5x-10x max) due to high volatility.
3. Trend Check: The 1D chart is still bullish (uptrend), so Shorts are counter-trend. Be quick to take profits on shorts.
Current Market Condition: The market is currently consolidating between $160 and $166. It is best to wait for a clear breakout above $166 or a breakdown below $160 before entering a trade.
{future}(MSTRUSDT)
$MSTR 🟢 LONG Signal (Buy)
Use this if the price breaks above the immediate resistance and holds.
· Entry Zone: $165.50 – $166.00 (Wait for a 1H candle close above the yellow SAR dots).
· Target 1 (TP1): $168.50 (Previous local high).
· Target 2 (TP2): $170.50 – $171.00 (4H SAR resistance zone).
· Stop Loss (SL): $163.50 (If price drops below this, the bullish momentum is invalid).
---
🔴 SHORT Signal (Sell)
Use this if the price rejects the $164-$165 zone and fails to break higher.
· Entry Zone: $164.00 – $164.50 (If the 15m SAR dots remain above the price and it shows rejection).
· Target 1 (TP1): $161.50 (Mid-range support).
· Target 2 (TP2): $160.00 – $160.30 (24h Low).
· Stop Loss (SL): $166.00 (If price breaks above this, the short setup is invalid).
---
⚠️ Risk Management Rules:
1. Position Size: Only risk 1-2% of your total capital per trade.
2. Leverage: Keep it low (5x-10x max) due to high volatility.
3. Trend Check: The 1D chart is still bullish (uptrend), so Shorts are counter-trend. Be quick to take profits on shorts.
Current Market Condition: The market is currently consolidating between $160 and $166. It is best to wait for a clear breakout above $166 or a breakdown below $160 before entering a trade.
Use this if the price breaks above the immediate resistance and holds.
· Entry Zone: $165.50 – $166.00 (Wait for a 1H candle close above the yellow SAR dots).
· Target 1 (TP1): $168.50 (Previous local high).
· Target 2 (TP2): $170.50 – $171.00 (4H SAR resistance zone).
· Stop Loss (SL): $163.50 (If price drops below this, the bullish momentum is invalid).
---
🔴 SHORT Signal (Sell)
Use this if the price rejects the $164-$165 zone and fails to break higher.
· Entry Zone: $164.00 – $164.50 (If the 15m SAR dots remain above the price and it shows rejection).
· Target 1 (TP1): $161.50 (Mid-range support).
· Target 2 (TP2): $160.00 – $160.30 (24h Low).
· Stop Loss (SL): $166.00 (If price breaks above this, the short setup is invalid).
---
⚠️ Risk Management Rules:
1. Position Size: Only risk 1-2% of your total capital per trade.
2. Leverage: Keep it low (5x-10x max) due to high volatility.
3. Trend Check: The 1D chart is still bullish (uptrend), so Shorts are counter-trend. Be quick to take profits on shorts.
Current Market Condition: The market is currently consolidating between $160 and $166. It is best to wait for a clear breakout above $166 or a breakdown below $160 before entering a trade.
1
172
·
--
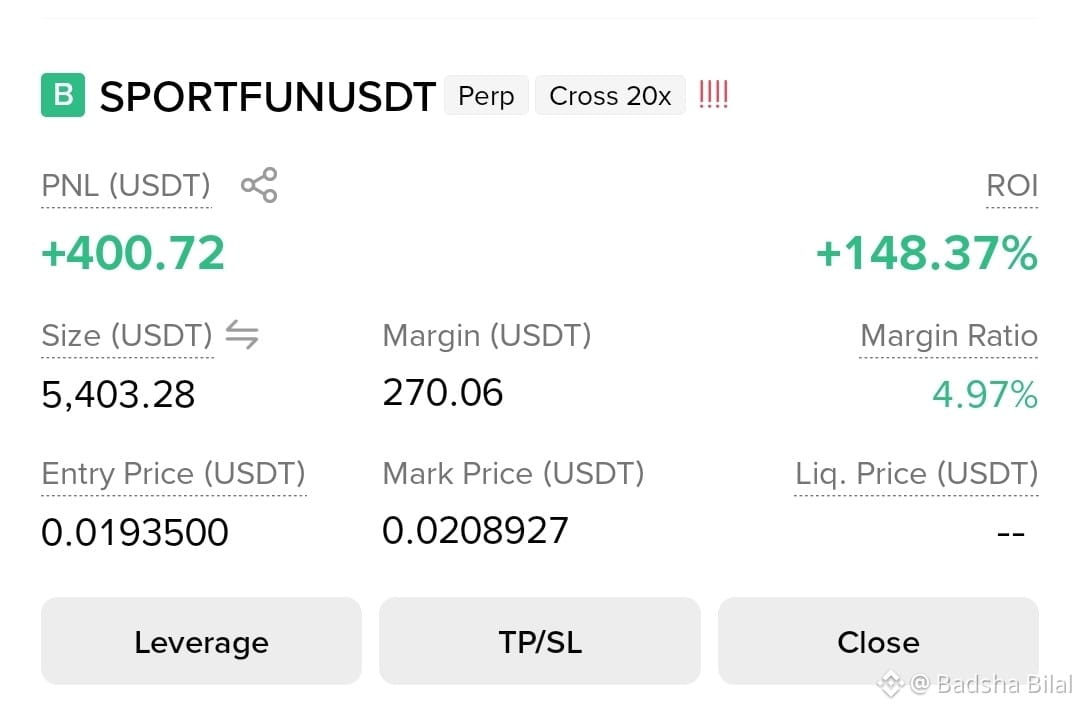
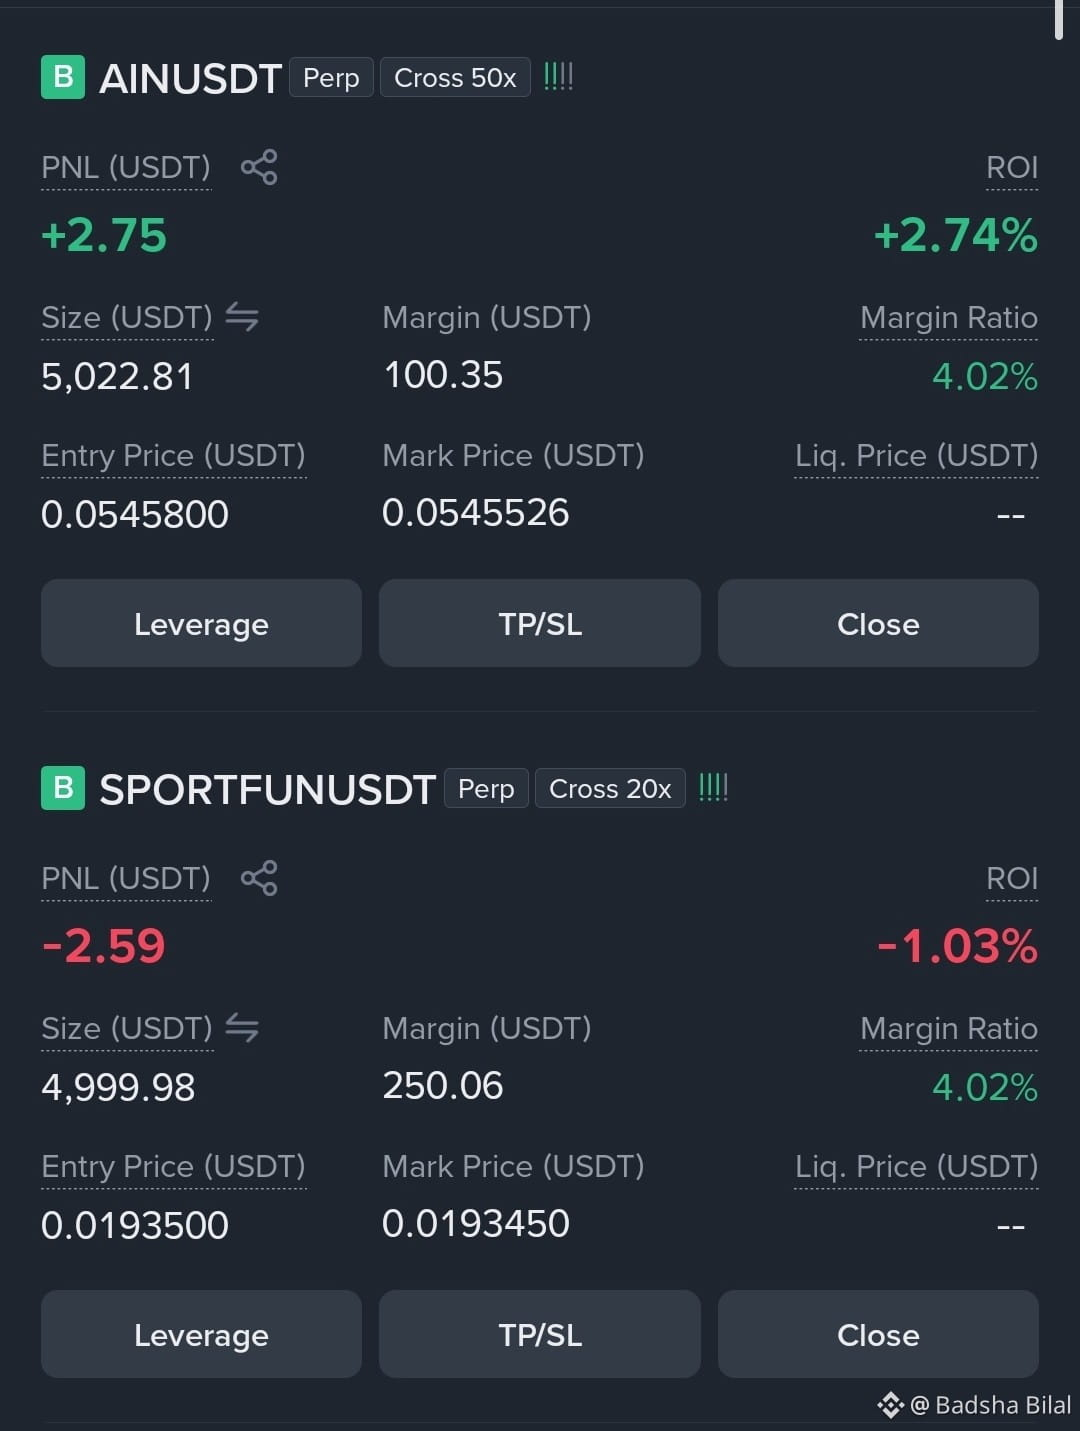
Ey oğlanlar, mən elə indi bu 2 $AIN if aldım ki, böyüsün #GreekPoliceBustCryptoScamRingArrest17
{future}(AINUSDT)
$SPORTFUN
{future}(SPORTFUNUSDT)
Ey oğlanlar, mən elə indi bu 2 $AIN if aldım ki, böyüsün #GreekPoliceBustCryptoScamRingArrest17
$SPORTFUN
$SPORTFUN
1
789
·
--
{spot}(LINKUSDT)
{spot}(SUIUSDT)
İlk giriş səviyyəm $LINK $SUI
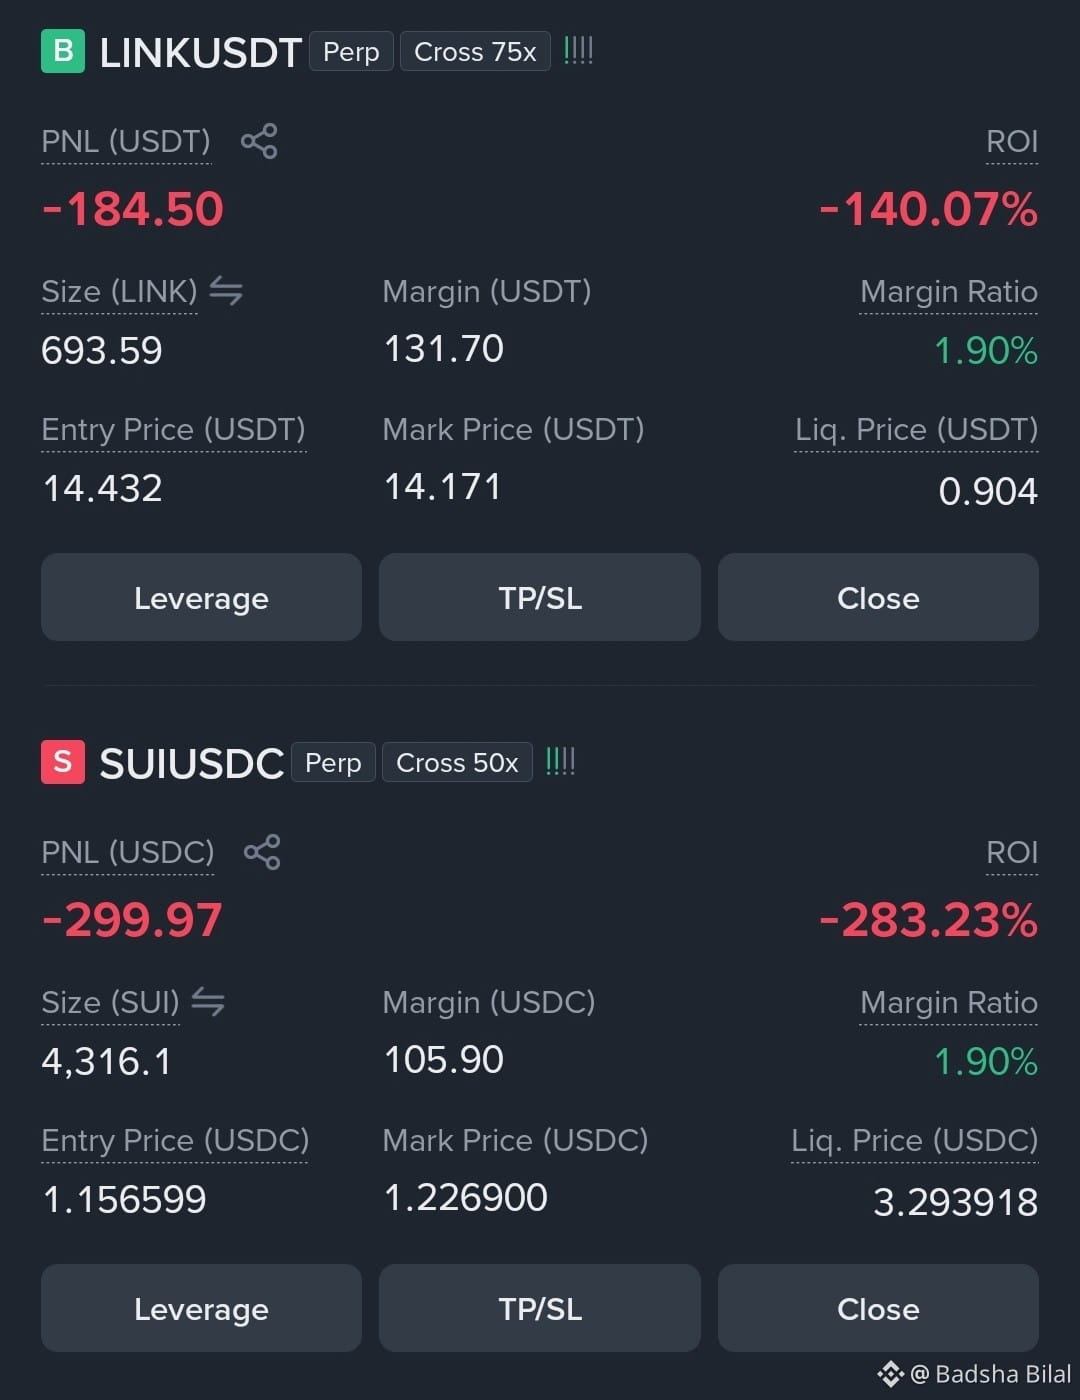
POV: Siz Fyuçersə inamla girdiniz… və bazar reallıq yoxlaması verdi. 😂📉
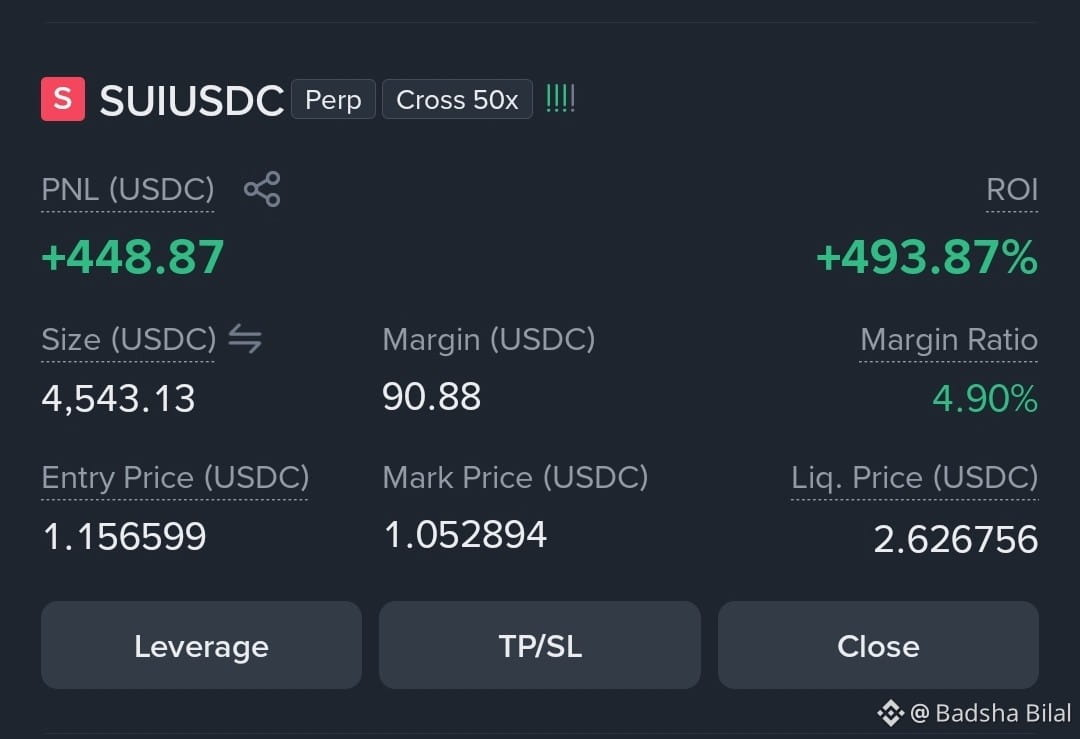
LINKUSDT: 75x ⚡
SUIUSDC: 50x ⚡
Mən: “Mən nə etdiyimi bilirəm.” 😎
Bazar: “Əminsiniz?” 💀
📉 LINK PNL: -184.50 USDT
📉 SUI PNL: -299.97 USDC
Zarafat bir yana, Fyuçersdə insanların kifayət qədər paylaşmadığı hissə budur:
Yüksək leverage sizi daha yaxşı treyder etmir—hər səhvi daha bahalı edir.
Bəzən ən yaxşı ticarət sadəcə həddən artıq leverage etməməkdir. 🧠
Dürüst olun 👇
Siz 50x ticarətdən sağ çıxardınız, yoxsa bazar sizi düz tarix kitablarına göndərəcək? 😂
#BinanceSquare #Binance #Crypto #Futures #Trading #LINK #SUI #CryptoTrading #Leverage #RiskManagement
İlk giriş səviyyəm $LINK $SUI
POV: Siz Fyuçersə inamla girdiniz… və bazar reallıq yoxlaması verdi. 😂📉
LINKUSDT: 75x ⚡
SUIUSDC: 50x ⚡
Mən: “Mən nə etdiyimi bilirəm.” 😎
Bazar: “Əminsiniz?” 💀
📉 LINK PNL: -184.50 USDT
📉 SUI PNL: -299.97 USDC
Zarafat bir yana, Fyuçersdə insanların kifayət qədər paylaşmadığı hissə budur:
Yüksək leverage sizi daha yaxşı treyder etmir—hər səhvi daha bahalı edir.
Bəzən ən yaxşı ticarət sadəcə həddən artıq leverage etməməkdir. 🧠
Dürüst olun 👇
Siz 50x ticarətdən sağ çıxardınız, yoxsa bazar sizi düz tarix kitablarına göndərəcək? 😂
#BinanceSquare #Binance #Crypto #Futures #Trading #LINK #SUI #CryptoTrading #Leverage #RiskManagement
POV: Siz Fyuçersə inamla girdiniz… və bazar reallıq yoxlaması verdi. 😂📉
LINKUSDT: 75x ⚡
SUIUSDC: 50x ⚡
Mən: “Mən nə etdiyimi bilirəm.” 😎
Bazar: “Əminsiniz?” 💀
📉 LINK PNL: -184.50 USDT
📉 SUI PNL: -299.97 USDC
Zarafat bir yana, Fyuçersdə insanların kifayət qədər paylaşmadığı hissə budur:
Yüksək leverage sizi daha yaxşı treyder etmir—hər səhvi daha bahalı edir.
Bəzən ən yaxşı ticarət sadəcə həddən artıq leverage etməməkdir. 🧠
Dürüst olun 👇
Siz 50x ticarətdən sağ çıxardınız, yoxsa bazar sizi düz tarix kitablarına göndərəcək? 😂
#BinanceSquare #Binance #Crypto #Futures #Trading #LINK #SUI #CryptoTrading #Leverage #RiskManagement
1
148
·
--
Artım
Tərcüməyə bax
Check my Yesterday Signal 🚦 $XPL
{future}(XPLUSDT)
Check my Yesterday Signal 🚦 $XPL
Badsha Bilal
·
--
📊$XPL
Bazarın İcmalı
· Cari Qiymət: 0.09553 USDT
· 24s Dəyişiklik: +5.53% (Qısamüddətli yüksəlişin bərpası)
· Ümumi Trend: Uzunmüddətli Ayı / Qısamüddətli Boğa düzəlişi
---
🟢 UZUN (Alış) Siqnalı
· Giriş Zonası: 0.09500 - 0.09560 (Cari bazar qiyməti)
· Təsdiq: 15m və ya 1h şamdan 0.09659-dan (24s Yüksək) yuxarı bağlanması.
· Mənfəət Alma (TP):
· TP 1: 0.09750
· TP 2: 0.10000 (Psixoloji müqavimət)
· TP 3: 0.10350 (Əvvəlki 1h pik)
· Stop Loss (SL): 0.08950 (Son 1h swing low-un aşağısı: 0.08907)
· Əsaslandırma: 15m, 1h və 4h Parabolik SAR nöqtələri hazırda qiymətin altındadır və bu qısamüddətli yuxarı impulsun olduğunu göstərir. 24s həcmi qənaətbəxşdir və qiymət son düşüşdən sonra bərpa olunur.
🔴 QISA (Satış) Siqnalı
· Giriş Zonası: 0.09650 - 0.09750 (Qiymət 24s yüksəkliyini rədd edərsə)
· Təsdiq: 1h şamdan 0.09500-dan aşağı geri bağlanması və ya 0.09659-da aydın rəddedici kölgə (wick).
· Mənfəət Alma (TP):
· TP 1: 0.09300
· TP 2: 0.09000 (24s Aşağı)
· TP 3: 0.08900 (Son swing low)
· Stop Loss (SL): 0.09850 (Son yerli müqavimətin üstü)
· Əsaslandırma: 1D (Gündəlik) qrafik son dərəcə ayıdır (-88.64% 1 il ərzində, -18.06% 7 gün ərzində). Gündəlik SAR hələ də qiymətin üstündədir. Bu cari “pump” böyük ehtimalla daha geniş eniş trendi davam etməzdən əvvəl sadəcə qısamüddətli rahatlama yürüşüdür.
---
⚠️ Risk İdarəetməsi & Əsas Səviyyələr
· Əsas Müqavimət: 0.09659 (24s Yüksək) / 0.10355 (1h qrafik piki)
· Əsas Dəstək: 0.09018 (24s Aşağı) / 0.08907 (Son dib)
· Leverage Xəbərdarlığı: XPLUSDT son dərəcə volatil göstərib (1h qrafikdə böyük qırmızı və yaşıl şamlar), ona görə yüksək leverage istifadə etməyin. Maksimum olaraq 3x-5x tövsiyə olunur.
· Trend Baxışı: Neytral - Qısaya. 15m/1h qrafikləri alış siqnalı göstərsə də, 1D qrafikası deyir ki, hər hansı uzun mövqe “skalp” kimi (tezkor ticarət) götürülməlidir, uzunmüddətli hold kimi yox. Ümumi makro trend hələ də enişdədir.
Xülasə:
· Skalpçılar (15m/1h): 0.0955-dən yuxarı LONG girişlərini axtarın, hədəf 0.0975-0.10.
· Svingtreyderlər (1D): 0.0965-0.10 yaxınlığında rəddolma gözləyin və SHORT mövqeyi açın, hədəf 0.09 və aşağısıdır.
Bazarın İcmalı
· Cari Qiymət: 0.09553 USDT
· 24s Dəyişiklik: +5.53% (Qısamüddətli yüksəlişin bərpası)
· Ümumi Trend: Uzunmüddətli Ayı / Qısamüddətli Boğa düzəlişi
---
🟢 UZUN (Alış) Siqnalı
· Giriş Zonası: 0.09500 - 0.09560 (Cari bazar qiyməti)
· Təsdiq: 15m və ya 1h şamdan 0.09659-dan (24s Yüksək) yuxarı bağlanması.
· Mənfəət Alma (TP):
· TP 1: 0.09750
· TP 2: 0.10000 (Psixoloji müqavimət)
· TP 3: 0.10350 (Əvvəlki 1h pik)
· Stop Loss (SL): 0.08950 (Son 1h swing low-un aşağısı: 0.08907)
· Əsaslandırma: 15m, 1h və 4h Parabolik SAR nöqtələri hazırda qiymətin altındadır və bu qısamüddətli yuxarı impulsun olduğunu göstərir. 24s həcmi qənaətbəxşdir və qiymət son düşüşdən sonra bərpa olunur.
🔴 QISA (Satış) Siqnalı
· Giriş Zonası: 0.09650 - 0.09750 (Qiymət 24s yüksəkliyini rədd edərsə)
· Təsdiq: 1h şamdan 0.09500-dan aşağı geri bağlanması və ya 0.09659-da aydın rəddedici kölgə (wick).
· Mənfəət Alma (TP):
· TP 1: 0.09300
· TP 2: 0.09000 (24s Aşağı)
· TP 3: 0.08900 (Son swing low)
· Stop Loss (SL): 0.09850 (Son yerli müqavimətin üstü)
· Əsaslandırma: 1D (Gündəlik) qrafik son dərəcə ayıdır (-88.64% 1 il ərzində, -18.06% 7 gün ərzində). Gündəlik SAR hələ də qiymətin üstündədir. Bu cari “pump” böyük ehtimalla daha geniş eniş trendi davam etməzdən əvvəl sadəcə qısamüddətli rahatlama yürüşüdür.
---
⚠️ Risk İdarəetməsi & Əsas Səviyyələr
· Əsas Müqavimət: 0.09659 (24s Yüksək) / 0.10355 (1h qrafik piki)
· Əsas Dəstək: 0.09018 (24s Aşağı) / 0.08907 (Son dib)
· Leverage Xəbərdarlığı: XPLUSDT son dərəcə volatil göstərib (1h qrafikdə böyük qırmızı və yaşıl şamlar), ona görə yüksək leverage istifadə etməyin. Maksimum olaraq 3x-5x tövsiyə olunur.
· Trend Baxışı: Neytral - Qısaya. 15m/1h qrafikləri alış siqnalı göstərsə də, 1D qrafikası deyir ki, hər hansı uzun mövqe “skalp” kimi (tezkor ticarət) götürülməlidir, uzunmüddətli hold kimi yox. Ümumi makro trend hələ də enişdədir.
Xülasə:
· Skalpçılar (15m/1h): 0.0955-dən yuxarı LONG girişlərini axtarın, hədəf 0.0975-0.10.
· Svingtreyderlər (1D): 0.0965-0.10 yaxınlığında rəddolma gözləyin və SHORT mövqeyi açın, hədəf 0.09 və aşağısıdır.
1
7
·
--
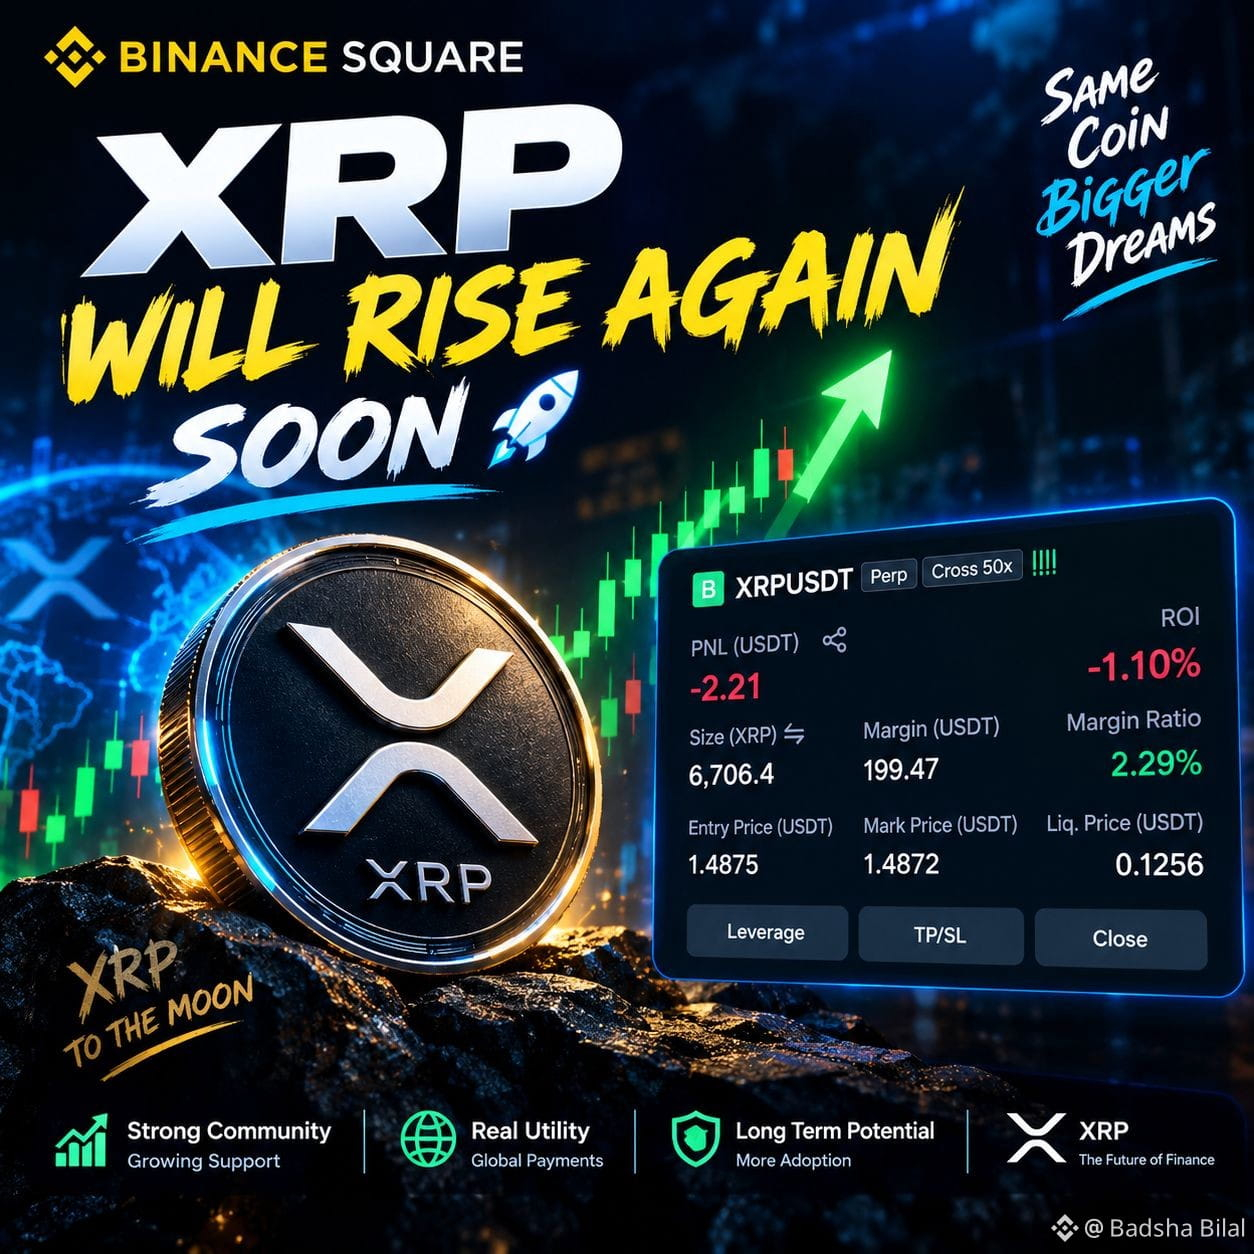
30 günlük ticarət $XRP 276.3 USDT
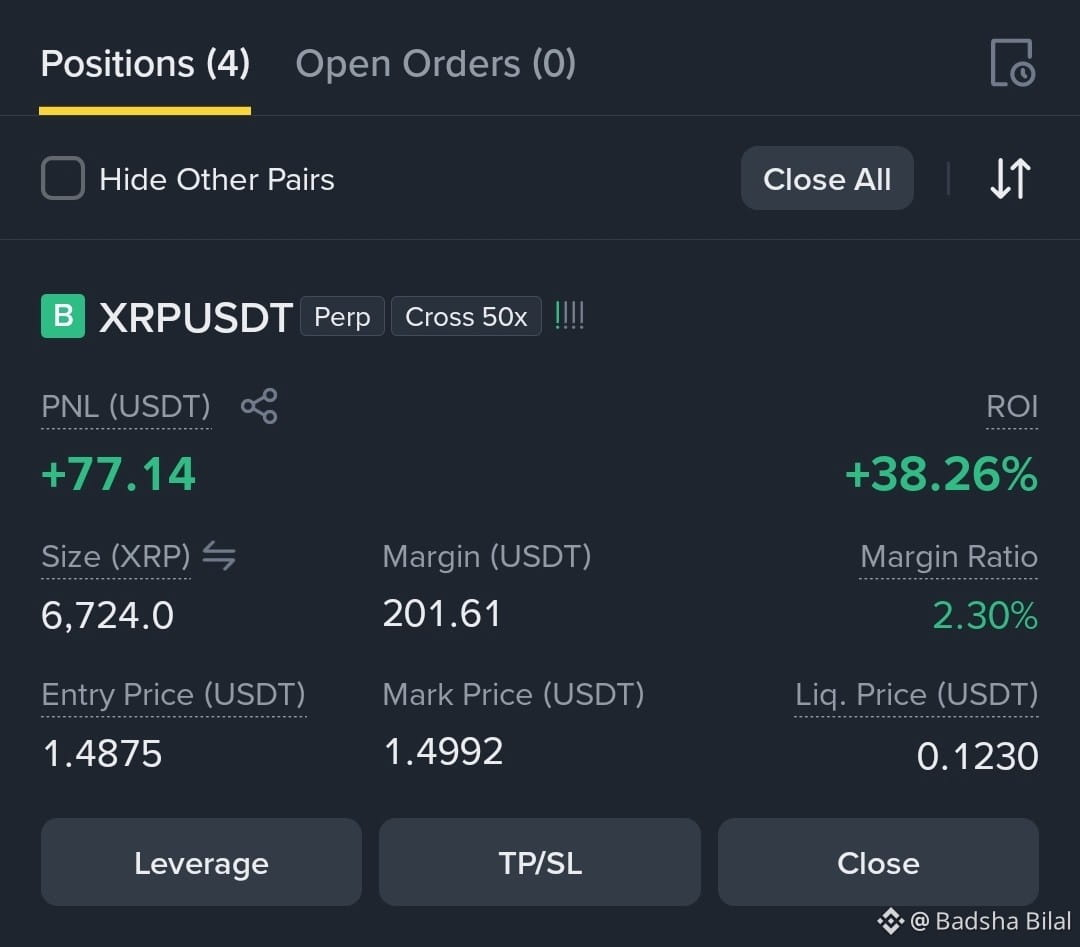
1
48
·
--
📊$XPL
{future}(XPLUSDT)
Bazarın İcmalı
· Cari Qiymət: 0.09553 USDT
· 24s Dəyişiklik: +5.53% (Qısamüddətli yüksəlişin bərpası)
· Ümumi Trend: Uzunmüddətli Ayı / Qısamüddətli Boğa düzəlişi
---
🟢 UZUN (Alış) Siqnalı
· Giriş Zonası: 0.09500 - 0.09560 (Cari bazar qiyməti)
· Təsdiq: 15m və ya 1h şamdan 0.09659-dan (24s Yüksək) yuxarı bağlanması.
· Mənfəət Alma (TP):
· TP 1: 0.09750
· TP 2: 0.10000 (Psixoloji müqavimət)
· TP 3: 0.10350 (Əvvəlki 1h pik)
· Stop Loss (SL): 0.08950 (Son 1h swing low-un aşağısı: 0.08907)
· Əsaslandırma: 15m, 1h və 4h Parabolik SAR nöqtələri hazırda qiymətin altındadır və bu qısamüddətli yuxarı impulsun olduğunu göstərir. 24s həcmi qənaətbəxşdir və qiymət son düşüşdən sonra bərpa olunur.
🔴 QISA (Satış) Siqnalı
· Giriş Zonası: 0.09650 - 0.09750 (Qiymət 24s yüksəkliyini rədd edərsə)
· Təsdiq: 1h şamdan 0.09500-dan aşağı geri bağlanması və ya 0.09659-da aydın rəddedici kölgə (wick).
· Mənfəət Alma (TP):
· TP 1: 0.09300
· TP 2: 0.09000 (24s Aşağı)
· TP 3: 0.08900 (Son swing low)
· Stop Loss (SL): 0.09850 (Son yerli müqavimətin üstü)
· Əsaslandırma: 1D (Gündəlik) qrafik son dərəcə ayıdır (-88.64% 1 il ərzində, -18.06% 7 gün ərzində). Gündəlik SAR hələ də qiymətin üstündədir. Bu cari “pump” böyük ehtimalla daha geniş eniş trendi davam etməzdən əvvəl sadəcə qısamüddətli rahatlama yürüşüdür.
---
⚠️ Risk İdarəetməsi & Əsas Səviyyələr
· Əsas Müqavimət: 0.09659 (24s Yüksək) / 0.10355 (1h qrafik piki)
· Əsas Dəstək: 0.09018 (24s Aşağı) / 0.08907 (Son dib)
· Leverage Xəbərdarlığı: XPLUSDT son dərəcə volatil göstərib (1h qrafikdə böyük qırmızı və yaşıl şamlar), ona görə yüksək leverage istifadə etməyin. Maksimum olaraq 3x-5x tövsiyə olunur.
· Trend Baxışı: Neytral - Qısaya. 15m/1h qrafikləri alış siqnalı göstərsə də, 1D qrafikası deyir ki, hər hansı uzun mövqe “skalp” kimi (tezkor ticarət) götürülməlidir, uzunmüddətli hold kimi yox. Ümumi makro trend hələ də enişdədir.
Xülasə:
· Skalpçılar (15m/1h): 0.0955-dən yuxarı LONG girişlərini axtarın, hədəf 0.0975-0.10.
· Svingtreyderlər (1D): 0.0965-0.10 yaxınlığında rəddolma gözləyin və SHORT mövqeyi açın, hədəf 0.09 və aşağısıdır.
📊$XPL
Bazarın İcmalı
· Cari Qiymət: 0.09553 USDT
· 24s Dəyişiklik: +5.53% (Qısamüddətli yüksəlişin bərpası)
· Ümumi Trend: Uzunmüddətli Ayı / Qısamüddətli Boğa düzəlişi
---
🟢 UZUN (Alış) Siqnalı
· Giriş Zonası: 0.09500 - 0.09560 (Cari bazar qiyməti)
· Təsdiq: 15m və ya 1h şamdan 0.09659-dan (24s Yüksək) yuxarı bağlanması.
· Mənfəət Alma (TP):
· TP 1: 0.09750
· TP 2: 0.10000 (Psixoloji müqavimət)
· TP 3: 0.10350 (Əvvəlki 1h pik)
· Stop Loss (SL): 0.08950 (Son 1h swing low-un aşağısı: 0.08907)
· Əsaslandırma: 15m, 1h və 4h Parabolik SAR nöqtələri hazırda qiymətin altındadır və bu qısamüddətli yuxarı impulsun olduğunu göstərir. 24s həcmi qənaətbəxşdir və qiymət son düşüşdən sonra bərpa olunur.
🔴 QISA (Satış) Siqnalı
· Giriş Zonası: 0.09650 - 0.09750 (Qiymət 24s yüksəkliyini rədd edərsə)
· Təsdiq: 1h şamdan 0.09500-dan aşağı geri bağlanması və ya 0.09659-da aydın rəddedici kölgə (wick).
· Mənfəət Alma (TP):
· TP 1: 0.09300
· TP 2: 0.09000 (24s Aşağı)
· TP 3: 0.08900 (Son swing low)
· Stop Loss (SL): 0.09850 (Son yerli müqavimətin üstü)
· Əsaslandırma: 1D (Gündəlik) qrafik son dərəcə ayıdır (-88.64% 1 il ərzində, -18.06% 7 gün ərzində). Gündəlik SAR hələ də qiymətin üstündədir. Bu cari “pump” böyük ehtimalla daha geniş eniş trendi davam etməzdən əvvəl sadəcə qısamüddətli rahatlama yürüşüdür.
---
⚠️ Risk İdarəetməsi & Əsas Səviyyələr
· Əsas Müqavimət: 0.09659 (24s Yüksək) / 0.10355 (1h qrafik piki)
· Əsas Dəstək: 0.09018 (24s Aşağı) / 0.08907 (Son dib)
· Leverage Xəbərdarlığı: XPLUSDT son dərəcə volatil göstərib (1h qrafikdə böyük qırmızı və yaşıl şamlar), ona görə yüksək leverage istifadə etməyin. Maksimum olaraq 3x-5x tövsiyə olunur.
· Trend Baxışı: Neytral - Qısaya. 15m/1h qrafikləri alış siqnalı göstərsə də, 1D qrafikası deyir ki, hər hansı uzun mövqe “skalp” kimi (tezkor ticarət) götürülməlidir, uzunmüddətli hold kimi yox. Ümumi makro trend hələ də enişdədir.
Xülasə:
· Skalpçılar (15m/1h): 0.0955-dən yuxarı LONG girişlərini axtarın, hədəf 0.0975-0.10.
· Svingtreyderlər (1D): 0.0965-0.10 yaxınlığında rəddolma gözləyin və SHORT mövqeyi açın, hədəf 0.09 və aşağısıdır.
Bazarın İcmalı
· Cari Qiymət: 0.09553 USDT
· 24s Dəyişiklik: +5.53% (Qısamüddətli yüksəlişin bərpası)
· Ümumi Trend: Uzunmüddətli Ayı / Qısamüddətli Boğa düzəlişi
---
🟢 UZUN (Alış) Siqnalı
· Giriş Zonası: 0.09500 - 0.09560 (Cari bazar qiyməti)
· Təsdiq: 15m və ya 1h şamdan 0.09659-dan (24s Yüksək) yuxarı bağlanması.
· Mənfəət Alma (TP):
· TP 1: 0.09750
· TP 2: 0.10000 (Psixoloji müqavimət)
· TP 3: 0.10350 (Əvvəlki 1h pik)
· Stop Loss (SL): 0.08950 (Son 1h swing low-un aşağısı: 0.08907)
· Əsaslandırma: 15m, 1h və 4h Parabolik SAR nöqtələri hazırda qiymətin altındadır və bu qısamüddətli yuxarı impulsun olduğunu göstərir. 24s həcmi qənaətbəxşdir və qiymət son düşüşdən sonra bərpa olunur.
🔴 QISA (Satış) Siqnalı
· Giriş Zonası: 0.09650 - 0.09750 (Qiymət 24s yüksəkliyini rədd edərsə)
· Təsdiq: 1h şamdan 0.09500-dan aşağı geri bağlanması və ya 0.09659-da aydın rəddedici kölgə (wick).
· Mənfəət Alma (TP):
· TP 1: 0.09300
· TP 2: 0.09000 (24s Aşağı)
· TP 3: 0.08900 (Son swing low)
· Stop Loss (SL): 0.09850 (Son yerli müqavimətin üstü)
· Əsaslandırma: 1D (Gündəlik) qrafik son dərəcə ayıdır (-88.64% 1 il ərzində, -18.06% 7 gün ərzində). Gündəlik SAR hələ də qiymətin üstündədir. Bu cari “pump” böyük ehtimalla daha geniş eniş trendi davam etməzdən əvvəl sadəcə qısamüddətli rahatlama yürüşüdür.
---
⚠️ Risk İdarəetməsi & Əsas Səviyyələr
· Əsas Müqavimət: 0.09659 (24s Yüksək) / 0.10355 (1h qrafik piki)
· Əsas Dəstək: 0.09018 (24s Aşağı) / 0.08907 (Son dib)
· Leverage Xəbərdarlığı: XPLUSDT son dərəcə volatil göstərib (1h qrafikdə böyük qırmızı və yaşıl şamlar), ona görə yüksək leverage istifadə etməyin. Maksimum olaraq 3x-5x tövsiyə olunur.
· Trend Baxışı: Neytral - Qısaya. 15m/1h qrafikləri alış siqnalı göstərsə də, 1D qrafikası deyir ki, hər hansı uzun mövqe “skalp” kimi (tezkor ticarət) götürülməlidir, uzunmüddətli hold kimi yox. Ümumi makro trend hələ də enişdədir.
Xülasə:
· Skalpçılar (15m/1h): 0.0955-dən yuxarı LONG girişlərini axtarın, hədəf 0.0975-0.10.
· Svingtreyderlər (1D): 0.0965-0.10 yaxınlığında rəddolma gözləyin və SHORT mövqeyi açın, hədəf 0.09 və aşağısıdır.
1
1
348
·
--
Azalma
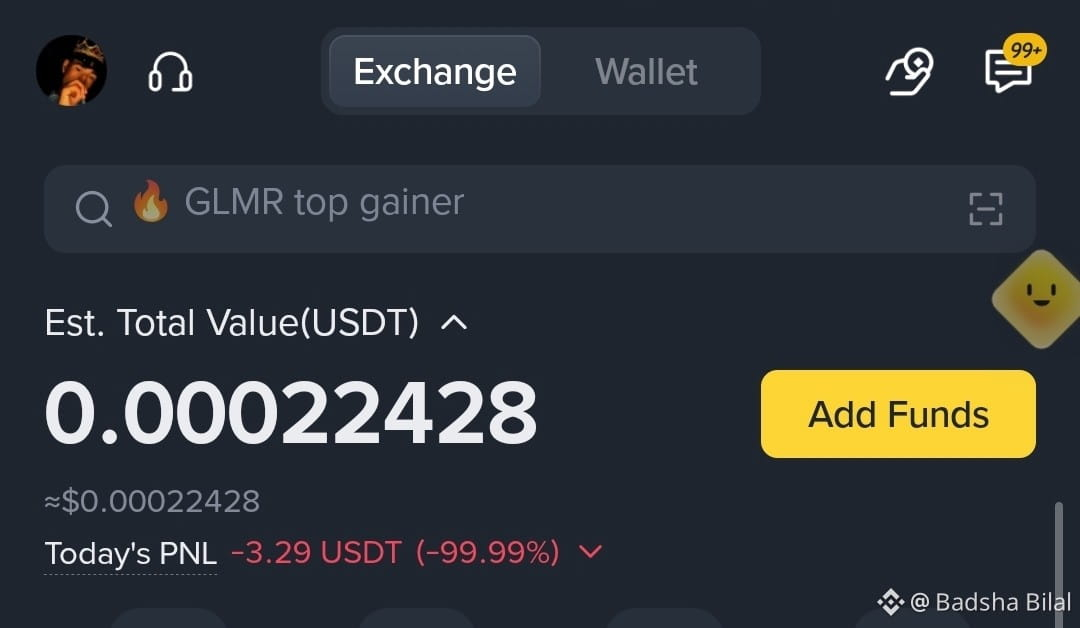
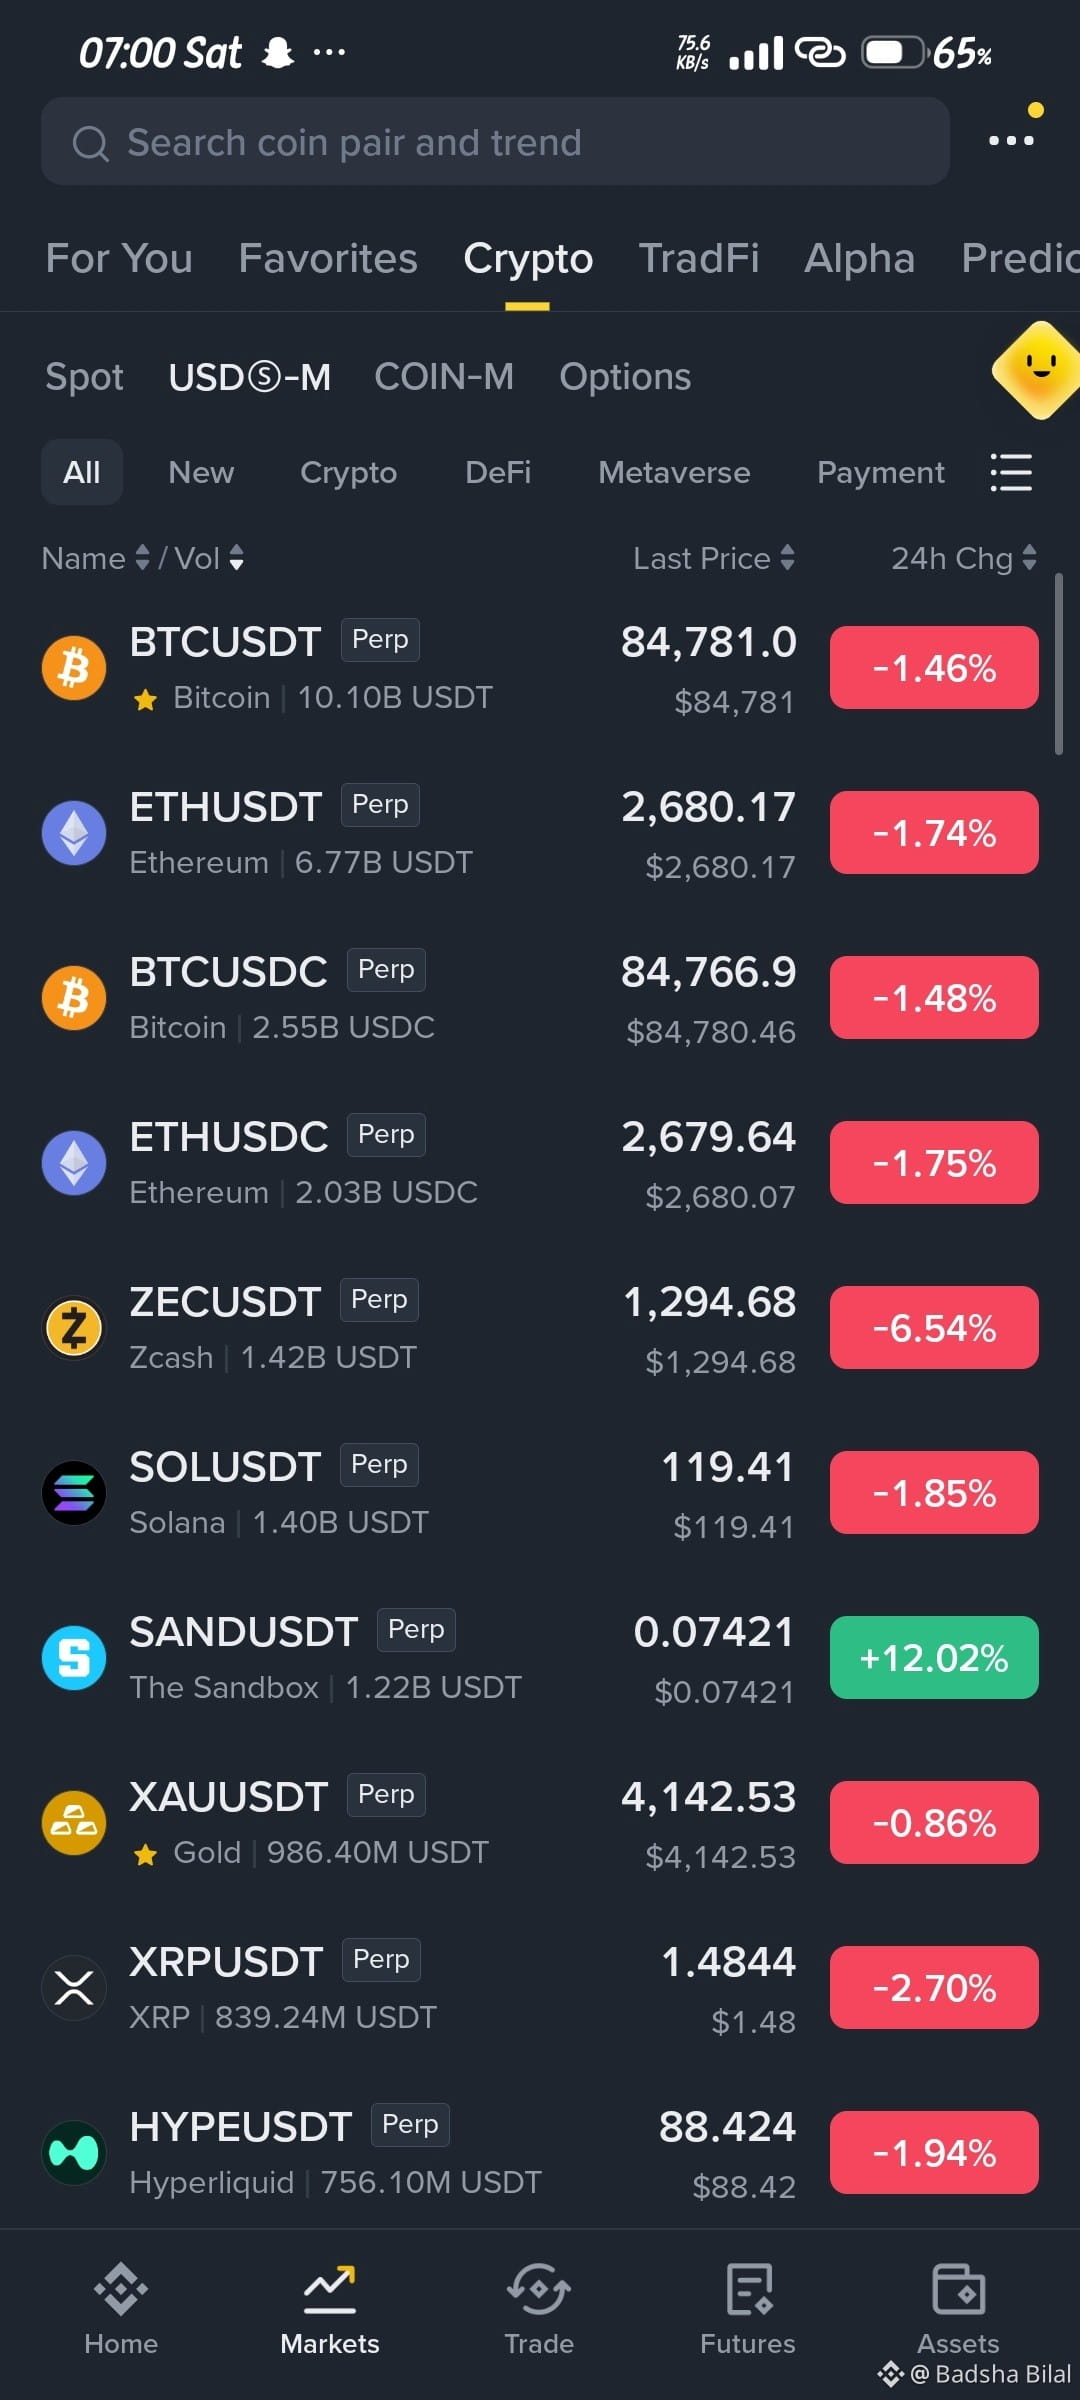
30 günlük ticarət $1INCH 126.8 USDT
Cəmi $USDT $HBAR
{future}(HBARUSDT)
$1INCH
{spot}(BTCUSDT)
Cəmi $USDT $HBAR
$1INCH
$1INCH
127
·
--
Azalma
Birdən Mən Alıram, Satmaq Yerinə Nə Etməliyəm? $BR
Birdən Mən Alıram, Satmaq Yerinə Nə Etməliyəm? $BR
2
447
Daha çox kontent araşdırmaq üçün daxil olun
Binance Square-də qlobal kriptovalyuta istifadəçilərinə qoşulun
⚡️ Kriptovalyuta haqqında ən son və faydalı məlumatları əldə edin.
💬 Dünyanın ən böyük kriptovalyuta birjası tərəfindən etibar edilir.
👍 Doğrulanmış yaradıcılardan gələn real məlumatları kəşf edin.
E-poçt/Telefon nömrəsi
Trenddə olan mövzular
IsAnthropic’s$1.5TMarketCapJustified?
10,768 baxış
Müzakirə edir: 88
Anthropic Nasdaq-da rekord debütündə 105 dollardan açılmağa hazırlaşır
Binance News
·12 bəyənmə
·14.9k baxış
BTCRemainsUnderPressureAfterHawkishFOMCMinutes
243,229 baxış
Müzakirə edir: 2,099
NvidiaBoardReportedlySplitOverHuang’sReturn
118,445 baxış
Müzakirə edir: 1,134