
asiftahsin
2.3k Paylaşımlar

asiftahsin
Şikayət et
İstifadəçini blokla
Share Crypto Related Market Analysis, Share Crypto Related knowledge for my follower(brother and Sister)
32 İzlənilir
335 İzləyicilər
1.3K+ Bəyəndi
Postlar
Hamısı
Sitatlar
·
--
Məqalə
Tərcüməyə bax
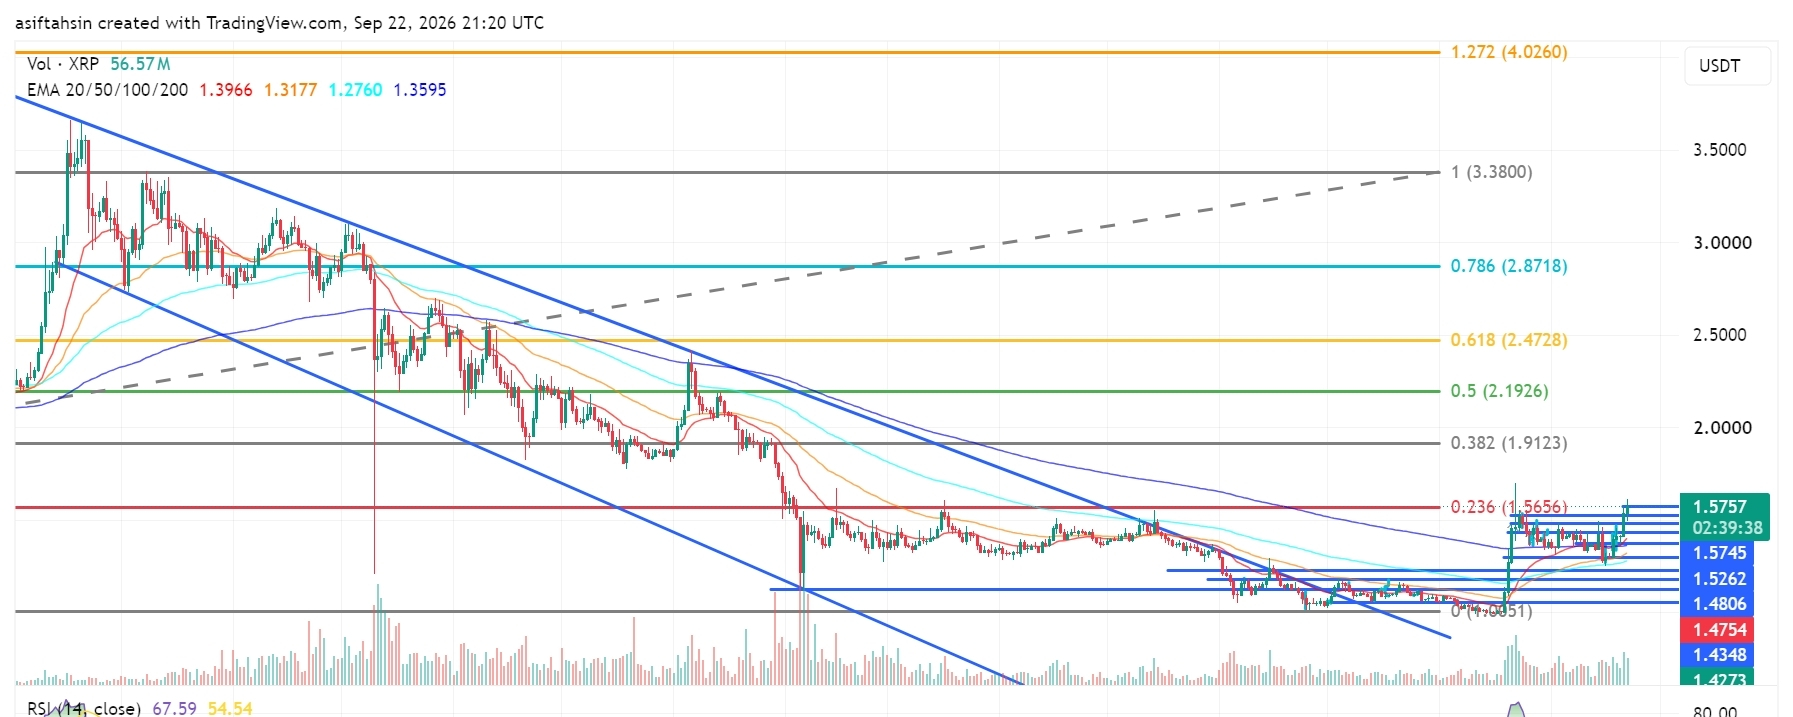
XRP Technical Outlook: XRP Reclaims $1.57 as Recovery Structure StrengthensXRP is currently trading around $1.57, holding above the $1.48–$1.53 region after the recent recovery from the $1.27–$1.43 support area.
The broader structure has improved significantly, with price breaking above the long-term descending trendline and reclaiming the $1.48–$1.53 zone. XRP is now testing the 0.236 Fibonacci level at $1.5656. A sustained move through this area would put the higher Fibonacci levels back into focus.
📈 EMA Structure
20 EMA: $1.3965
50 EMA: $1.3177
100 EMA: $1.2760
200 EMA: $1.3595
XRP is currently trading well above the 20 EMA at $1.3965.
The recovery above the 50 EMA at $1.3177, 100 EMA at $1.2760, and 200 EMA at $1.3595 keeps the broader recovery structure constructive.
The 20 EMA has moved above the longer-term EMA levels, showing improving short-term structure.
📐 Fibonacci Levels
Key Fibonacci levels:
0.236: $1.5656
0.382: $1.9123
0.5: $2.1926
0.618: $2.4728
0.786: $2.8718
1.0: $3.3800
1.272: $4.0260
XRP is currently trading around the 0.236 Fibonacci level at $1.5656.
The next major Fibonacci reference is $1.9123 — 0.382 Fib.
A sustained move above $1.5656 could bring $1.9123 into focus, followed by $2.1926.
🟢 Bullish Scenario
XRP has recovered strongly from the lower support structure and is now trading around $1.57, above the previous $1.48–$1.53 resistance zone.
Immediate resistance:
$1.5745
$1.5757
$1.5656 — 0.236 Fibonacci
$1.9123 — 0.382 Fibonacci
$2.1926 — 0.5 Fibonacci
$2.4728 — 0.618 Fibonacci
A clean breakout and sustained close above the $1.5656–$1.58 zone would provide stronger confirmation of continued recovery.
🎯 Target 1: $1.5757
🎯 Target 2: $1.9123 — 0.382 Fibonacci
🎯 Target 3: $2.1926 — 0.5 Fibonacci
🎯 Target 4: $2.4728 — 0.618 Fibonacci
🎯 Target 5: $2.8718 — 0.786 Fibonacci
🎯 Target 6: $3.3800 — 1.0 Fibonacci
🎯 Target 7: $4.0260 — 1.272 Fibonacci
A confirmed move through the $1.56–$1.58 zone could strengthen the medium-term recovery structure and bring the $1.91–$2.19 region into focus.
🔴 Pullback Scenario
After the recent expansion above $1.50, a retest of the breakout area would be normal.
Key supports:
$1.5262
$1.4806
$1.4754
$1.4348
$1.4273
$1.4104
$1.3965 — 20 EMA
$1.3595 — 200 EMA
$1.3177 — 50 EMA
$1.2760 — 100 EMA
The $1.43–$1.53 zone is particularly important.
If XRP continues to hold this area during a pullback, the current recovery structure remains active.
A sustained loss of $1.4104–$1.3965 would weaken the current recovery structure and bring the lower EMA region back into focus.
🧠 Market Structure & Liquidity
XRP has formed a major recovery structure after spending months inside a descending channel.
The recent move produced a strong breakout from the long-term descending structure, followed by a recovery through $1.43, $1.48, and $1.53.
XRP is now moving through an important:
Recovery → Breakout → Retest → Consolidation → Continuation
structure.
The major upside liquidity is now concentrated around the $1.56–$1.58 region. A decisive move through this area would place $1.9123 as the next major Fibonacci reference.
📊 RSI Momentum
RSI (14): 67.59
RSI has moved significantly above the neutral 50 level and is approaching the traditional 70 overbought threshold.
The current reading shows strong short-term momentum following the recent expansion, while also indicating that consolidation or a pullback could occur if momentum cools.
A sustained RSI above 60 would keep momentum supportive, while a move back below 50 would indicate increasing short-term weakness.
🎯 Key Levels
🔴 Major Resistance: $1.5757 → $1.9123 → $2.1926 → $2.4728 → $2.8718
🟢 Major Support: $1.5262 → $1.4806 → $1.4754 → $1.4348 → $1.4104 → $1.3965
📉 Dynamic EMA Support: $1.3965 — 20 EMA | $1.3177 — 50 EMA | $1.3595 — 200 EMA | $1.2760 — 100 EMA
🚀 Upside References: $1.5757 → $1.9123 → $2.1926 → $2.4728 → $2.8718 → $3.3800
📌 Final Outlook
XRP's broader structure has strengthened after the recent recovery, with price now holding around $1.57 and above the major $1.43–$1.53 support structure.
The $1.43–$1.53 area is now an important short-term support region, while $1.56–$1.58 remains the immediate major resistance zone.
A confirmed move above $1.5656 could open the path toward $1.9123, followed by $2.1926 and $2.4728.
However, rejection from the upper resistance area followed by a sustained loss of $1.4104 would weaken the current recovery structure and bring the lower support zones back into focus.
Bias: 🟢 Recovery structure intact above $1.4104. A sustained move above $1.5656 could open the path toward $1.9123, with $2.1926 as the next major Fibonacci reference.
$XRP
{future}(XRPUSDT)
XRP Technical Outlook: XRP Reclaims $1.57 as Recovery Structure Strengthens
XRP is currently trading around $1.57, holding above the $1.48–$1.53 region after the recent recovery from the $1.27–$1.43 support area.
The broader structure has improved significantly, with price breaking above the long-term descending trendline and reclaiming the $1.48–$1.53 zone. XRP is now testing the 0.236 Fibonacci level at $1.5656. A sustained move through this area would put the higher Fibonacci levels back into focus.
📈 EMA Structure
20 EMA: $1.3965
50 EMA: $1.3177
100 EMA: $1.2760
200 EMA: $1.3595
XRP is currently trading well above the 20 EMA at $1.3965.
The recovery above the 50 EMA at $1.3177, 100 EMA at $1.2760, and 200 EMA at $1.3595 keeps the broader recovery structure constructive.
The 20 EMA has moved above the longer-term EMA levels, showing improving short-term structure.
📐 Fibonacci Levels
Key Fibonacci levels:
0.236: $1.5656
0.382: $1.9123
0.5: $2.1926
0.618: $2.4728
0.786: $2.8718
1.0: $3.3800
1.272: $4.0260
XRP is currently trading around the 0.236 Fibonacci level at $1.5656.
The next major Fibonacci reference is $1.9123 — 0.382 Fib.
A sustained move above $1.5656 could bring $1.9123 into focus, followed by $2.1926.
🟢 Bullish Scenario
XRP has recovered strongly from the lower support structure and is now trading around $1.57, above the previous $1.48–$1.53 resistance zone.
Immediate resistance:
$1.5745
$1.5757
$1.5656 — 0.236 Fibonacci
$1.9123 — 0.382 Fibonacci
$2.1926 — 0.5 Fibonacci
$2.4728 — 0.618 Fibonacci
A clean breakout and sustained close above the $1.5656–$1.58 zone would provide stronger confirmation of continued recovery.
🎯 Target 1: $1.5757
🎯 Target 2: $1.9123 — 0.382 Fibonacci
🎯 Target 3: $2.1926 — 0.5 Fibonacci
🎯 Target 4: $2.4728 — 0.618 Fibonacci
🎯 Target 5: $2.8718 — 0.786 Fibonacci
🎯 Target 6: $3.3800 — 1.0 Fibonacci
🎯 Target 7: $4.0260 — 1.272 Fibonacci
A confirmed move through the $1.56–$1.58 zone could strengthen the medium-term recovery structure and bring the $1.91–$2.19 region into focus.
🔴 Pullback Scenario
After the recent expansion above $1.50, a retest of the breakout area would be normal.
Key supports:
$1.5262
$1.4806
$1.4754
$1.4348
$1.4273
$1.4104
$1.3965 — 20 EMA
$1.3595 — 200 EMA
$1.3177 — 50 EMA
$1.2760 — 100 EMA
The $1.43–$1.53 zone is particularly important.
If XRP continues to hold this area during a pullback, the current recovery structure remains active.
A sustained loss of $1.4104–$1.3965 would weaken the current recovery structure and bring the lower EMA region back into focus.
🧠 Market Structure & Liquidity
XRP has formed a major recovery structure after spending months inside a descending channel.
The recent move produced a strong breakout from the long-term descending structure, followed by a recovery through $1.43, $1.48, and $1.53.
XRP is now moving through an important:
Recovery → Breakout → Retest → Consolidation → Continuation
structure.
The major upside liquidity is now concentrated around the $1.56–$1.58 region. A decisive move through this area would place $1.9123 as the next major Fibonacci reference.
📊 RSI Momentum
RSI (14): 67.59
RSI has moved significantly above the neutral 50 level and is approaching the traditional 70 overbought threshold.
The current reading shows strong short-term momentum following the recent expansion, while also indicating that consolidation or a pullback could occur if momentum cools.
A sustained RSI above 60 would keep momentum supportive, while a move back below 50 would indicate increasing short-term weakness.
🎯 Key Levels
🔴 Major Resistance: $1.5757 → $1.9123 → $2.1926 → $2.4728 → $2.8718
🟢 Major Support: $1.5262 → $1.4806 → $1.4754 → $1.4348 → $1.4104 → $1.3965
📉 Dynamic EMA Support: $1.3965 — 20 EMA | $1.3177 — 50 EMA | $1.3595 — 200 EMA | $1.2760 — 100 EMA
🚀 Upside References: $1.5757 → $1.9123 → $2.1926 → $2.4728 → $2.8718 → $3.3800
📌 Final Outlook
XRP's broader structure has strengthened after the recent recovery, with price now holding around $1.57 and above the major $1.43–$1.53 support structure.
The $1.43–$1.53 area is now an important short-term support region, while $1.56–$1.58 remains the immediate major resistance zone.
A confirmed move above $1.5656 could open the path toward $1.9123, followed by $2.1926 and $2.4728.
However, rejection from the upper resistance area followed by a sustained loss of $1.4104 would weaken the current recovery structure and bring the lower support zones back into focus.
Bias: 🟢 Recovery structure intact above $1.4104. A sustained move above $1.5656 could open the path toward $1.9123, with $2.1926 as the next major Fibonacci reference.
$XRP
The broader structure has improved significantly, with price breaking above the long-term descending trendline and reclaiming the $1.48–$1.53 zone. XRP is now testing the 0.236 Fibonacci level at $1.5656. A sustained move through this area would put the higher Fibonacci levels back into focus.
📈 EMA Structure
20 EMA: $1.3965
50 EMA: $1.3177
100 EMA: $1.2760
200 EMA: $1.3595
XRP is currently trading well above the 20 EMA at $1.3965.
The recovery above the 50 EMA at $1.3177, 100 EMA at $1.2760, and 200 EMA at $1.3595 keeps the broader recovery structure constructive.
The 20 EMA has moved above the longer-term EMA levels, showing improving short-term structure.
📐 Fibonacci Levels
Key Fibonacci levels:
0.236: $1.5656
0.382: $1.9123
0.5: $2.1926
0.618: $2.4728
0.786: $2.8718
1.0: $3.3800
1.272: $4.0260
XRP is currently trading around the 0.236 Fibonacci level at $1.5656.
The next major Fibonacci reference is $1.9123 — 0.382 Fib.
A sustained move above $1.5656 could bring $1.9123 into focus, followed by $2.1926.
🟢 Bullish Scenario
XRP has recovered strongly from the lower support structure and is now trading around $1.57, above the previous $1.48–$1.53 resistance zone.
Immediate resistance:
$1.5745
$1.5757
$1.5656 — 0.236 Fibonacci
$1.9123 — 0.382 Fibonacci
$2.1926 — 0.5 Fibonacci
$2.4728 — 0.618 Fibonacci
A clean breakout and sustained close above the $1.5656–$1.58 zone would provide stronger confirmation of continued recovery.
🎯 Target 1: $1.5757
🎯 Target 2: $1.9123 — 0.382 Fibonacci
🎯 Target 3: $2.1926 — 0.5 Fibonacci
🎯 Target 4: $2.4728 — 0.618 Fibonacci
🎯 Target 5: $2.8718 — 0.786 Fibonacci
🎯 Target 6: $3.3800 — 1.0 Fibonacci
🎯 Target 7: $4.0260 — 1.272 Fibonacci
A confirmed move through the $1.56–$1.58 zone could strengthen the medium-term recovery structure and bring the $1.91–$2.19 region into focus.
🔴 Pullback Scenario
After the recent expansion above $1.50, a retest of the breakout area would be normal.
Key supports:
$1.5262
$1.4806
$1.4754
$1.4348
$1.4273
$1.4104
$1.3965 — 20 EMA
$1.3595 — 200 EMA
$1.3177 — 50 EMA
$1.2760 — 100 EMA
The $1.43–$1.53 zone is particularly important.
If XRP continues to hold this area during a pullback, the current recovery structure remains active.
A sustained loss of $1.4104–$1.3965 would weaken the current recovery structure and bring the lower EMA region back into focus.
🧠 Market Structure & Liquidity
XRP has formed a major recovery structure after spending months inside a descending channel.
The recent move produced a strong breakout from the long-term descending structure, followed by a recovery through $1.43, $1.48, and $1.53.
XRP is now moving through an important:
Recovery → Breakout → Retest → Consolidation → Continuation
structure.
The major upside liquidity is now concentrated around the $1.56–$1.58 region. A decisive move through this area would place $1.9123 as the next major Fibonacci reference.
📊 RSI Momentum
RSI (14): 67.59
RSI has moved significantly above the neutral 50 level and is approaching the traditional 70 overbought threshold.
The current reading shows strong short-term momentum following the recent expansion, while also indicating that consolidation or a pullback could occur if momentum cools.
A sustained RSI above 60 would keep momentum supportive, while a move back below 50 would indicate increasing short-term weakness.
🎯 Key Levels
🔴 Major Resistance: $1.5757 → $1.9123 → $2.1926 → $2.4728 → $2.8718
🟢 Major Support: $1.5262 → $1.4806 → $1.4754 → $1.4348 → $1.4104 → $1.3965
📉 Dynamic EMA Support: $1.3965 — 20 EMA | $1.3177 — 50 EMA | $1.3595 — 200 EMA | $1.2760 — 100 EMA
🚀 Upside References: $1.5757 → $1.9123 → $2.1926 → $2.4728 → $2.8718 → $3.3800
📌 Final Outlook
XRP's broader structure has strengthened after the recent recovery, with price now holding around $1.57 and above the major $1.43–$1.53 support structure.
The $1.43–$1.53 area is now an important short-term support region, while $1.56–$1.58 remains the immediate major resistance zone.
A confirmed move above $1.5656 could open the path toward $1.9123, followed by $2.1926 and $2.4728.
However, rejection from the upper resistance area followed by a sustained loss of $1.4104 would weaken the current recovery structure and bring the lower support zones back into focus.
Bias: 🟢 Recovery structure intact above $1.4104. A sustained move above $1.5656 could open the path toward $1.9123, with $2.1926 as the next major Fibonacci reference.
$XRP
66
·
--
Məqalə
Tərcüməyə bax
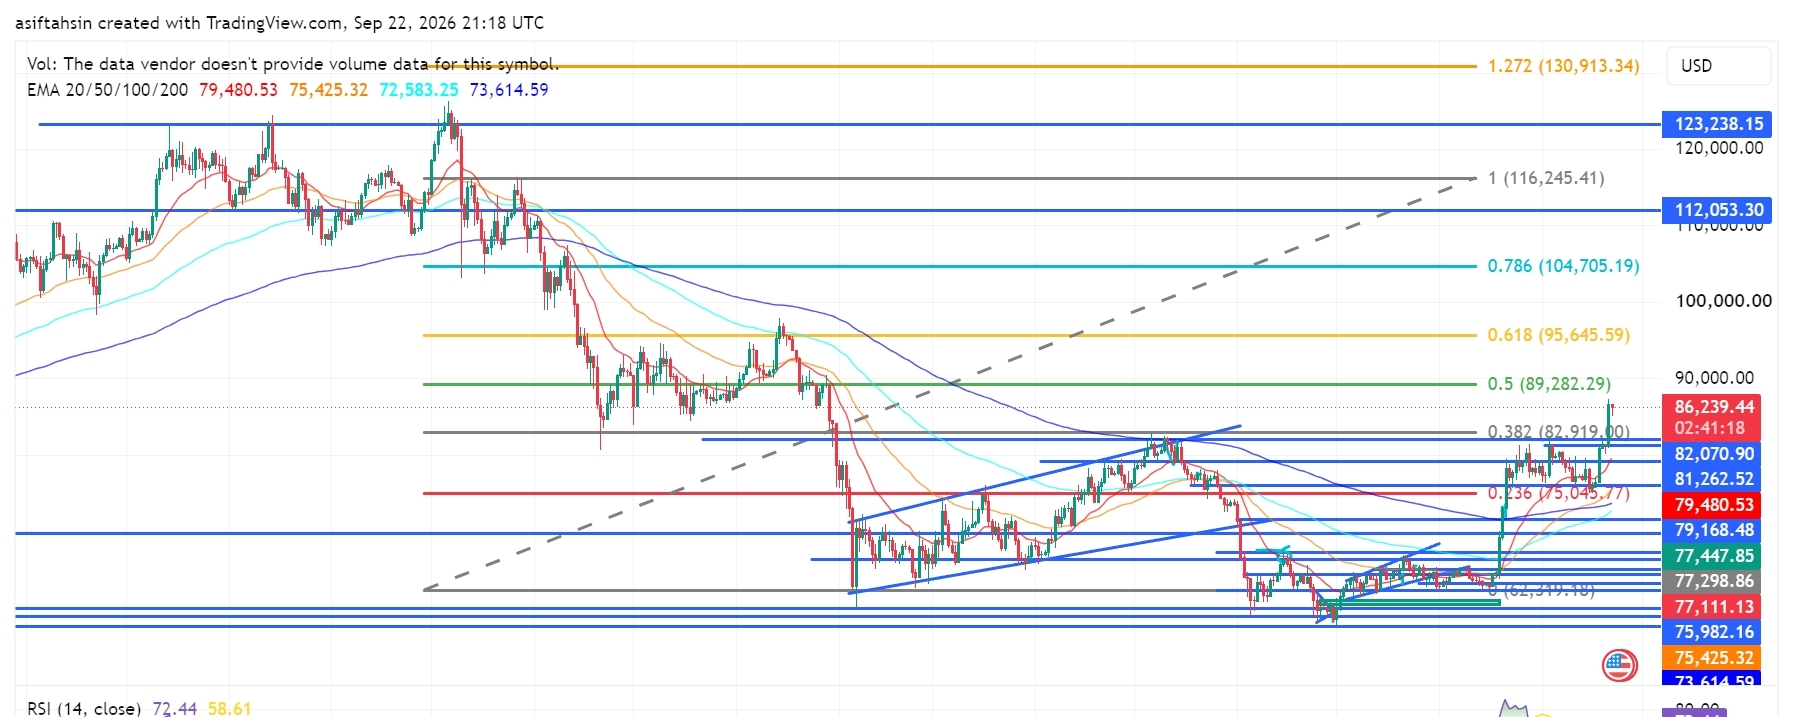
BTC Technical Outlook: Bitcoin Reclaims $86K as Recovery Structure StrengthensBTC is currently trading around $86,239, holding above the $82,000–$83,000 region after the recent recovery from the $75,000–$80,000 support area.
The broader structure has improved significantly, with price reclaiming the $82K area and moving above the 0.382 Fibonacci level at $82,919. The next major Fibonacci reference is $89,282, followed by the $95,645 region.
📈 EMA Structure
20 EMA: $79,480.49
50 EMA: $75,425.30
100 EMA: $72,583.24
200 EMA: $73,614.58
BTC is currently trading well above the 20 EMA at $79,480.49.
The recovery above the 50 EMA at $75,425.30, 100 EMA at $72,583.24, and 200 EMA at $73,614.58 keeps the broader recovery structure constructive.
The 20 EMA remains above the longer-term EMA levels, showing improving short-term structure.
📐 Fibonacci Levels
Key Fibonacci levels:
0.236: $75,045.77
0.382: $82,919.00
0.5: $89,282.29
0.618: $95,645.59
0.786: $104,705.19
1.0: $116,245.41
1.272: $130,913.34
BTC is currently trading above the 0.382 Fibonacci level at $82,919.
The next major Fibonacci reference is $89,282 — 0.5 Fib.
A sustained move above $89,282 could bring $95,645 into focus, followed by $104,705.
🟢 Bullish Scenario
BTC has recovered strongly from the lower support structure and is now trading around $86K, above the previous $82K–$83K resistance zone.
Immediate resistance:
$89,282.29 — 0.5 Fibonacci
$95,645.59 — 0.618 Fibonacci
$104,705.19 — 0.786 Fibonacci
$112,053.30
$116,245.41 — 1.0 Fibonacci
$123,238.15
$130,913.34 — 1.272 Fibonacci
A clean breakout and sustained close above $89,282 would provide stronger confirmation of continued recovery.
🎯 Target 1: $89,282 — 0.5 Fibonacci
🎯 Target 2: $95,645 — 0.618 Fibonacci
🎯 Target 3: $104,705 — 0.786 Fibonacci
🎯 Target 4: $116,245 — 1.0 Fibonacci
🎯 Target 5: $123,238
🎯 Target 6: $130,913 — 1.272 Fibonacci
A confirmed move through the $89K–$90K zone could strengthen the medium-term recovery structure and bring the $95K–$105K region into focus.
🔴 Pullback Scenario
After the recent expansion toward $86K, a retest of the breakout area would be normal.
Key supports:
$82,919 — 0.382 Fibonacci
$82,070.90
$81,262.52
$79,480.49 — 20 EMA
$79,168.48
$77,447.85
$77,298.86
$77,111.13
$75,982.16
$75,425.30 — 50 EMA
$73,614.58 — 200 EMA
$72,583.24 — 100 EMA
$71,543.38
The $79K–$83K zone is particularly important.
If BTC continues to hold this area during a pullback, the current recovery structure remains active.
A sustained loss of $75,045 would weaken the current recovery structure and bring the lower EMA region back into focus.
🧠 Market Structure & Liquidity
BTC has formed a strong recovery structure after sweeping liquidity around the $75K–$80K region.
The recent move produced a strong recovery through $80K, followed by a breakout above $82,919 and continuation toward $86K.
BTC is now moving through an important:
Recovery → Breakout → Retest → Consolidation → Continuation
structure.
The major upside liquidity is now concentrated around the $89K–$95K region. A decisive move through $89,282 would place $95,645 as the next major Fibonacci reference.
📊 RSI Momentum
RSI (14): 72.44
RSI has moved significantly above the neutral 50 level and is now above the traditional 70 overbought threshold.
This reflects strong short-term momentum following the recent expansion, but it also means BTC could experience increased volatility or a consolidation phase before the next major move.
A sustained RSI above 60 would keep momentum supportive, while a move back below 50 would indicate increasing short-term weakness.
🎯 Key Levels
🔴 Major Resistance: $89,282 → $95,645 → $104,705 → $116,245 → $123,238 → $130,913
🟢 Major Support: $82,919 → $82,071 → $81,263 → $79,480 → $77,448 → $75,982 → $75,045
📉 Dynamic EMA Support: $79,480 — 20 EMA | $75,425 — 50 EMA | $73,615 — 200 EMA | $72,583 — 100 EMA
🚀 Upside References: $89,282 → $95,645 → $104,705 → $116,245 → $130,913
📌 Final Outlook
BTC's broader structure has strengthened after the recent recovery, with price now holding around $86K and above the major $79K–$83K support structure.
The $79K–$83K area is now an important short-term support region, while $89K–$90K is the next major resistance zone.
A confirmed move above $89,282 could open the path toward $95,645, followed by $104,705 and $116,245.
However, rejection from the upper resistance area followed by a sustained loss of $75,045 would weaken the current recovery structure and bring the lower support zones back into focus.
Bias: 🟢 Recovery structure intact above $75,045. A sustained move above $89,282 could open the path toward $95,645, with $104,705 as the next major Fibonacci reference.
$BTC
{future}(BTCUSDT)
BTC Technical Outlook: Bitcoin Reclaims $86K as Recovery Structure Strengthens
BTC is currently trading around $86,239, holding above the $82,000–$83,000 region after the recent recovery from the $75,000–$80,000 support area.
The broader structure has improved significantly, with price reclaiming the $82K area and moving above the 0.382 Fibonacci level at $82,919. The next major Fibonacci reference is $89,282, followed by the $95,645 region.
📈 EMA Structure
20 EMA: $79,480.49
50 EMA: $75,425.30
100 EMA: $72,583.24
200 EMA: $73,614.58
BTC is currently trading well above the 20 EMA at $79,480.49.
The recovery above the 50 EMA at $75,425.30, 100 EMA at $72,583.24, and 200 EMA at $73,614.58 keeps the broader recovery structure constructive.
The 20 EMA remains above the longer-term EMA levels, showing improving short-term structure.
📐 Fibonacci Levels
Key Fibonacci levels:
0.236: $75,045.77
0.382: $82,919.00
0.5: $89,282.29
0.618: $95,645.59
0.786: $104,705.19
1.0: $116,245.41
1.272: $130,913.34
BTC is currently trading above the 0.382 Fibonacci level at $82,919.
The next major Fibonacci reference is $89,282 — 0.5 Fib.
A sustained move above $89,282 could bring $95,645 into focus, followed by $104,705.
🟢 Bullish Scenario
BTC has recovered strongly from the lower support structure and is now trading around $86K, above the previous $82K–$83K resistance zone.
Immediate resistance:
$89,282.29 — 0.5 Fibonacci
$95,645.59 — 0.618 Fibonacci
$104,705.19 — 0.786 Fibonacci
$112,053.30
$116,245.41 — 1.0 Fibonacci
$123,238.15
$130,913.34 — 1.272 Fibonacci
A clean breakout and sustained close above $89,282 would provide stronger confirmation of continued recovery.
🎯 Target 1: $89,282 — 0.5 Fibonacci
🎯 Target 2: $95,645 — 0.618 Fibonacci
🎯 Target 3: $104,705 — 0.786 Fibonacci
🎯 Target 4: $116,245 — 1.0 Fibonacci
🎯 Target 5: $123,238
🎯 Target 6: $130,913 — 1.272 Fibonacci
A confirmed move through the $89K–$90K zone could strengthen the medium-term recovery structure and bring the $95K–$105K region into focus.
🔴 Pullback Scenario
After the recent expansion toward $86K, a retest of the breakout area would be normal.
Key supports:
$82,919 — 0.382 Fibonacci
$82,070.90
$81,262.52
$79,480.49 — 20 EMA
$79,168.48
$77,447.85
$77,298.86
$77,111.13
$75,982.16
$75,425.30 — 50 EMA
$73,614.58 — 200 EMA
$72,583.24 — 100 EMA
$71,543.38
The $79K–$83K zone is particularly important.
If BTC continues to hold this area during a pullback, the current recovery structure remains active.
A sustained loss of $75,045 would weaken the current recovery structure and bring the lower EMA region back into focus.
🧠 Market Structure & Liquidity
BTC has formed a strong recovery structure after sweeping liquidity around the $75K–$80K region.
The recent move produced a strong recovery through $80K, followed by a breakout above $82,919 and continuation toward $86K.
BTC is now moving through an important:
Recovery → Breakout → Retest → Consolidation → Continuation
structure.
The major upside liquidity is now concentrated around the $89K–$95K region. A decisive move through $89,282 would place $95,645 as the next major Fibonacci reference.
📊 RSI Momentum
RSI (14): 72.44
RSI has moved significantly above the neutral 50 level and is now above the traditional 70 overbought threshold.
This reflects strong short-term momentum following the recent expansion, but it also means BTC could experience increased volatility or a consolidation phase before the next major move.
A sustained RSI above 60 would keep momentum supportive, while a move back below 50 would indicate increasing short-term weakness.
🎯 Key Levels
🔴 Major Resistance: $89,282 → $95,645 → $104,705 → $116,245 → $123,238 → $130,913
🟢 Major Support: $82,919 → $82,071 → $81,263 → $79,480 → $77,448 → $75,982 → $75,045
📉 Dynamic EMA Support: $79,480 — 20 EMA | $75,425 — 50 EMA | $73,615 — 200 EMA | $72,583 — 100 EMA
🚀 Upside References: $89,282 → $95,645 → $104,705 → $116,245 → $130,913
📌 Final Outlook
BTC's broader structure has strengthened after the recent recovery, with price now holding around $86K and above the major $79K–$83K support structure.
The $79K–$83K area is now an important short-term support region, while $89K–$90K is the next major resistance zone.
A confirmed move above $89,282 could open the path toward $95,645, followed by $104,705 and $116,245.
However, rejection from the upper resistance area followed by a sustained loss of $75,045 would weaken the current recovery structure and bring the lower support zones back into focus.
Bias: 🟢 Recovery structure intact above $75,045. A sustained move above $89,282 could open the path toward $95,645, with $104,705 as the next major Fibonacci reference.
$BTC
The broader structure has improved significantly, with price reclaiming the $82K area and moving above the 0.382 Fibonacci level at $82,919. The next major Fibonacci reference is $89,282, followed by the $95,645 region.
📈 EMA Structure
20 EMA: $79,480.49
50 EMA: $75,425.30
100 EMA: $72,583.24
200 EMA: $73,614.58
BTC is currently trading well above the 20 EMA at $79,480.49.
The recovery above the 50 EMA at $75,425.30, 100 EMA at $72,583.24, and 200 EMA at $73,614.58 keeps the broader recovery structure constructive.
The 20 EMA remains above the longer-term EMA levels, showing improving short-term structure.
📐 Fibonacci Levels
Key Fibonacci levels:
0.236: $75,045.77
0.382: $82,919.00
0.5: $89,282.29
0.618: $95,645.59
0.786: $104,705.19
1.0: $116,245.41
1.272: $130,913.34
BTC is currently trading above the 0.382 Fibonacci level at $82,919.
The next major Fibonacci reference is $89,282 — 0.5 Fib.
A sustained move above $89,282 could bring $95,645 into focus, followed by $104,705.
🟢 Bullish Scenario
BTC has recovered strongly from the lower support structure and is now trading around $86K, above the previous $82K–$83K resistance zone.
Immediate resistance:
$89,282.29 — 0.5 Fibonacci
$95,645.59 — 0.618 Fibonacci
$104,705.19 — 0.786 Fibonacci
$112,053.30
$116,245.41 — 1.0 Fibonacci
$123,238.15
$130,913.34 — 1.272 Fibonacci
A clean breakout and sustained close above $89,282 would provide stronger confirmation of continued recovery.
🎯 Target 1: $89,282 — 0.5 Fibonacci
🎯 Target 2: $95,645 — 0.618 Fibonacci
🎯 Target 3: $104,705 — 0.786 Fibonacci
🎯 Target 4: $116,245 — 1.0 Fibonacci
🎯 Target 5: $123,238
🎯 Target 6: $130,913 — 1.272 Fibonacci
A confirmed move through the $89K–$90K zone could strengthen the medium-term recovery structure and bring the $95K–$105K region into focus.
🔴 Pullback Scenario
After the recent expansion toward $86K, a retest of the breakout area would be normal.
Key supports:
$82,919 — 0.382 Fibonacci
$82,070.90
$81,262.52
$79,480.49 — 20 EMA
$79,168.48
$77,447.85
$77,298.86
$77,111.13
$75,982.16
$75,425.30 — 50 EMA
$73,614.58 — 200 EMA
$72,583.24 — 100 EMA
$71,543.38
The $79K–$83K zone is particularly important.
If BTC continues to hold this area during a pullback, the current recovery structure remains active.
A sustained loss of $75,045 would weaken the current recovery structure and bring the lower EMA region back into focus.
🧠 Market Structure & Liquidity
BTC has formed a strong recovery structure after sweeping liquidity around the $75K–$80K region.
The recent move produced a strong recovery through $80K, followed by a breakout above $82,919 and continuation toward $86K.
BTC is now moving through an important:
Recovery → Breakout → Retest → Consolidation → Continuation
structure.
The major upside liquidity is now concentrated around the $89K–$95K region. A decisive move through $89,282 would place $95,645 as the next major Fibonacci reference.
📊 RSI Momentum
RSI (14): 72.44
RSI has moved significantly above the neutral 50 level and is now above the traditional 70 overbought threshold.
This reflects strong short-term momentum following the recent expansion, but it also means BTC could experience increased volatility or a consolidation phase before the next major move.
A sustained RSI above 60 would keep momentum supportive, while a move back below 50 would indicate increasing short-term weakness.
🎯 Key Levels
🔴 Major Resistance: $89,282 → $95,645 → $104,705 → $116,245 → $123,238 → $130,913
🟢 Major Support: $82,919 → $82,071 → $81,263 → $79,480 → $77,448 → $75,982 → $75,045
📉 Dynamic EMA Support: $79,480 — 20 EMA | $75,425 — 50 EMA | $73,615 — 200 EMA | $72,583 — 100 EMA
🚀 Upside References: $89,282 → $95,645 → $104,705 → $116,245 → $130,913
📌 Final Outlook
BTC's broader structure has strengthened after the recent recovery, with price now holding around $86K and above the major $79K–$83K support structure.
The $79K–$83K area is now an important short-term support region, while $89K–$90K is the next major resistance zone.
A confirmed move above $89,282 could open the path toward $95,645, followed by $104,705 and $116,245.
However, rejection from the upper resistance area followed by a sustained loss of $75,045 would weaken the current recovery structure and bring the lower support zones back into focus.
Bias: 🟢 Recovery structure intact above $75,045. A sustained move above $89,282 could open the path toward $95,645, with $104,705 as the next major Fibonacci reference.
$BTC
48
·
--
Məqalə
Tərcüməyə bax
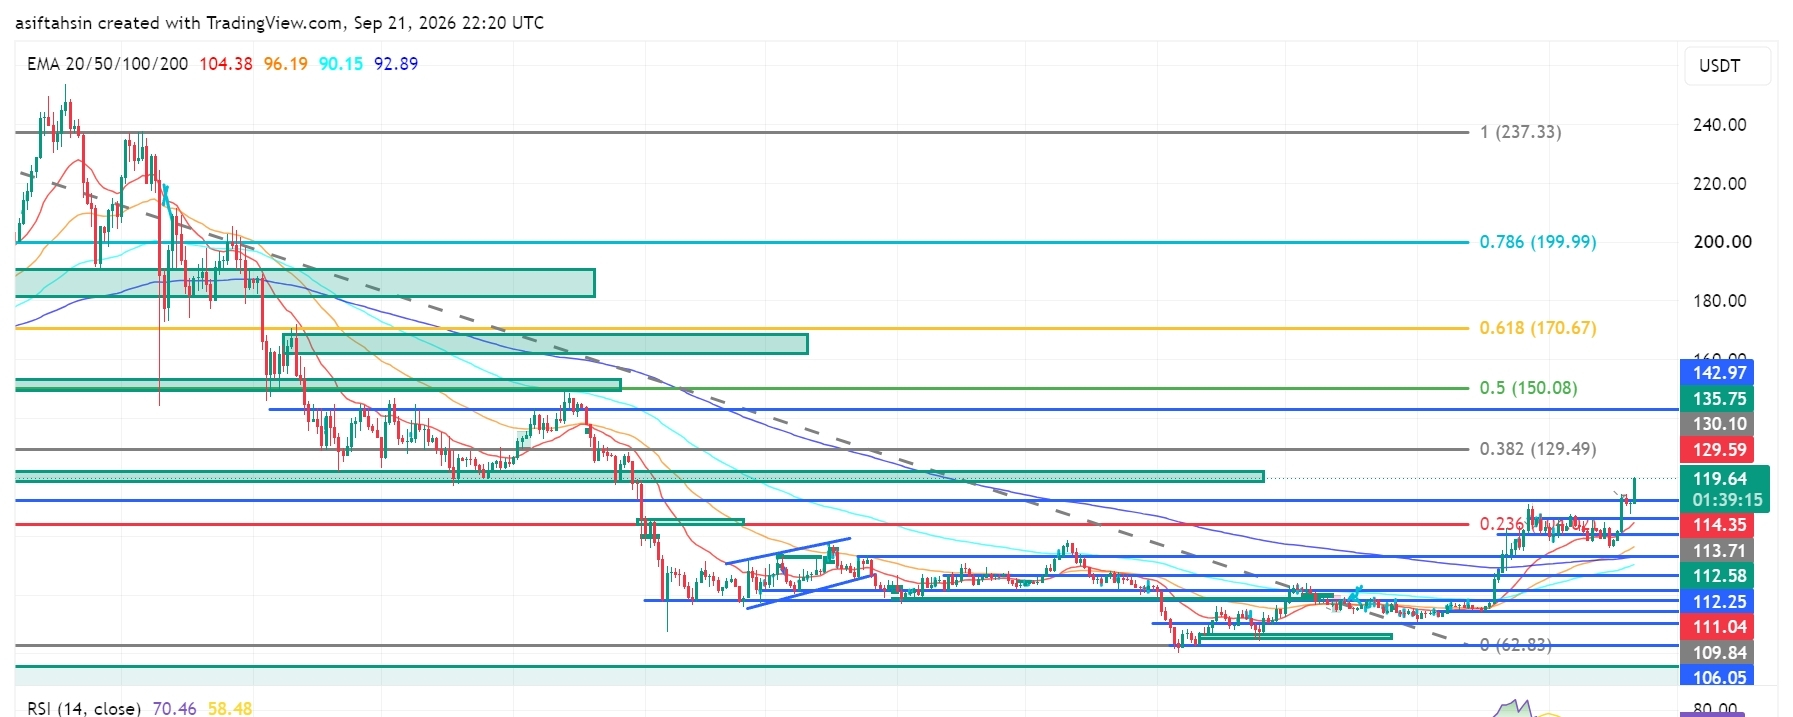
SOL Technical Outlook: Solana Pushes Toward $120 as Breakout Structure StrengthensSOL is currently trading around $119.61, holding well above the $112–$114 region after a strong recovery from the $104–$110 support zone.
The broader structure has improved significantly, with SOL reclaiming the $110–$114 area and now testing the $119–$120 resistance zone. A sustained breakout above this region would bring the higher Fibonacci levels back into focus.
📈 EMA Structure
20 EMA: $104.38
50 EMA: $96.19
100 EMA: $90.15
200 EMA: $92.89
SOL is trading significantly above all four major EMAs.
The 20 EMA remains above the 50 EMA, while the 50 EMA is also above the 200 EMA. This alignment reflects a strong recovery structure and improving medium-term trend.
The $104–$106 region is now an important deeper support zone, while the $110–$114 area has developed into a key structural support region after the recent breakout.
📐 Fibonacci Levels
0.236: $114.35
0.382: $129.49
0.5: $150.08
0.618: $170.67
0.786: $199.99
1.0: $237.33
SOL has reclaimed the 0.236 Fibonacci level around $114.35 and is now trading above it.
The next major Fibonacci resistance is $129.49, followed by $150.08.
🟢 Bullish Scenario
Immediate resistance is around:
$119.61 → $120
A clean breakout and sustained close above the $119–$120 zone could open the path toward:
$129.49 → $135.75 → $142.97 → $150.08
The $129.49 level is the next major Fibonacci resistance. A successful breakout and retest above $129.49 would strengthen the continuation structure and put the $150.08 level into focus.
Above $150.08, the higher Fibonacci references are:
$170.67 → $199.99 → $237.33
🔴 Pullback Scenario
Key support levels:
$114.35
$113.71
$112.58
$112.25
$111.04
$109.84
$106.05
$104.38
$96.19
$92.89
$90.15
The $111–$114 zone is particularly important.
A pullback into this area followed by a successful hold would keep the breakout structure constructive. Losing $109.84–$106.05 would indicate deeper consolidation, while a sustained move below the $104.38 20 EMA would significantly weaken the current recovery structure.
🧠 Market Structure & Liquidity
Liquidity Sweep → Accumulation → Higher Lows → Breakout → Expansion → Retest → Consolidation → Continuation
SOL has moved through several important structural phases, recovering from the June low around $62.83, building higher lows, reclaiming the $100 area, and then breaking above the previous $110–$114 resistance region.
The current move toward $120 represents another expansion phase, with $119–$120 acting as the immediate decision zone.
📊 RSI Momentum
RSI: 70.46
RSI MA: 58.48
RSI has moved above 70, showing strong bullish momentum but also entering an overbought region.
This does not automatically mean a reversal. However, after the recent expansion, SOL could experience short-term consolidation or a pullback before attempting another leg higher.
The key will be whether RSI can remain elevated while price holds the $114–$119 structure.
🎯 Key Levels
Resistance:
$119.61 → $120 → $129.49 → $135.75 → $142.97 → $150.08 → $170.67 → $199.99
Support:
$114.35 → $113.71 → $112.58 → $112.25 → $111.04 → $109.84 → $106.05 → $104.38
Major EMA Support:
$104.38 / $96.19 / $92.89 / $90.15
📌 Final Outlook
SOL has strengthened considerably after reclaiming the $110–$114 region and pushing toward $120.
The key battle now is $119–$120.
A sustained breakout above this zone could open the path toward $129.49, followed by $135.75–$142.97 and the major $150.08 Fibonacci level.
On the downside, $111–$114 is the first major retest zone. Holding this area would keep the breakout structure intact, while a deeper move below $106.05–$104.38 would weaken the current setup.
Bias: Recovery structure remains strong above $104.38. A sustained breakout above $119–$120 could open the path toward $129.49, with $150.08 as the next major Fibonacci objective.
$SOL
{future}(SOLUSDT)
SOL Technical Outlook: Solana Pushes Toward $120 as Breakout Structure Strengthens
SOL is currently trading around $119.61, holding well above the $112–$114 region after a strong recovery from the $104–$110 support zone.
The broader structure has improved significantly, with SOL reclaiming the $110–$114 area and now testing the $119–$120 resistance zone. A sustained breakout above this region would bring the higher Fibonacci levels back into focus.
📈 EMA Structure
20 EMA: $104.38
50 EMA: $96.19
100 EMA: $90.15
200 EMA: $92.89
SOL is trading significantly above all four major EMAs.
The 20 EMA remains above the 50 EMA, while the 50 EMA is also above the 200 EMA. This alignment reflects a strong recovery structure and improving medium-term trend.
The $104–$106 region is now an important deeper support zone, while the $110–$114 area has developed into a key structural support region after the recent breakout.
📐 Fibonacci Levels
0.236: $114.35
0.382: $129.49
0.5: $150.08
0.618: $170.67
0.786: $199.99
1.0: $237.33
SOL has reclaimed the 0.236 Fibonacci level around $114.35 and is now trading above it.
The next major Fibonacci resistance is $129.49, followed by $150.08.
🟢 Bullish Scenario
Immediate resistance is around:
$119.61 → $120
A clean breakout and sustained close above the $119–$120 zone could open the path toward:
$129.49 → $135.75 → $142.97 → $150.08
The $129.49 level is the next major Fibonacci resistance. A successful breakout and retest above $129.49 would strengthen the continuation structure and put the $150.08 level into focus.
Above $150.08, the higher Fibonacci references are:
$170.67 → $199.99 → $237.33
🔴 Pullback Scenario
Key support levels:
$114.35
$113.71
$112.58
$112.25
$111.04
$109.84
$106.05
$104.38
$96.19
$92.89
$90.15
The $111–$114 zone is particularly important.
A pullback into this area followed by a successful hold would keep the breakout structure constructive. Losing $109.84–$106.05 would indicate deeper consolidation, while a sustained move below the $104.38 20 EMA would significantly weaken the current recovery structure.
🧠 Market Structure & Liquidity
Liquidity Sweep → Accumulation → Higher Lows → Breakout → Expansion → Retest → Consolidation → Continuation
SOL has moved through several important structural phases, recovering from the June low around $62.83, building higher lows, reclaiming the $100 area, and then breaking above the previous $110–$114 resistance region.
The current move toward $120 represents another expansion phase, with $119–$120 acting as the immediate decision zone.
📊 RSI Momentum
RSI: 70.46
RSI MA: 58.48
RSI has moved above 70, showing strong bullish momentum but also entering an overbought region.
This does not automatically mean a reversal. However, after the recent expansion, SOL could experience short-term consolidation or a pullback before attempting another leg higher.
The key will be whether RSI can remain elevated while price holds the $114–$119 structure.
🎯 Key Levels
Resistance:
$119.61 → $120 → $129.49 → $135.75 → $142.97 → $150.08 → $170.67 → $199.99
Support:
$114.35 → $113.71 → $112.58 → $112.25 → $111.04 → $109.84 → $106.05 → $104.38
Major EMA Support:
$104.38 / $96.19 / $92.89 / $90.15
📌 Final Outlook
SOL has strengthened considerably after reclaiming the $110–$114 region and pushing toward $120.
The key battle now is $119–$120.
A sustained breakout above this zone could open the path toward $129.49, followed by $135.75–$142.97 and the major $150.08 Fibonacci level.
On the downside, $111–$114 is the first major retest zone. Holding this area would keep the breakout structure intact, while a deeper move below $106.05–$104.38 would weaken the current setup.
Bias: Recovery structure remains strong above $104.38. A sustained breakout above $119–$120 could open the path toward $129.49, with $150.08 as the next major Fibonacci objective.
$SOL
The broader structure has improved significantly, with SOL reclaiming the $110–$114 area and now testing the $119–$120 resistance zone. A sustained breakout above this region would bring the higher Fibonacci levels back into focus.
📈 EMA Structure
20 EMA: $104.38
50 EMA: $96.19
100 EMA: $90.15
200 EMA: $92.89
SOL is trading significantly above all four major EMAs.
The 20 EMA remains above the 50 EMA, while the 50 EMA is also above the 200 EMA. This alignment reflects a strong recovery structure and improving medium-term trend.
The $104–$106 region is now an important deeper support zone, while the $110–$114 area has developed into a key structural support region after the recent breakout.
📐 Fibonacci Levels
0.236: $114.35
0.382: $129.49
0.5: $150.08
0.618: $170.67
0.786: $199.99
1.0: $237.33
SOL has reclaimed the 0.236 Fibonacci level around $114.35 and is now trading above it.
The next major Fibonacci resistance is $129.49, followed by $150.08.
🟢 Bullish Scenario
Immediate resistance is around:
$119.61 → $120
A clean breakout and sustained close above the $119–$120 zone could open the path toward:
$129.49 → $135.75 → $142.97 → $150.08
The $129.49 level is the next major Fibonacci resistance. A successful breakout and retest above $129.49 would strengthen the continuation structure and put the $150.08 level into focus.
Above $150.08, the higher Fibonacci references are:
$170.67 → $199.99 → $237.33
🔴 Pullback Scenario
Key support levels:
$114.35
$113.71
$112.58
$112.25
$111.04
$109.84
$106.05
$104.38
$96.19
$92.89
$90.15
The $111–$114 zone is particularly important.
A pullback into this area followed by a successful hold would keep the breakout structure constructive. Losing $109.84–$106.05 would indicate deeper consolidation, while a sustained move below the $104.38 20 EMA would significantly weaken the current recovery structure.
🧠 Market Structure & Liquidity
Liquidity Sweep → Accumulation → Higher Lows → Breakout → Expansion → Retest → Consolidation → Continuation
SOL has moved through several important structural phases, recovering from the June low around $62.83, building higher lows, reclaiming the $100 area, and then breaking above the previous $110–$114 resistance region.
The current move toward $120 represents another expansion phase, with $119–$120 acting as the immediate decision zone.
📊 RSI Momentum
RSI: 70.46
RSI MA: 58.48
RSI has moved above 70, showing strong bullish momentum but also entering an overbought region.
This does not automatically mean a reversal. However, after the recent expansion, SOL could experience short-term consolidation or a pullback before attempting another leg higher.
The key will be whether RSI can remain elevated while price holds the $114–$119 structure.
🎯 Key Levels
Resistance:
$119.61 → $120 → $129.49 → $135.75 → $142.97 → $150.08 → $170.67 → $199.99
Support:
$114.35 → $113.71 → $112.58 → $112.25 → $111.04 → $109.84 → $106.05 → $104.38
Major EMA Support:
$104.38 / $96.19 / $92.89 / $90.15
📌 Final Outlook
SOL has strengthened considerably after reclaiming the $110–$114 region and pushing toward $120.
The key battle now is $119–$120.
A sustained breakout above this zone could open the path toward $129.49, followed by $135.75–$142.97 and the major $150.08 Fibonacci level.
On the downside, $111–$114 is the first major retest zone. Holding this area would keep the breakout structure intact, while a deeper move below $106.05–$104.38 would weaken the current setup.
Bias: Recovery structure remains strong above $104.38. A sustained breakout above $119–$120 could open the path toward $129.49, with $150.08 as the next major Fibonacci objective.
$SOL
35
·
--
Məqalə
Tərcüməyə bax
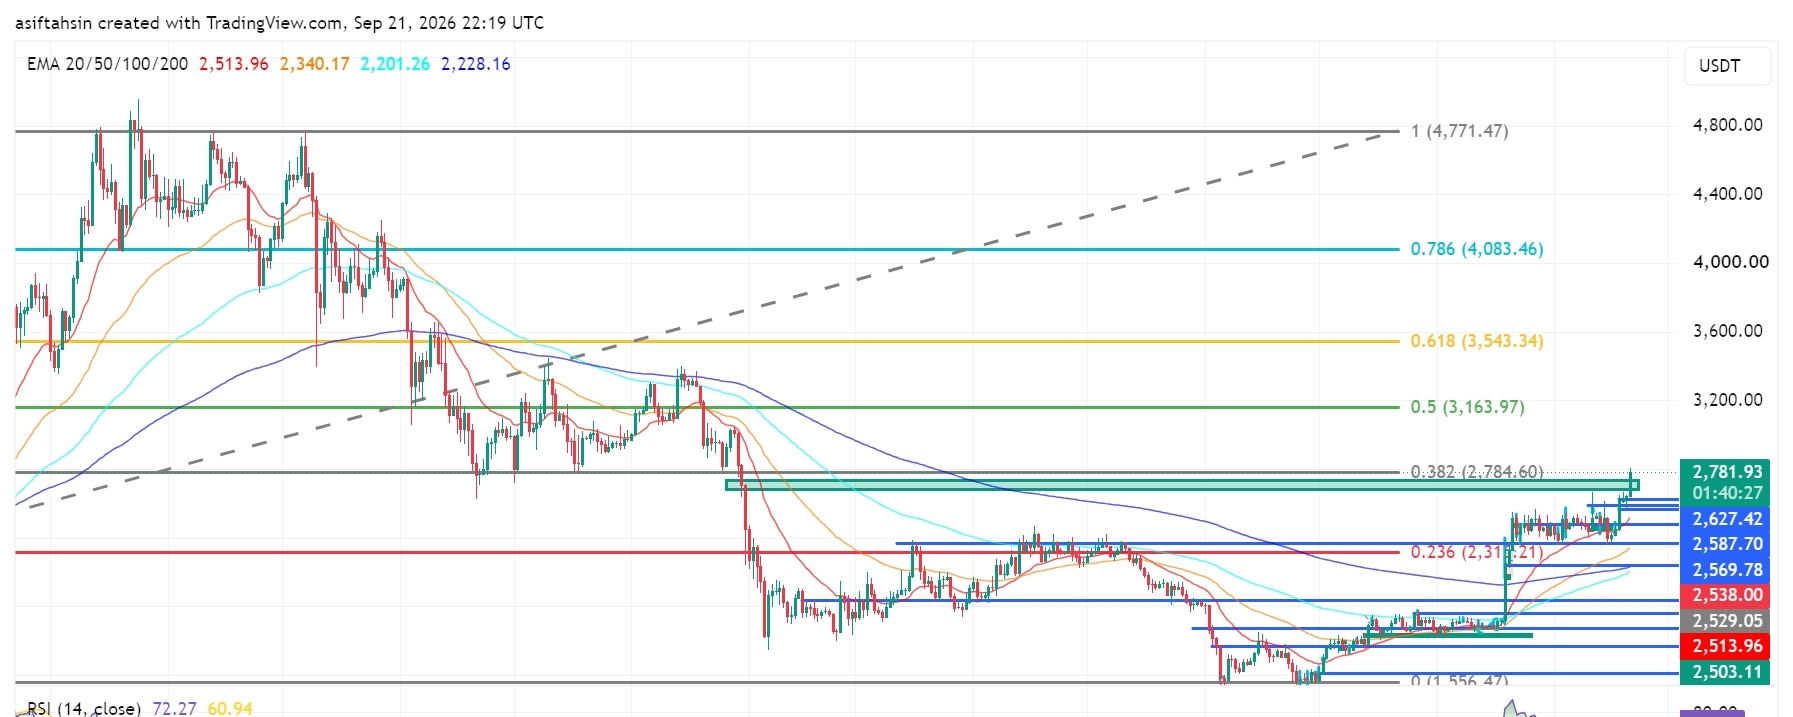
ETH Technical Outlook: Ethereum Reclaims $2.78K as Breakout Structure StrengthensETH is currently trading around $2,781.93, pushing into the major $2,784.60 Fibonacci resistance after a strong recovery from the $2,475–$2,500 area.
The broader structure has improved significantly, with ETH reclaiming the $2,500–$2,600 region and breaking above the previous consolidation range. A sustained breakout above $2,784.60 would bring the higher Fibonacci levels into focus.
📈 EMA Structure
20 EMA: $2,513.96
50 EMA: $2,340.17
100 EMA: $2,201.26
200 EMA: $2,228.16
ETH is trading well above all four major EMAs.
The 20 EMA remains above the 50 EMA, while the 100 EMA and 200 EMA are positioned significantly lower. This alignment reflects a strong recovery structure and improving medium-term momentum.
The $2,500–$2,540 region is now an important EMA/support zone.
📐 Fibonacci Levels
0.236: $2,315.21
0.382: $2,784.60
0.5: $3,163.97
0.618: $3,543.34
0.786: $4,083.46
1.0: $4,771.47
ETH is currently testing the 0.382 Fibonacci level at $2,784.60.
A clean breakout and sustained close above this level would shift attention toward $3,163.97, followed by the higher Fibonacci extensions.
🟢 Bullish Scenario
Immediate resistance sits around:
$2,784.60 → $2,800
A confirmed breakout above this area could open the path toward:
$3,163.97 → $3,543.34 → $4,083.46 → $4,771.47
The first major objective is the 0.5 Fibonacci level at $3,163.97. If ETH can establish support above $2,784.60 after the breakout, the recovery structure would become substantially stronger.
🔴 Pullback Scenario
Key support levels:
$2,672.47
$2,627.42
$2,587.70
$2,569.78
$2,538.00
$2,529.05
$2,513.96
$2,503.11
$2,479.06
$2,475.84
The $2,570–$2,630 zone is particularly important for a healthy retest.
Holding this area after a breakout would allow ETH to consolidate before another attempt higher. A deeper move below $2,500 would weaken the current breakout structure and bring the lower support zone back into focus.
🧠 Market Structure & Liquidity
Liquidity Sweep → Accumulation → Higher Lows → Breakout → Expansion → Retest → Consolidation → Continuation
ETH has transitioned from the prolonged decline into a clear recovery structure. The recent move above the $2,600–$2,670 region represents an important expansion phase, while the current move toward $2,784.60 is testing the next major structural resistance.
📊 RSI Momentum
RSI: 72.27
RSI MA: 60.94
RSI has moved above 70, showing strong momentum but also indicating that ETH is entering an overbought zone on this chart.
That does not automatically mean a reversal; however, after such a strong expansion, a short-term consolidation or pullback would be technically normal before another continuation attempt.
🎯 Key Levels
Resistance:
$2,784.60 → $2,800 → $3,163.97 → $3,543.34 → $4,083.46 → $4,771.47
Support:
$2,672.47 → $2,627.42 → $2,587.70 → $2,569.78 → $2,538 → $2,513.96 → $2,503.11 → $2,479.06
Major EMA Support:
$2,513.96 / $2,340.17 / $2,228.16 / $2,201.26
📌 Final Outlook
ETH has strengthened considerably after reclaiming the $2,500–$2,600 region and pushing toward the $2,784.60 Fibonacci resistance.
The key battle now is $2,784.60–$2,800.
A sustained breakout above this zone could open the path toward $3,163.97, followed by $3,543.34 and potentially $4,083.46.
On the downside, $2,570–$2,630 is the first major retest zone, while $2,500–$2,514 remains critical structural support.
Bias: Recovery structure remains strong above $2,500. A sustained breakout above $2,784.60 could open the path toward $3,163.97, with $3,543.34 as the next major Fibonacci level.
$ETH
{future}(ETHUSDT)
ETH Technical Outlook: Ethereum Reclaims $2.78K as Breakout Structure Strengthens
ETH is currently trading around $2,781.93, pushing into the major $2,784.60 Fibonacci resistance after a strong recovery from the $2,475–$2,500 area.
The broader structure has improved significantly, with ETH reclaiming the $2,500–$2,600 region and breaking above the previous consolidation range. A sustained breakout above $2,784.60 would bring the higher Fibonacci levels into focus.
📈 EMA Structure
20 EMA: $2,513.96
50 EMA: $2,340.17
100 EMA: $2,201.26
200 EMA: $2,228.16
ETH is trading well above all four major EMAs.
The 20 EMA remains above the 50 EMA, while the 100 EMA and 200 EMA are positioned significantly lower. This alignment reflects a strong recovery structure and improving medium-term momentum.
The $2,500–$2,540 region is now an important EMA/support zone.
📐 Fibonacci Levels
0.236: $2,315.21
0.382: $2,784.60
0.5: $3,163.97
0.618: $3,543.34
0.786: $4,083.46
1.0: $4,771.47
ETH is currently testing the 0.382 Fibonacci level at $2,784.60.
A clean breakout and sustained close above this level would shift attention toward $3,163.97, followed by the higher Fibonacci extensions.
🟢 Bullish Scenario
Immediate resistance sits around:
$2,784.60 → $2,800
A confirmed breakout above this area could open the path toward:
$3,163.97 → $3,543.34 → $4,083.46 → $4,771.47
The first major objective is the 0.5 Fibonacci level at $3,163.97. If ETH can establish support above $2,784.60 after the breakout, the recovery structure would become substantially stronger.
🔴 Pullback Scenario
Key support levels:
$2,672.47
$2,627.42
$2,587.70
$2,569.78
$2,538.00
$2,529.05
$2,513.96
$2,503.11
$2,479.06
$2,475.84
The $2,570–$2,630 zone is particularly important for a healthy retest.
Holding this area after a breakout would allow ETH to consolidate before another attempt higher. A deeper move below $2,500 would weaken the current breakout structure and bring the lower support zone back into focus.
🧠 Market Structure & Liquidity
Liquidity Sweep → Accumulation → Higher Lows → Breakout → Expansion → Retest → Consolidation → Continuation
ETH has transitioned from the prolonged decline into a clear recovery structure. The recent move above the $2,600–$2,670 region represents an important expansion phase, while the current move toward $2,784.60 is testing the next major structural resistance.
📊 RSI Momentum
RSI: 72.27
RSI MA: 60.94
RSI has moved above 70, showing strong momentum but also indicating that ETH is entering an overbought zone on this chart.
That does not automatically mean a reversal; however, after such a strong expansion, a short-term consolidation or pullback would be technically normal before another continuation attempt.
🎯 Key Levels
Resistance:
$2,784.60 → $2,800 → $3,163.97 → $3,543.34 → $4,083.46 → $4,771.47
Support:
$2,672.47 → $2,627.42 → $2,587.70 → $2,569.78 → $2,538 → $2,513.96 → $2,503.11 → $2,479.06
Major EMA Support:
$2,513.96 / $2,340.17 / $2,228.16 / $2,201.26
📌 Final Outlook
ETH has strengthened considerably after reclaiming the $2,500–$2,600 region and pushing toward the $2,784.60 Fibonacci resistance.
The key battle now is $2,784.60–$2,800.
A sustained breakout above this zone could open the path toward $3,163.97, followed by $3,543.34 and potentially $4,083.46.
On the downside, $2,570–$2,630 is the first major retest zone, while $2,500–$2,514 remains critical structural support.
Bias: Recovery structure remains strong above $2,500. A sustained breakout above $2,784.60 could open the path toward $3,163.97, with $3,543.34 as the next major Fibonacci level.
$ETH
The broader structure has improved significantly, with ETH reclaiming the $2,500–$2,600 region and breaking above the previous consolidation range. A sustained breakout above $2,784.60 would bring the higher Fibonacci levels into focus.
📈 EMA Structure
20 EMA: $2,513.96
50 EMA: $2,340.17
100 EMA: $2,201.26
200 EMA: $2,228.16
ETH is trading well above all four major EMAs.
The 20 EMA remains above the 50 EMA, while the 100 EMA and 200 EMA are positioned significantly lower. This alignment reflects a strong recovery structure and improving medium-term momentum.
The $2,500–$2,540 region is now an important EMA/support zone.
📐 Fibonacci Levels
0.236: $2,315.21
0.382: $2,784.60
0.5: $3,163.97
0.618: $3,543.34
0.786: $4,083.46
1.0: $4,771.47
ETH is currently testing the 0.382 Fibonacci level at $2,784.60.
A clean breakout and sustained close above this level would shift attention toward $3,163.97, followed by the higher Fibonacci extensions.
🟢 Bullish Scenario
Immediate resistance sits around:
$2,784.60 → $2,800
A confirmed breakout above this area could open the path toward:
$3,163.97 → $3,543.34 → $4,083.46 → $4,771.47
The first major objective is the 0.5 Fibonacci level at $3,163.97. If ETH can establish support above $2,784.60 after the breakout, the recovery structure would become substantially stronger.
🔴 Pullback Scenario
Key support levels:
$2,672.47
$2,627.42
$2,587.70
$2,569.78
$2,538.00
$2,529.05
$2,513.96
$2,503.11
$2,479.06
$2,475.84
The $2,570–$2,630 zone is particularly important for a healthy retest.
Holding this area after a breakout would allow ETH to consolidate before another attempt higher. A deeper move below $2,500 would weaken the current breakout structure and bring the lower support zone back into focus.
🧠 Market Structure & Liquidity
Liquidity Sweep → Accumulation → Higher Lows → Breakout → Expansion → Retest → Consolidation → Continuation
ETH has transitioned from the prolonged decline into a clear recovery structure. The recent move above the $2,600–$2,670 region represents an important expansion phase, while the current move toward $2,784.60 is testing the next major structural resistance.
📊 RSI Momentum
RSI: 72.27
RSI MA: 60.94
RSI has moved above 70, showing strong momentum but also indicating that ETH is entering an overbought zone on this chart.
That does not automatically mean a reversal; however, after such a strong expansion, a short-term consolidation or pullback would be technically normal before another continuation attempt.
🎯 Key Levels
Resistance:
$2,784.60 → $2,800 → $3,163.97 → $3,543.34 → $4,083.46 → $4,771.47
Support:
$2,672.47 → $2,627.42 → $2,587.70 → $2,569.78 → $2,538 → $2,513.96 → $2,503.11 → $2,479.06
Major EMA Support:
$2,513.96 / $2,340.17 / $2,228.16 / $2,201.26
📌 Final Outlook
ETH has strengthened considerably after reclaiming the $2,500–$2,600 region and pushing toward the $2,784.60 Fibonacci resistance.
The key battle now is $2,784.60–$2,800.
A sustained breakout above this zone could open the path toward $3,163.97, followed by $3,543.34 and potentially $4,083.46.
On the downside, $2,570–$2,630 is the first major retest zone, while $2,500–$2,514 remains critical structural support.
Bias: Recovery structure remains strong above $2,500. A sustained breakout above $2,784.60 could open the path toward $3,163.97, with $3,543.34 as the next major Fibonacci level.
$ETH
58
·
--
Məqalə
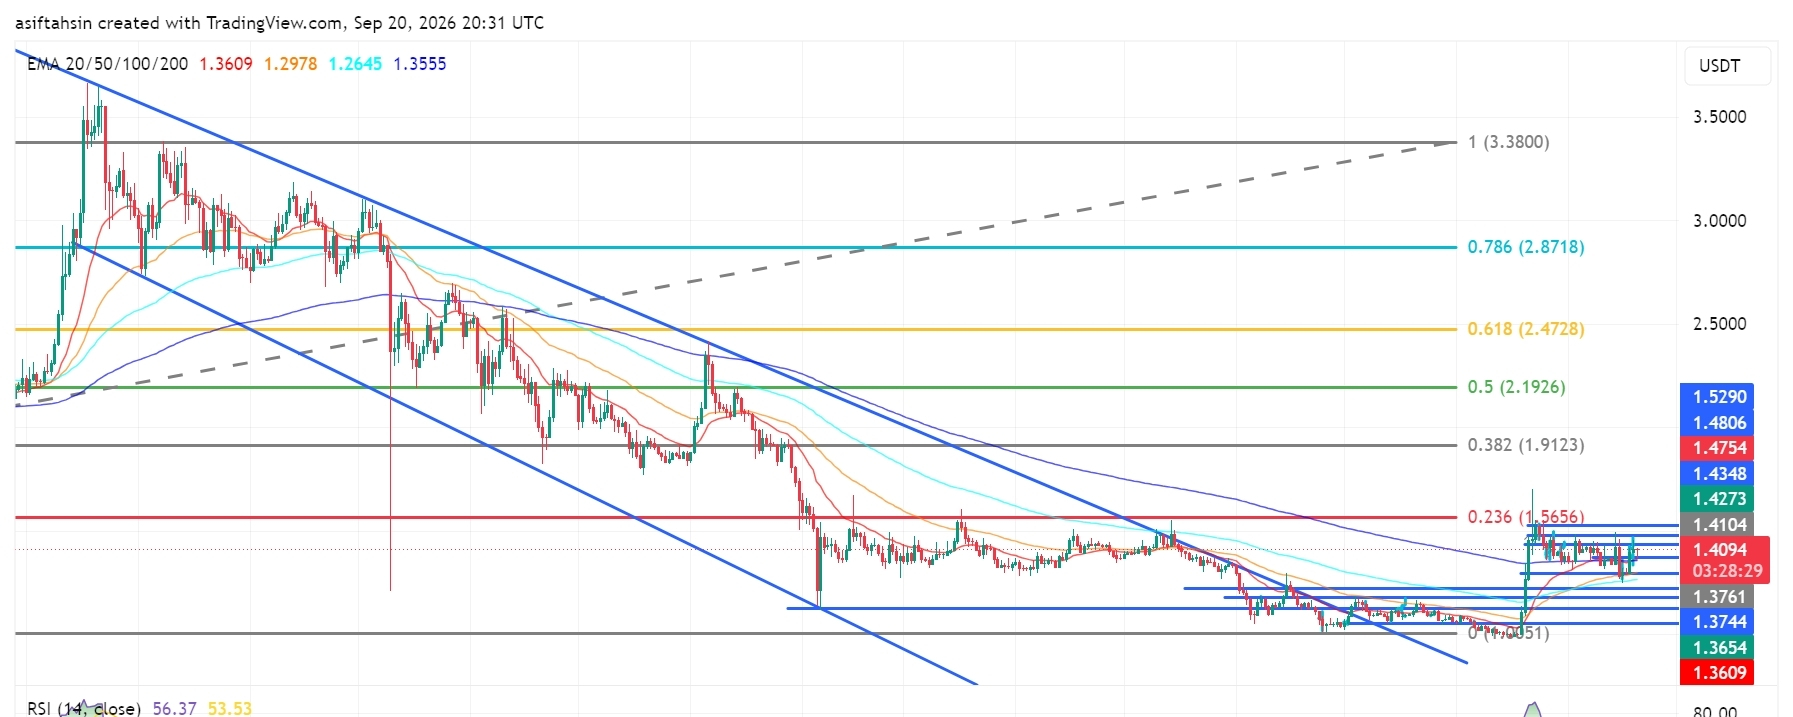
XRP Texniki Görünüşü: XRP 1.40$-ın Üstündə Qalır, Bərpa Strukturu GüclənirXRP Texniki Görünüşü: XRP 1.40$-ın Üstündə Qalır, Bərpa Strukturu Güclənir
XRP hazırda təxminən 1.41$ səviyyəsində ticarət edir, 1.25–1.30 dəstək zonasından son bərpadan sonra 1.37–1.40 aralığının üstündə qalır.
Ümumi struktur yaxşılaşıb: qiymət 1.40$ səmtini geri qaytarıb və əsas 1.41–1.48 müqavimət zonasına doğru yenidən hərəkət edib. Bu zonadan davamlı keçid daha yüksək Fibonacci səviyyələrini yenidən diqqət mərkəzinə gətirər.
Son bazar şərhləri də 1.40$ səmtinin mühüm müqavimət / geri qazanılma səviyyəsi kimi müəyyənləşdirib, baxmayaraq ki, qısamüddətli momentum bu zonanın ətrafında həssas olaraq qalır.
XRP Texniki Görünüşü: XRP 1.40$-ın Üstündə Qalır, Bərpa Strukturu Güclənir
XRP Texniki Görünüşü: XRP 1.40$-ın Üstündə Qalır, Bərpa Strukturu Güclənir
XRP hazırda təxminən 1.41$ səviyyəsində ticarət edir, 1.25–1.30 dəstək zonasından son bərpadan sonra 1.37–1.40 aralığının üstündə qalır.
Ümumi struktur yaxşılaşıb: qiymət 1.40$ səmtini geri qaytarıb və əsas 1.41–1.48 müqavimət zonasına doğru yenidən hərəkət edib. Bu zonadan davamlı keçid daha yüksək Fibonacci səviyyələrini yenidən diqqət mərkəzinə gətirər.
Son bazar şərhləri də 1.40$ səmtinin mühüm müqavimət / geri qazanılma səviyyəsi kimi müəyyənləşdirib, baxmayaraq ki, qısamüddətli momentum bu zonanın ətrafında həssas olaraq qalır.
XRP hazırda təxminən 1.41$ səviyyəsində ticarət edir, 1.25–1.30 dəstək zonasından son bərpadan sonra 1.37–1.40 aralığının üstündə qalır.
Ümumi struktur yaxşılaşıb: qiymət 1.40$ səmtini geri qaytarıb və əsas 1.41–1.48 müqavimət zonasına doğru yenidən hərəkət edib. Bu zonadan davamlı keçid daha yüksək Fibonacci səviyyələrini yenidən diqqət mərkəzinə gətirər.
Son bazar şərhləri də 1.40$ səmtinin mühüm müqavimət / geri qazanılma səviyyəsi kimi müəyyənləşdirib, baxmayaraq ki, qısamüddətli momentum bu zonanın ətrafında həssas olaraq qalır.
2
1.2k
·
--
Məqalə
Tərcüməyə bax
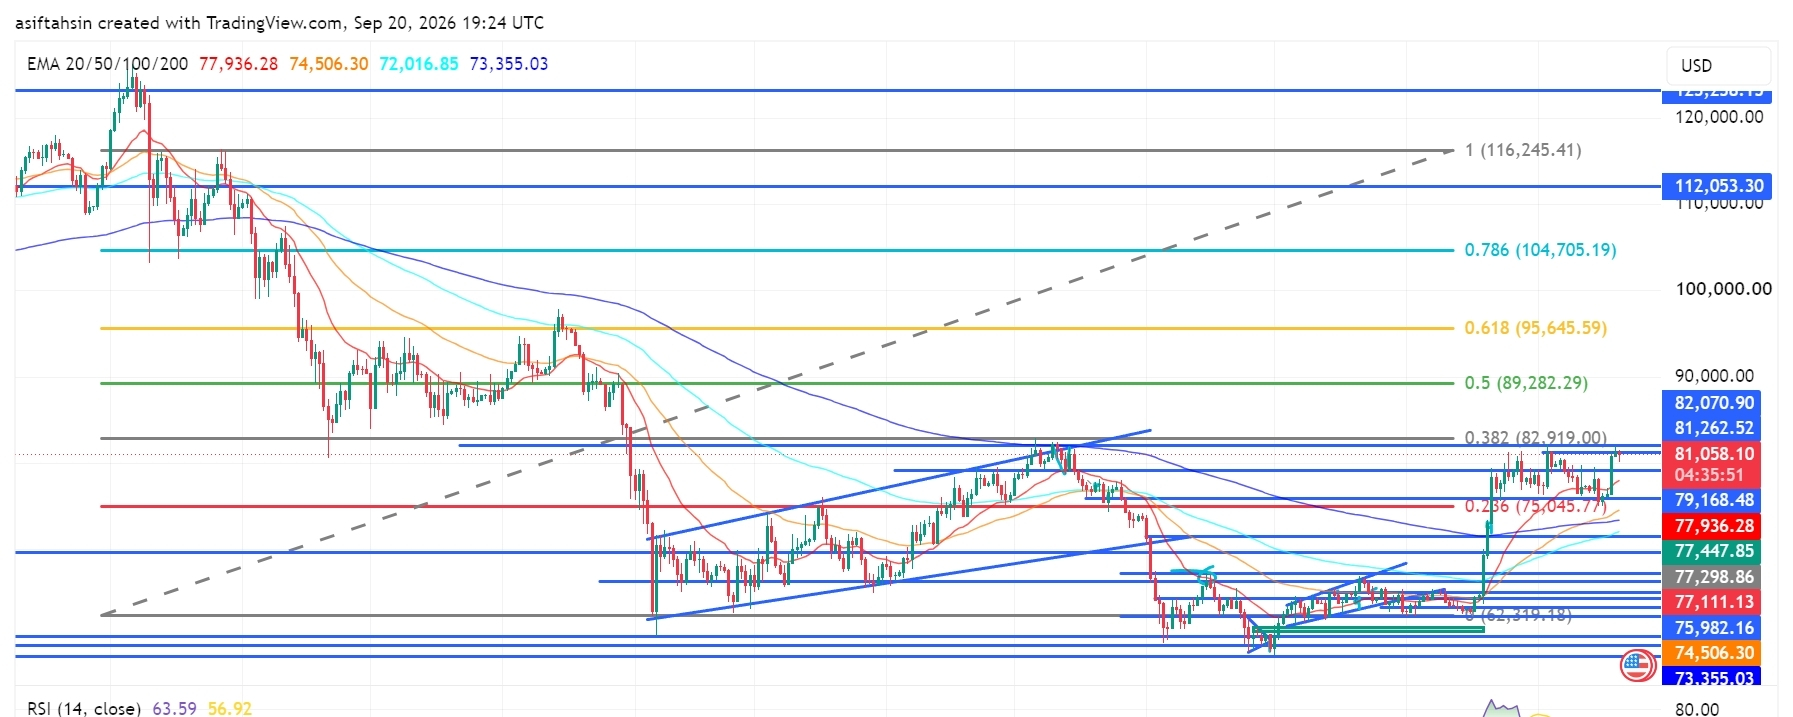
BTC Technical Outlook: Bitcoin Reclaims $81K as Recovery Structure StrengthensBTC is currently trading around $81,058, holding above the $79K–$80K region after the recent recovery from the $72K–$75K support area.
The broader structure has improved, with price reclaiming the $80K area and moving back toward the major $81.26K–$82.92K resistance zone. A sustained move through this area would put the higher Fibonacci levels back into focus.
📈 EMA Structure
20 EMA: $77,936.12
50 EMA: $74,506.24
100 EMA: $72,016.82
200 EMA: $73,355.02
BTC is currently trading well above the 20 EMA at $77,936.
The recovery above the 50 EMA at $74,506, 100 EMA at $72,016, and 200 EMA at $73,355 keeps the broader recovery structure constructive.
The 20 EMA remains above the longer-term EMA levels, showing improving short-term structure.
The $77.9K area remains an important dynamic support during any short-term pullback.
📐 Fibonacci Levels
Key Fibonacci levels:
0.236: $75,045.77
0.382: $82,919.00
0.5: $89,282.29
0.618: $95,645.59
0.786: $104,705.19
1.0: $116,245.41
BTC is currently trading above the 0.236 Fibonacci level at $75,045.77.
The next major Fibonacci reference is $82,919 — 0.382 Fib.
A sustained move above the $81K–$82.9K resistance area could bring $89,282 into focus, followed by $95,645.
🟢 Bullish Scenario
BTC has recovered strongly from the lower support structure and is now consolidating around $80K–$81K.
Immediate resistance:
$81,262.52
$82,070.90
$82,919.00 — 0.382 Fibonacci
$89,282.29 — 0.5 Fibonacci
$95,645.59 — 0.618 Fibonacci
A clean breakout and sustained close above $82K–$82.92K would provide stronger confirmation of continued recovery.
🎯 Target 1: $82,070.90
🎯 Target 2: $82,919.00 — 0.382 Fibonacci
🎯 Target 3: $89,282.29 — 0.5 Fibonacci
🎯 Target 4: $95,645.59 — 0.618 Fibonacci
🎯 Target 5: $104,705.19 — 0.786 Fibonacci
🎯 Target 6: $112,053.30
🎯 Target 7: $116,245.41 — 1.0 Fibonacci
A confirmed move through the $82.92K zone could strengthen the medium-term recovery structure and bring the $89K–$95K region into focus.
🔴 Pullback Scenario
After the recent expansion from the $75K region toward $81K, a retest of the breakout area would be normal.
Key supports:
$79,168.48
$77,936.12 — 20 EMA
$77,447.85
$77,298.86
$77,111.13
$75,982.16
$75,045.77 — 0.236 Fibonacci
$74,506.24 — 50 EMA
$73,355.02 — 200 EMA
$72,016.82 — 100 EMA
The $77K–$79K zone is particularly important.
If BTC continues to hold this area during a pullback, the current recovery structure remains active.
A sustained loss of $75,045 would weaken the current structure and bring the lower EMA support region back into focus.
🧠 Market Structure & Liquidity
BTC has formed a recovery structure after sweeping liquidity around the $72K–$75K region.
The recent move produced a strong recovery through $75K, followed by a breakout toward $80K–$81K.
BTC is now moving through an important:
Liquidity Sweep → Accumulation → Higher Lows → Breakout → Expansion → Retest → Consolidation → Continuation
structure.
The major upside liquidity and resistance are concentrated around the $81.26K–$82.92K region.
A decisive move through this area would place $89,282 as the next major Fibonacci reference.
📊 RSI Momentum
RSI (14): 63.59
RSI MA: 56.92
RSI has moved above the neutral 50 level and remains firmly in positive territory after the recent expansion.
The current reading around 63.59 shows stronger short-term momentum while remaining below the traditional 70 overbought threshold.
A sustained RSI above 60 would keep momentum supportive, while a move back below 50 would indicate increasing short-term weakness.
🎯 Key Levels
🔴 Major Resistance:
$81,262.52 → $82,070.90 → $82,919.00 → $89,282.29 → $95,645.59
🟢 Major Support:
$79,168.48 → $77,936.12 → $77,447.85 → $77,298.86 → $77,111.13 → $75,982.16 → $75,045.77
📉 Dynamic EMA Support:
$77,936.12 — 20 EMA | $74,506.24 — 50 EMA | $73,355.02 — 200 EMA | $72,016.82 — 100 EMA
🚀 Upside References:
$82,919 → $89,282 → $95,645 → $104,705 → $112,053 → $116,245
📌 Final Outlook
BTC's broader structure has strengthened after the recent recovery, with price now holding around $81K and above the major $75K–$79K support structure.
The $77K–$79K area is now an important short-term support region, while $81.26K–$82.92K remains the immediate major resistance zone.
A confirmed move above $82,919 could open the path toward $89,282, followed by $95,645 and $104,705.
However, rejection from the upper resistance area followed by a sustained loss of $75,045 would weaken the current recovery structure and bring the lower support zones back into focus.
Bias: 🟢 Recovery structure intact above $75,045. A sustained move above $82,919 could open the path toward $89,282, with $95,645 as the next major Fibonacci reference.
$BTC
{future}(BTCUSDT)
BTC Technical Outlook: Bitcoin Reclaims $81K as Recovery Structure Strengthens
BTC is currently trading around $81,058, holding above the $79K–$80K region after the recent recovery from the $72K–$75K support area.
The broader structure has improved, with price reclaiming the $80K area and moving back toward the major $81.26K–$82.92K resistance zone. A sustained move through this area would put the higher Fibonacci levels back into focus.
📈 EMA Structure
20 EMA: $77,936.12
50 EMA: $74,506.24
100 EMA: $72,016.82
200 EMA: $73,355.02
BTC is currently trading well above the 20 EMA at $77,936.
The recovery above the 50 EMA at $74,506, 100 EMA at $72,016, and 200 EMA at $73,355 keeps the broader recovery structure constructive.
The 20 EMA remains above the longer-term EMA levels, showing improving short-term structure.
The $77.9K area remains an important dynamic support during any short-term pullback.
📐 Fibonacci Levels
Key Fibonacci levels:
0.236: $75,045.77
0.382: $82,919.00
0.5: $89,282.29
0.618: $95,645.59
0.786: $104,705.19
1.0: $116,245.41
BTC is currently trading above the 0.236 Fibonacci level at $75,045.77.
The next major Fibonacci reference is $82,919 — 0.382 Fib.
A sustained move above the $81K–$82.9K resistance area could bring $89,282 into focus, followed by $95,645.
🟢 Bullish Scenario
BTC has recovered strongly from the lower support structure and is now consolidating around $80K–$81K.
Immediate resistance:
$81,262.52
$82,070.90
$82,919.00 — 0.382 Fibonacci
$89,282.29 — 0.5 Fibonacci
$95,645.59 — 0.618 Fibonacci
A clean breakout and sustained close above $82K–$82.92K would provide stronger confirmation of continued recovery.
🎯 Target 1: $82,070.90
🎯 Target 2: $82,919.00 — 0.382 Fibonacci
🎯 Target 3: $89,282.29 — 0.5 Fibonacci
🎯 Target 4: $95,645.59 — 0.618 Fibonacci
🎯 Target 5: $104,705.19 — 0.786 Fibonacci
🎯 Target 6: $112,053.30
🎯 Target 7: $116,245.41 — 1.0 Fibonacci
A confirmed move through the $82.92K zone could strengthen the medium-term recovery structure and bring the $89K–$95K region into focus.
🔴 Pullback Scenario
After the recent expansion from the $75K region toward $81K, a retest of the breakout area would be normal.
Key supports:
$79,168.48
$77,936.12 — 20 EMA
$77,447.85
$77,298.86
$77,111.13
$75,982.16
$75,045.77 — 0.236 Fibonacci
$74,506.24 — 50 EMA
$73,355.02 — 200 EMA
$72,016.82 — 100 EMA
The $77K–$79K zone is particularly important.
If BTC continues to hold this area during a pullback, the current recovery structure remains active.
A sustained loss of $75,045 would weaken the current structure and bring the lower EMA support region back into focus.
🧠 Market Structure & Liquidity
BTC has formed a recovery structure after sweeping liquidity around the $72K–$75K region.
The recent move produced a strong recovery through $75K, followed by a breakout toward $80K–$81K.
BTC is now moving through an important:
Liquidity Sweep → Accumulation → Higher Lows → Breakout → Expansion → Retest → Consolidation → Continuation
structure.
The major upside liquidity and resistance are concentrated around the $81.26K–$82.92K region.
A decisive move through this area would place $89,282 as the next major Fibonacci reference.
📊 RSI Momentum
RSI (14): 63.59
RSI MA: 56.92
RSI has moved above the neutral 50 level and remains firmly in positive territory after the recent expansion.
The current reading around 63.59 shows stronger short-term momentum while remaining below the traditional 70 overbought threshold.
A sustained RSI above 60 would keep momentum supportive, while a move back below 50 would indicate increasing short-term weakness.
🎯 Key Levels
🔴 Major Resistance:
$81,262.52 → $82,070.90 → $82,919.00 → $89,282.29 → $95,645.59
🟢 Major Support:
$79,168.48 → $77,936.12 → $77,447.85 → $77,298.86 → $77,111.13 → $75,982.16 → $75,045.77
📉 Dynamic EMA Support:
$77,936.12 — 20 EMA | $74,506.24 — 50 EMA | $73,355.02 — 200 EMA | $72,016.82 — 100 EMA
🚀 Upside References:
$82,919 → $89,282 → $95,645 → $104,705 → $112,053 → $116,245
📌 Final Outlook
BTC's broader structure has strengthened after the recent recovery, with price now holding around $81K and above the major $75K–$79K support structure.
The $77K–$79K area is now an important short-term support region, while $81.26K–$82.92K remains the immediate major resistance zone.
A confirmed move above $82,919 could open the path toward $89,282, followed by $95,645 and $104,705.
However, rejection from the upper resistance area followed by a sustained loss of $75,045 would weaken the current recovery structure and bring the lower support zones back into focus.
Bias: 🟢 Recovery structure intact above $75,045. A sustained move above $82,919 could open the path toward $89,282, with $95,645 as the next major Fibonacci reference.
$BTC
The broader structure has improved, with price reclaiming the $80K area and moving back toward the major $81.26K–$82.92K resistance zone. A sustained move through this area would put the higher Fibonacci levels back into focus.
📈 EMA Structure
20 EMA: $77,936.12
50 EMA: $74,506.24
100 EMA: $72,016.82
200 EMA: $73,355.02
BTC is currently trading well above the 20 EMA at $77,936.
The recovery above the 50 EMA at $74,506, 100 EMA at $72,016, and 200 EMA at $73,355 keeps the broader recovery structure constructive.
The 20 EMA remains above the longer-term EMA levels, showing improving short-term structure.
The $77.9K area remains an important dynamic support during any short-term pullback.
📐 Fibonacci Levels
Key Fibonacci levels:
0.236: $75,045.77
0.382: $82,919.00
0.5: $89,282.29
0.618: $95,645.59
0.786: $104,705.19
1.0: $116,245.41
BTC is currently trading above the 0.236 Fibonacci level at $75,045.77.
The next major Fibonacci reference is $82,919 — 0.382 Fib.
A sustained move above the $81K–$82.9K resistance area could bring $89,282 into focus, followed by $95,645.
🟢 Bullish Scenario
BTC has recovered strongly from the lower support structure and is now consolidating around $80K–$81K.
Immediate resistance:
$81,262.52
$82,070.90
$82,919.00 — 0.382 Fibonacci
$89,282.29 — 0.5 Fibonacci
$95,645.59 — 0.618 Fibonacci
A clean breakout and sustained close above $82K–$82.92K would provide stronger confirmation of continued recovery.
🎯 Target 1: $82,070.90
🎯 Target 2: $82,919.00 — 0.382 Fibonacci
🎯 Target 3: $89,282.29 — 0.5 Fibonacci
🎯 Target 4: $95,645.59 — 0.618 Fibonacci
🎯 Target 5: $104,705.19 — 0.786 Fibonacci
🎯 Target 6: $112,053.30
🎯 Target 7: $116,245.41 — 1.0 Fibonacci
A confirmed move through the $82.92K zone could strengthen the medium-term recovery structure and bring the $89K–$95K region into focus.
🔴 Pullback Scenario
After the recent expansion from the $75K region toward $81K, a retest of the breakout area would be normal.
Key supports:
$79,168.48
$77,936.12 — 20 EMA
$77,447.85
$77,298.86
$77,111.13
$75,982.16
$75,045.77 — 0.236 Fibonacci
$74,506.24 — 50 EMA
$73,355.02 — 200 EMA
$72,016.82 — 100 EMA
The $77K–$79K zone is particularly important.
If BTC continues to hold this area during a pullback, the current recovery structure remains active.
A sustained loss of $75,045 would weaken the current structure and bring the lower EMA support region back into focus.
🧠 Market Structure & Liquidity
BTC has formed a recovery structure after sweeping liquidity around the $72K–$75K region.
The recent move produced a strong recovery through $75K, followed by a breakout toward $80K–$81K.
BTC is now moving through an important:
Liquidity Sweep → Accumulation → Higher Lows → Breakout → Expansion → Retest → Consolidation → Continuation
structure.
The major upside liquidity and resistance are concentrated around the $81.26K–$82.92K region.
A decisive move through this area would place $89,282 as the next major Fibonacci reference.
📊 RSI Momentum
RSI (14): 63.59
RSI MA: 56.92
RSI has moved above the neutral 50 level and remains firmly in positive territory after the recent expansion.
The current reading around 63.59 shows stronger short-term momentum while remaining below the traditional 70 overbought threshold.
A sustained RSI above 60 would keep momentum supportive, while a move back below 50 would indicate increasing short-term weakness.
🎯 Key Levels
🔴 Major Resistance:
$81,262.52 → $82,070.90 → $82,919.00 → $89,282.29 → $95,645.59
🟢 Major Support:
$79,168.48 → $77,936.12 → $77,447.85 → $77,298.86 → $77,111.13 → $75,982.16 → $75,045.77
📉 Dynamic EMA Support:
$77,936.12 — 20 EMA | $74,506.24 — 50 EMA | $73,355.02 — 200 EMA | $72,016.82 — 100 EMA
🚀 Upside References:
$82,919 → $89,282 → $95,645 → $104,705 → $112,053 → $116,245
📌 Final Outlook
BTC's broader structure has strengthened after the recent recovery, with price now holding around $81K and above the major $75K–$79K support structure.
The $77K–$79K area is now an important short-term support region, while $81.26K–$82.92K remains the immediate major resistance zone.
A confirmed move above $82,919 could open the path toward $89,282, followed by $95,645 and $104,705.
However, rejection from the upper resistance area followed by a sustained loss of $75,045 would weaken the current recovery structure and bring the lower support zones back into focus.
Bias: 🟢 Recovery structure intact above $75,045. A sustained move above $82,919 could open the path toward $89,282, with $95,645 as the next major Fibonacci reference.
$BTC
43
·
--
Məqalə
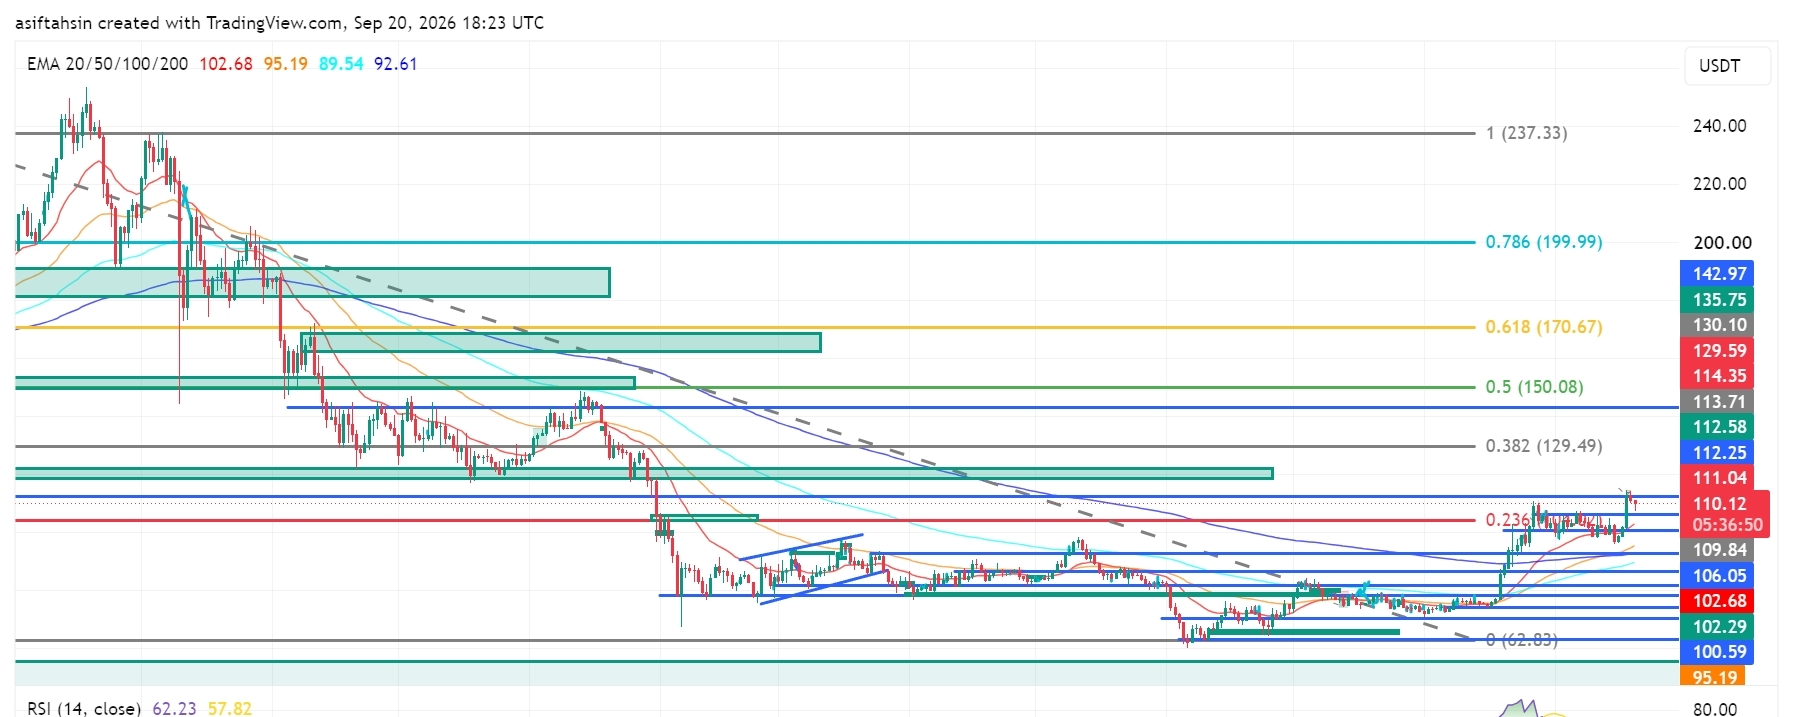
SOL Texniki Baxış: Solana Bərpa Strukturunun Güclənməsi ilə $110-u QaytarırSOL hazırda təxminən $110.1 civarında ticarət edir və yaxınlarda $92–$100 dəstək zonasından bərpa sonrası $106–$109 diapazonunun üstündə qalır.
Geniş struktur yaxşılaşıb: qiymət $100 səviyyəsini geri alıb və əsas $111–$114 müqavimət zonasına doğru hərəkət edir. Bu zonadan davamlı şəkildə yuxarı çıxış daha yüksək Fibonacçi səviyyələrini yenidən diqqətə gətirər.
📈 EMA Strukturu
20 EMA: $102.68
50 EMA: $95.19
100 EMA: $89.54
200 EMA: $92.61
SOL hazırda 20 EMA-dan xeyli yuxarıda, $102.68 səviyyəsində ticarət edir.
50 EMA-nın ($95.19), 100 EMA-nın ($89.54) və 200 EMA-nın ($92.61) üzərinə bərpa olunması bərpanın daha geniş strukturunu konstruktiv saxlayır.
SOL Texniki Baxış: Solana Bərpa Strukturunun Güclənməsi ilə $110-u Qaytarır
SOL hazırda təxminən $110.1 civarında ticarət edir və yaxınlarda $92–$100 dəstək zonasından bərpa sonrası $106–$109 diapazonunun üstündə qalır.
Geniş struktur yaxşılaşıb: qiymət $100 səviyyəsini geri alıb və əsas $111–$114 müqavimət zonasına doğru hərəkət edir. Bu zonadan davamlı şəkildə yuxarı çıxış daha yüksək Fibonacçi səviyyələrini yenidən diqqətə gətirər.
📈 EMA Strukturu
20 EMA: $102.68
50 EMA: $95.19
100 EMA: $89.54
200 EMA: $92.61
SOL hazırda 20 EMA-dan xeyli yuxarıda, $102.68 səviyyəsində ticarət edir.
50 EMA-nın ($95.19), 100 EMA-nın ($89.54) və 200 EMA-nın ($92.61) üzərinə bərpa olunması bərpanın daha geniş strukturunu konstruktiv saxlayır.
Geniş struktur yaxşılaşıb: qiymət $100 səviyyəsini geri alıb və əsas $111–$114 müqavimət zonasına doğru hərəkət edir. Bu zonadan davamlı şəkildə yuxarı çıxış daha yüksək Fibonacçi səviyyələrini yenidən diqqətə gətirər.
📈 EMA Strukturu
20 EMA: $102.68
50 EMA: $95.19
100 EMA: $89.54
200 EMA: $92.61
SOL hazırda 20 EMA-dan xeyli yuxarıda, $102.68 səviyyəsində ticarət edir.
50 EMA-nın ($95.19), 100 EMA-nın ($89.54) və 200 EMA-nın ($92.61) üzərinə bərpa olunması bərpanın daha geniş strukturunu konstruktiv saxlayır.
1.1k
·
--
Məqalə
Tərcüməyə bax
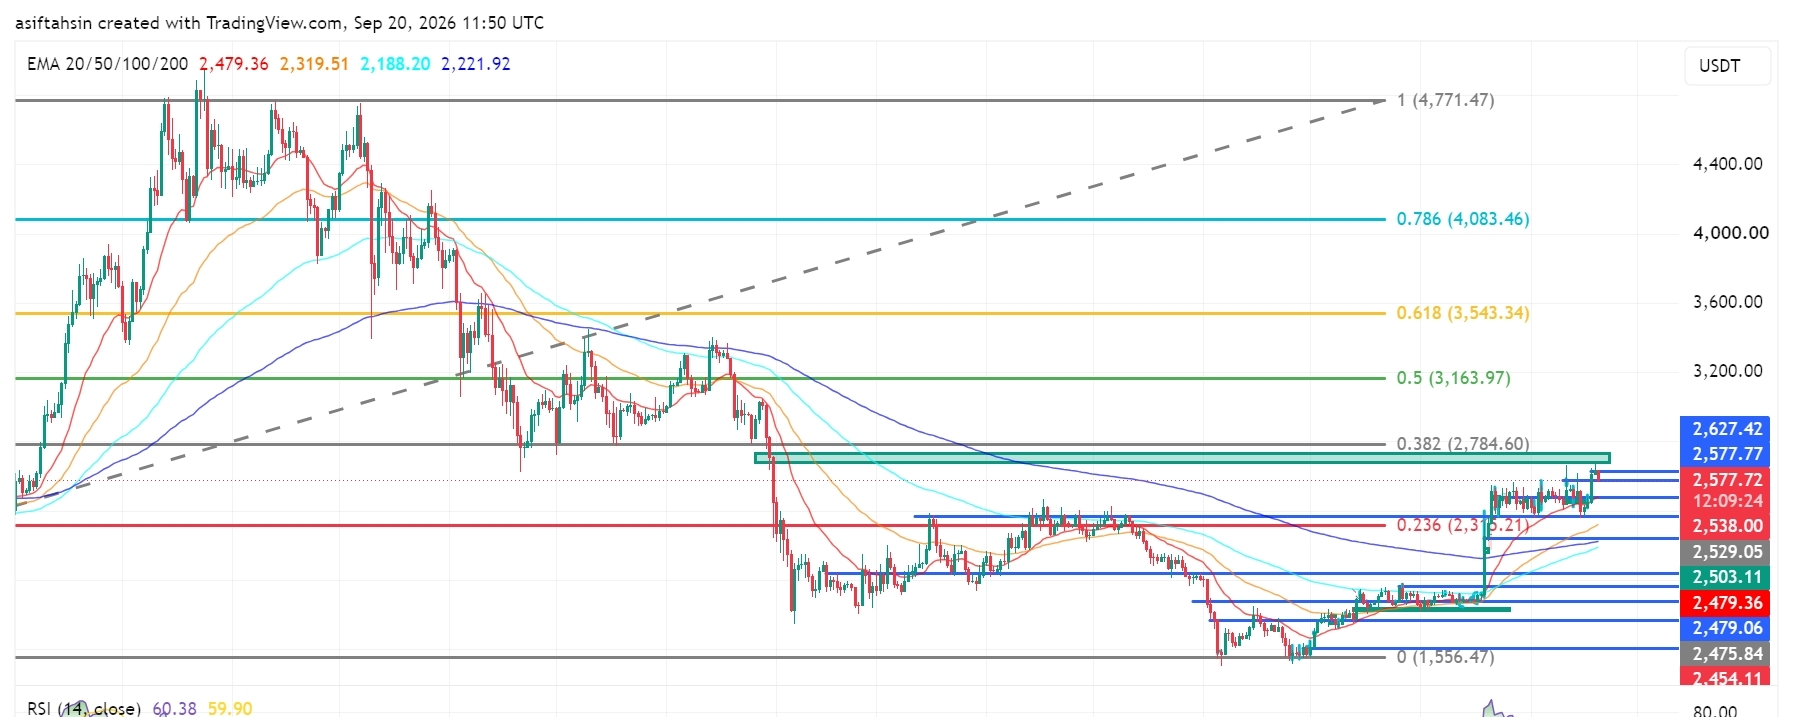
ETH Technical Outlook: Ethereum Holds Near $2.58K as Recovery ContinuesETH is currently trading around $2,577, holding above the $2,500–$2,540 support area after the recent recovery from the $2,280–$2,360 demand zone.
The broader recovery structure remains constructive, with price now approaching the important $2,627–$2,785 resistance zone. The $2,784.60 level is the major 0.382 Fibonacci reference on the chart.
📈 EMA Structure
20 EMA: $2,479.36
50 EMA: $2,319.51
100 EMA: $2,188.20
200 EMA: $2,221.92
ETH is currently trading well above the 20 EMA at $2,479.36.
The recovery above the 50 EMA at $2,319.51, 100 EMA at $2,188.20, and 200 EMA at $2,221.92 keeps the broader recovery structure constructive.
The 20 EMA is now acting as an important dynamic reference. A sustained hold above this level would keep the short-term structure supported.
📐 Fibonacci Levels
Key Fibonacci levels:
0.236: $2,315.21
0.382: $2,784.60
0.5: $3,163.97
0.618: $3,543.34
0.786: $4,083.46
1.0: $4,771.47
ETH has moved significantly above the 0.236 Fibonacci level at $2,315.21.
The next major Fibonacci resistance is $2,784.60 — 0.382 Fib.
A sustained move through the $2,627–$2,785 resistance structure would bring the higher Fibonacci levels into focus.
🟢 Upside Scenario
ETH is consolidating near $2,577 after the recent recovery and is now approaching the upper resistance structure.
Immediate resistance:
$2,577.77
$2,627.42
$2,784.60 — 0.382 Fibonacci
$3,163.97 — 0.5 Fibonacci
$3,543.34 — 0.618 Fibonacci
A clean breakout and sustained close above the $2,627–$2,785 zone would provide stronger confirmation of continued recovery.
🎯 Target 1: $2,627.42
🎯 Target 2: $2,784.60 — 0.382 Fibonacci
🎯 Target 3: $3,163.97 — 0.5 Fibonacci
🎯 Target 4: $3,543.34 — 0.618 Fibonacci
🎯 Target 5: $4,083.46 — 0.786 Fibonacci
🎯 Target 6: $4,771.47 — 1.0 Fibonacci
A sustained move above $2,784.60 could strengthen the medium-term recovery structure and bring the $3,164–$3,543 region into focus.
🔴 Pullback Scenario
After the recent expansion, a retest of the breakout area would be normal.
Key supports:
$2,538.00
$2,529.05
$2,503.11
$2,479.36 — 20 EMA
$2,479.06
$2,475.84
$2,454.11
$2,405.75
$2,319.51 — 50 EMA
The $2,475–$2,540 zone is particularly important.
If ETH continues to hold this area during a pullback, the current recovery structure remains active.
A sustained loss of the $2,475–$2,454 area would weaken the short-term structure and could expose the lower $2,405–$2,320 region.
🧠 Market Structure & Liquidity
ETH has formed a clear recovery structure after sweeping liquidity around the $2,280–$2,360 region.
The recent move produced a strong breakout from the previous consolidation and pushed price toward the $2,600 area.
ETH is now moving through an important:
Recovery → Breakout → Consolidation → Continuation
structure.
The major upside liquidity is concentrated around $2,627–$2,785. A decisive move through this zone would place $3,163.97 as the next major Fibonacci reference.
📊 RSI Momentum
RSI (14): 60.38
RSI remains above the neutral 50 level and is currently around 60, showing positive momentum.
The RSI signal line is around 59.90, keeping momentum relatively balanced near the 60 area.
A sustained RSI above 60 would support continued momentum, while a move back below 50 would indicate increasing short-term weakness.
🎯 Key Levels
🔴 Major Resistance: $2,627.42 → $2,784.60 → $3,163.97 → $3,543.34
🟢 Major Support: $2,538.00 → $2,529.05 → $2,503.11 → $2,479.36 → $2,454.11
📉 Dynamic EMA Support: $2,479.36 — 20 EMA | $2,319.51 — 50 EMA | $2,221.92 — 200 EMA | $2,188.20 — 100 EMA
🚀 Upside References: $2,784.60 → $3,163.97 → $3,543.34 → $4,083.46
📌 Final Outlook
ETH's broader structure remains constructive after the recent recovery, with price now holding around $2,577 and above the major $2,475–$2,540 support structure.
The $2,475–$2,540 area is now an important short-term support region, while $2,627–$2,785 remains the immediate major resistance zone.
A confirmed move above $2,784.60 could open the path toward $3,163.97, followed by $3,543.34 and potentially $4,083.46.
However, rejection from the upper resistance area followed by a sustained loss of $2,454.11 would weaken the current structure and bring the lower support zones back into focus.
Bias: 🟢 Recovery structure intact above $2,454.11. A sustained move above $2,784.60 could open the path toward $3,163.97, with $3,543.34 as the next major Fibonacci reference.
$ETH
{future}(ETHUSDT)
ETH Technical Outlook: Ethereum Holds Near $2.58K as Recovery Continues
ETH is currently trading around $2,577, holding above the $2,500–$2,540 support area after the recent recovery from the $2,280–$2,360 demand zone.
The broader recovery structure remains constructive, with price now approaching the important $2,627–$2,785 resistance zone. The $2,784.60 level is the major 0.382 Fibonacci reference on the chart.
📈 EMA Structure
20 EMA: $2,479.36
50 EMA: $2,319.51
100 EMA: $2,188.20
200 EMA: $2,221.92
ETH is currently trading well above the 20 EMA at $2,479.36.
The recovery above the 50 EMA at $2,319.51, 100 EMA at $2,188.20, and 200 EMA at $2,221.92 keeps the broader recovery structure constructive.
The 20 EMA is now acting as an important dynamic reference. A sustained hold above this level would keep the short-term structure supported.
📐 Fibonacci Levels
Key Fibonacci levels:
0.236: $2,315.21
0.382: $2,784.60
0.5: $3,163.97
0.618: $3,543.34
0.786: $4,083.46
1.0: $4,771.47
ETH has moved significantly above the 0.236 Fibonacci level at $2,315.21.
The next major Fibonacci resistance is $2,784.60 — 0.382 Fib.
A sustained move through the $2,627–$2,785 resistance structure would bring the higher Fibonacci levels into focus.
🟢 Upside Scenario
ETH is consolidating near $2,577 after the recent recovery and is now approaching the upper resistance structure.
Immediate resistance:
$2,577.77
$2,627.42
$2,784.60 — 0.382 Fibonacci
$3,163.97 — 0.5 Fibonacci
$3,543.34 — 0.618 Fibonacci
A clean breakout and sustained close above the $2,627–$2,785 zone would provide stronger confirmation of continued recovery.
🎯 Target 1: $2,627.42
🎯 Target 2: $2,784.60 — 0.382 Fibonacci
🎯 Target 3: $3,163.97 — 0.5 Fibonacci
🎯 Target 4: $3,543.34 — 0.618 Fibonacci
🎯 Target 5: $4,083.46 — 0.786 Fibonacci
🎯 Target 6: $4,771.47 — 1.0 Fibonacci
A sustained move above $2,784.60 could strengthen the medium-term recovery structure and bring the $3,164–$3,543 region into focus.
🔴 Pullback Scenario
After the recent expansion, a retest of the breakout area would be normal.
Key supports:
$2,538.00
$2,529.05
$2,503.11
$2,479.36 — 20 EMA
$2,479.06
$2,475.84
$2,454.11
$2,405.75
$2,319.51 — 50 EMA
The $2,475–$2,540 zone is particularly important.
If ETH continues to hold this area during a pullback, the current recovery structure remains active.
A sustained loss of the $2,475–$2,454 area would weaken the short-term structure and could expose the lower $2,405–$2,320 region.
🧠 Market Structure & Liquidity
ETH has formed a clear recovery structure after sweeping liquidity around the $2,280–$2,360 region.
The recent move produced a strong breakout from the previous consolidation and pushed price toward the $2,600 area.
ETH is now moving through an important:
Recovery → Breakout → Consolidation → Continuation
structure.
The major upside liquidity is concentrated around $2,627–$2,785. A decisive move through this zone would place $3,163.97 as the next major Fibonacci reference.
📊 RSI Momentum
RSI (14): 60.38
RSI remains above the neutral 50 level and is currently around 60, showing positive momentum.
The RSI signal line is around 59.90, keeping momentum relatively balanced near the 60 area.
A sustained RSI above 60 would support continued momentum, while a move back below 50 would indicate increasing short-term weakness.
🎯 Key Levels
🔴 Major Resistance: $2,627.42 → $2,784.60 → $3,163.97 → $3,543.34
🟢 Major Support: $2,538.00 → $2,529.05 → $2,503.11 → $2,479.36 → $2,454.11
📉 Dynamic EMA Support: $2,479.36 — 20 EMA | $2,319.51 — 50 EMA | $2,221.92 — 200 EMA | $2,188.20 — 100 EMA
🚀 Upside References: $2,784.60 → $3,163.97 → $3,543.34 → $4,083.46
📌 Final Outlook
ETH's broader structure remains constructive after the recent recovery, with price now holding around $2,577 and above the major $2,475–$2,540 support structure.
The $2,475–$2,540 area is now an important short-term support region, while $2,627–$2,785 remains the immediate major resistance zone.
A confirmed move above $2,784.60 could open the path toward $3,163.97, followed by $3,543.34 and potentially $4,083.46.
However, rejection from the upper resistance area followed by a sustained loss of $2,454.11 would weaken the current structure and bring the lower support zones back into focus.
Bias: 🟢 Recovery structure intact above $2,454.11. A sustained move above $2,784.60 could open the path toward $3,163.97, with $3,543.34 as the next major Fibonacci reference.
$ETH
The broader recovery structure remains constructive, with price now approaching the important $2,627–$2,785 resistance zone. The $2,784.60 level is the major 0.382 Fibonacci reference on the chart.
📈 EMA Structure
20 EMA: $2,479.36
50 EMA: $2,319.51
100 EMA: $2,188.20
200 EMA: $2,221.92
ETH is currently trading well above the 20 EMA at $2,479.36.
The recovery above the 50 EMA at $2,319.51, 100 EMA at $2,188.20, and 200 EMA at $2,221.92 keeps the broader recovery structure constructive.
The 20 EMA is now acting as an important dynamic reference. A sustained hold above this level would keep the short-term structure supported.
📐 Fibonacci Levels
Key Fibonacci levels:
0.236: $2,315.21
0.382: $2,784.60
0.5: $3,163.97
0.618: $3,543.34
0.786: $4,083.46
1.0: $4,771.47
ETH has moved significantly above the 0.236 Fibonacci level at $2,315.21.
The next major Fibonacci resistance is $2,784.60 — 0.382 Fib.
A sustained move through the $2,627–$2,785 resistance structure would bring the higher Fibonacci levels into focus.
🟢 Upside Scenario
ETH is consolidating near $2,577 after the recent recovery and is now approaching the upper resistance structure.
Immediate resistance:
$2,577.77
$2,627.42
$2,784.60 — 0.382 Fibonacci
$3,163.97 — 0.5 Fibonacci
$3,543.34 — 0.618 Fibonacci
A clean breakout and sustained close above the $2,627–$2,785 zone would provide stronger confirmation of continued recovery.
🎯 Target 1: $2,627.42
🎯 Target 2: $2,784.60 — 0.382 Fibonacci
🎯 Target 3: $3,163.97 — 0.5 Fibonacci
🎯 Target 4: $3,543.34 — 0.618 Fibonacci
🎯 Target 5: $4,083.46 — 0.786 Fibonacci
🎯 Target 6: $4,771.47 — 1.0 Fibonacci
A sustained move above $2,784.60 could strengthen the medium-term recovery structure and bring the $3,164–$3,543 region into focus.
🔴 Pullback Scenario
After the recent expansion, a retest of the breakout area would be normal.
Key supports:
$2,538.00
$2,529.05
$2,503.11
$2,479.36 — 20 EMA
$2,479.06
$2,475.84
$2,454.11
$2,405.75
$2,319.51 — 50 EMA
The $2,475–$2,540 zone is particularly important.
If ETH continues to hold this area during a pullback, the current recovery structure remains active.
A sustained loss of the $2,475–$2,454 area would weaken the short-term structure and could expose the lower $2,405–$2,320 region.
🧠 Market Structure & Liquidity
ETH has formed a clear recovery structure after sweeping liquidity around the $2,280–$2,360 region.
The recent move produced a strong breakout from the previous consolidation and pushed price toward the $2,600 area.
ETH is now moving through an important:
Recovery → Breakout → Consolidation → Continuation
structure.
The major upside liquidity is concentrated around $2,627–$2,785. A decisive move through this zone would place $3,163.97 as the next major Fibonacci reference.
📊 RSI Momentum
RSI (14): 60.38
RSI remains above the neutral 50 level and is currently around 60, showing positive momentum.
The RSI signal line is around 59.90, keeping momentum relatively balanced near the 60 area.
A sustained RSI above 60 would support continued momentum, while a move back below 50 would indicate increasing short-term weakness.
🎯 Key Levels
🔴 Major Resistance: $2,627.42 → $2,784.60 → $3,163.97 → $3,543.34
🟢 Major Support: $2,538.00 → $2,529.05 → $2,503.11 → $2,479.36 → $2,454.11
📉 Dynamic EMA Support: $2,479.36 — 20 EMA | $2,319.51 — 50 EMA | $2,221.92 — 200 EMA | $2,188.20 — 100 EMA
🚀 Upside References: $2,784.60 → $3,163.97 → $3,543.34 → $4,083.46
📌 Final Outlook
ETH's broader structure remains constructive after the recent recovery, with price now holding around $2,577 and above the major $2,475–$2,540 support structure.
The $2,475–$2,540 area is now an important short-term support region, while $2,627–$2,785 remains the immediate major resistance zone.
A confirmed move above $2,784.60 could open the path toward $3,163.97, followed by $3,543.34 and potentially $4,083.46.
However, rejection from the upper resistance area followed by a sustained loss of $2,454.11 would weaken the current structure and bring the lower support zones back into focus.
Bias: 🟢 Recovery structure intact above $2,454.11. A sustained move above $2,784.60 could open the path toward $3,163.97, with $3,543.34 as the next major Fibonacci reference.
$ETH
65
·
--
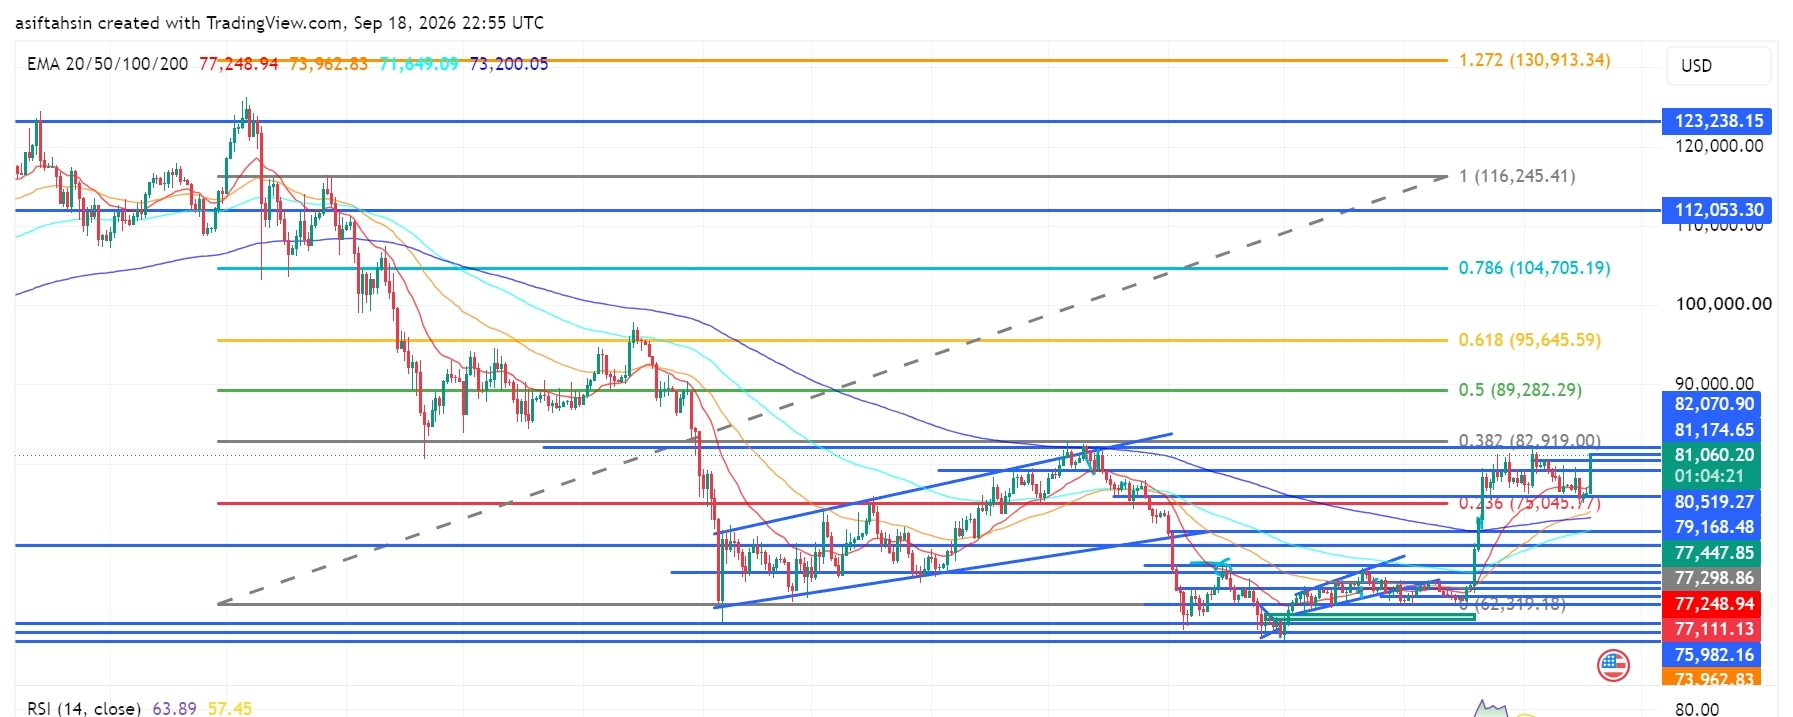
Məqalə
Tərcüməyə bax
BTC Technical Outlook: Bitcoin Reclaims $81K as Recovery Structure StrengthensBTC is currently trading around $81,060, holding above the $79,000–$80,000 region after the recent recovery from the $73,000–$76,000 demand area.
The broader structure has improved, with price reclaiming the $80K area and moving back toward the major $82,070–$82,919 resistance zone. A sustained move through this area would put the higher Fibonacci levels back into focus.
📈 EMA Structure
20 EMA: $77,248.95
50 EMA: $73,962.83
100 EMA: $71,649.09
200 EMA: $73,200.05
BTC is currently trading well above the 20 EMA at $77,248.95.
The recovery above the 50 EMA at $73,962.83, 100 EMA at $71,649.09, and 200 EMA at $73,200.05 keeps the broader recovery structure constructive.
The 20 EMA has moved above the longer-term EMA levels, showing improving short-term structure.
📐 Fibonacci Levels
Key Fibonacci levels:
0.236: $75,045.77
0.382: $82,919.00
0.5: $89,282.29
0.618: $95,645.59
0.786: $104,705.19
1.0: $116,245.41
1.272: $130,913.34
BTC is currently trading between the 0.236 and 0.382 Fibonacci levels.
The next major Fibonacci reference is $82,919 — 0.382 Fib.
A sustained move above the $82,070–$82,919 zone could bring $89,282 into focus, followed by $95,645.
🟢 Bullish Scenario
BTC has recovered strongly from the lower support structure and is now consolidating around $80K–$81K.
Immediate resistance:
$81,174.65
$82,070.90
$82,919.00 — 0.382 Fibonacci
$89,282.29 — 0.5 Fibonacci
$95,645.59 — 0.618 Fibonacci
A clean breakout and sustained close above $82,070–$82,919 would provide stronger confirmation of continued recovery.
🎯 Target 1: $82,070
🎯 Target 2: $82,919 — 0.382 Fibonacci
🎯 Target 3: $89,282 — 0.5 Fibonacci
🎯 Target 4: $95,645 — 0.618 Fibonacci
🎯 Target 5: $104,705 — 0.786 Fibonacci
🎯 Target 6: $116,245 — 1.0 Fibonacci
A confirmed move through the $82K–$83K zone could strengthen the medium-term recovery structure and bring the $89K–$95K region into focus.
🔴 Pullback Scenario
After the recent expansion above $80K, a retest of the breakout area would be normal.
Key supports:
$80,519.27
$79,168.48
$77,447.85
$77,298.86
$77,248.95 — 20 EMA
$77,111.13
$75,982.16
$75,045.77 — 0.236 Fibonacci
$73,962.83 — 50 EMA
$73,200.05 — 200 EMA
The $77K–$80K zone is particularly important.
If BTC continues to hold this area during a pullback, the current recovery structure remains active.
A sustained loss of $75,045 would weaken the current recovery structure and bring the lower EMA region back into focus.
🧠 Market Structure & Liquidity
BTC has formed a recovery structure after sweeping liquidity around the $73K–$76K region.
The recent move produced a strong recovery through $77K, followed by a breakout above $80K.
BTC is now moving through an important:
Recovery → Breakout → Retest → Consolidation → Continuation
structure.
The major upside liquidity is concentrated around $81K–$83K. A decisive move through this area would place $89,282 as the next major Fibonacci reference.
📊 RSI Momentum
RSI (14): 63.89
RSI has moved above the neutral 50 level and remains in positive territory after the recent expansion.
The current reading shows stronger short-term momentum, while still remaining below the traditional 70 overbought threshold.
A sustained RSI above 60 would keep momentum supportive, while a move back below 50 would indicate increasing short-term weakness.
🎯 Key Levels
🔴 Major Resistance: $81,174.65 → $82,070.90 → $82,919 → $89,282 → $95,645
🟢 Major Support: $80,519 → $79,168 → $77,447 → $77,249 → $75,982 → $75,045
📉 Dynamic EMA Support: $77,248.95 — 20 EMA | $73,962.83 — 50 EMA | $73,200.05 — 200 EMA | $71,649.09 — 100 EMA
🚀 Upside References: $82,919 → $89,282 → $95,645 → $104,705 → $116,245
📌 Final Outlook
BTC's broader structure has strengthened after the recent recovery, with price now holding around $81K and above the major $77K–$80K support structure.
The $77K–$80K area is now an important short-term support region, while $82K–$83K remains the immediate major resistance zone.
A confirmed move above $82,919 could open the path toward $89,282, followed by $95,645 and $104,705.
However, rejection from the upper resistance area followed by a sustained loss of $75,045 would weaken the current recovery structure and bring the lower support zones back into focus.
Bias: 🟢 Recovery structure intact above $75,045. A sustained move above $82,919 could open the path toward $89,282, with $95,645 as the next major Fibonacci reference.
$BTC
{future}(BTCUSDT)
BTC Technical Outlook: Bitcoin Reclaims $81K as Recovery Structure Strengthens
BTC is currently trading around $81,060, holding above the $79,000–$80,000 region after the recent recovery from the $73,000–$76,000 demand area.
The broader structure has improved, with price reclaiming the $80K area and moving back toward the major $82,070–$82,919 resistance zone. A sustained move through this area would put the higher Fibonacci levels back into focus.
📈 EMA Structure
20 EMA: $77,248.95
50 EMA: $73,962.83
100 EMA: $71,649.09
200 EMA: $73,200.05
BTC is currently trading well above the 20 EMA at $77,248.95.
The recovery above the 50 EMA at $73,962.83, 100 EMA at $71,649.09, and 200 EMA at $73,200.05 keeps the broader recovery structure constructive.
The 20 EMA has moved above the longer-term EMA levels, showing improving short-term structure.
📐 Fibonacci Levels
Key Fibonacci levels:
0.236: $75,045.77
0.382: $82,919.00
0.5: $89,282.29
0.618: $95,645.59
0.786: $104,705.19
1.0: $116,245.41
1.272: $130,913.34
BTC is currently trading between the 0.236 and 0.382 Fibonacci levels.
The next major Fibonacci reference is $82,919 — 0.382 Fib.
A sustained move above the $82,070–$82,919 zone could bring $89,282 into focus, followed by $95,645.
🟢 Bullish Scenario
BTC has recovered strongly from the lower support structure and is now consolidating around $80K–$81K.
Immediate resistance:
$81,174.65
$82,070.90
$82,919.00 — 0.382 Fibonacci
$89,282.29 — 0.5 Fibonacci
$95,645.59 — 0.618 Fibonacci
A clean breakout and sustained close above $82,070–$82,919 would provide stronger confirmation of continued recovery.
🎯 Target 1: $82,070
🎯 Target 2: $82,919 — 0.382 Fibonacci
🎯 Target 3: $89,282 — 0.5 Fibonacci
🎯 Target 4: $95,645 — 0.618 Fibonacci
🎯 Target 5: $104,705 — 0.786 Fibonacci
🎯 Target 6: $116,245 — 1.0 Fibonacci
A confirmed move through the $82K–$83K zone could strengthen the medium-term recovery structure and bring the $89K–$95K region into focus.
🔴 Pullback Scenario
After the recent expansion above $80K, a retest of the breakout area would be normal.
Key supports:
$80,519.27
$79,168.48
$77,447.85
$77,298.86
$77,248.95 — 20 EMA
$77,111.13
$75,982.16
$75,045.77 — 0.236 Fibonacci
$73,962.83 — 50 EMA
$73,200.05 — 200 EMA
The $77K–$80K zone is particularly important.
If BTC continues to hold this area during a pullback, the current recovery structure remains active.
A sustained loss of $75,045 would weaken the current recovery structure and bring the lower EMA region back into focus.
🧠 Market Structure & Liquidity
BTC has formed a recovery structure after sweeping liquidity around the $73K–$76K region.
The recent move produced a strong recovery through $77K, followed by a breakout above $80K.
BTC is now moving through an important:
Recovery → Breakout → Retest → Consolidation → Continuation
structure.
The major upside liquidity is concentrated around $81K–$83K. A decisive move through this area would place $89,282 as the next major Fibonacci reference.
📊 RSI Momentum
RSI (14): 63.89
RSI has moved above the neutral 50 level and remains in positive territory after the recent expansion.
The current reading shows stronger short-term momentum, while still remaining below the traditional 70 overbought threshold.
A sustained RSI above 60 would keep momentum supportive, while a move back below 50 would indicate increasing short-term weakness.
🎯 Key Levels
🔴 Major Resistance: $81,174.65 → $82,070.90 → $82,919 → $89,282 → $95,645
🟢 Major Support: $80,519 → $79,168 → $77,447 → $77,249 → $75,982 → $75,045
📉 Dynamic EMA Support: $77,248.95 — 20 EMA | $73,962.83 — 50 EMA | $73,200.05 — 200 EMA | $71,649.09 — 100 EMA
🚀 Upside References: $82,919 → $89,282 → $95,645 → $104,705 → $116,245
📌 Final Outlook
BTC's broader structure has strengthened after the recent recovery, with price now holding around $81K and above the major $77K–$80K support structure.
The $77K–$80K area is now an important short-term support region, while $82K–$83K remains the immediate major resistance zone.
A confirmed move above $82,919 could open the path toward $89,282, followed by $95,645 and $104,705.
However, rejection from the upper resistance area followed by a sustained loss of $75,045 would weaken the current recovery structure and bring the lower support zones back into focus.
Bias: 🟢 Recovery structure intact above $75,045. A sustained move above $82,919 could open the path toward $89,282, with $95,645 as the next major Fibonacci reference.
$BTC
The broader structure has improved, with price reclaiming the $80K area and moving back toward the major $82,070–$82,919 resistance zone. A sustained move through this area would put the higher Fibonacci levels back into focus.
📈 EMA Structure
20 EMA: $77,248.95
50 EMA: $73,962.83
100 EMA: $71,649.09
200 EMA: $73,200.05
BTC is currently trading well above the 20 EMA at $77,248.95.
The recovery above the 50 EMA at $73,962.83, 100 EMA at $71,649.09, and 200 EMA at $73,200.05 keeps the broader recovery structure constructive.
The 20 EMA has moved above the longer-term EMA levels, showing improving short-term structure.
📐 Fibonacci Levels
Key Fibonacci levels:
0.236: $75,045.77
0.382: $82,919.00
0.5: $89,282.29
0.618: $95,645.59
0.786: $104,705.19
1.0: $116,245.41
1.272: $130,913.34
BTC is currently trading between the 0.236 and 0.382 Fibonacci levels.
The next major Fibonacci reference is $82,919 — 0.382 Fib.
A sustained move above the $82,070–$82,919 zone could bring $89,282 into focus, followed by $95,645.
🟢 Bullish Scenario
BTC has recovered strongly from the lower support structure and is now consolidating around $80K–$81K.
Immediate resistance:
$81,174.65
$82,070.90
$82,919.00 — 0.382 Fibonacci
$89,282.29 — 0.5 Fibonacci
$95,645.59 — 0.618 Fibonacci
A clean breakout and sustained close above $82,070–$82,919 would provide stronger confirmation of continued recovery.
🎯 Target 1: $82,070
🎯 Target 2: $82,919 — 0.382 Fibonacci
🎯 Target 3: $89,282 — 0.5 Fibonacci
🎯 Target 4: $95,645 — 0.618 Fibonacci
🎯 Target 5: $104,705 — 0.786 Fibonacci
🎯 Target 6: $116,245 — 1.0 Fibonacci
A confirmed move through the $82K–$83K zone could strengthen the medium-term recovery structure and bring the $89K–$95K region into focus.
🔴 Pullback Scenario
After the recent expansion above $80K, a retest of the breakout area would be normal.
Key supports:
$80,519.27
$79,168.48
$77,447.85
$77,298.86
$77,248.95 — 20 EMA
$77,111.13
$75,982.16
$75,045.77 — 0.236 Fibonacci
$73,962.83 — 50 EMA
$73,200.05 — 200 EMA
The $77K–$80K zone is particularly important.
If BTC continues to hold this area during a pullback, the current recovery structure remains active.
A sustained loss of $75,045 would weaken the current recovery structure and bring the lower EMA region back into focus.
🧠 Market Structure & Liquidity
BTC has formed a recovery structure after sweeping liquidity around the $73K–$76K region.
The recent move produced a strong recovery through $77K, followed by a breakout above $80K.
BTC is now moving through an important:
Recovery → Breakout → Retest → Consolidation → Continuation
structure.
The major upside liquidity is concentrated around $81K–$83K. A decisive move through this area would place $89,282 as the next major Fibonacci reference.
📊 RSI Momentum
RSI (14): 63.89
RSI has moved above the neutral 50 level and remains in positive territory after the recent expansion.
The current reading shows stronger short-term momentum, while still remaining below the traditional 70 overbought threshold.
A sustained RSI above 60 would keep momentum supportive, while a move back below 50 would indicate increasing short-term weakness.
🎯 Key Levels
🔴 Major Resistance: $81,174.65 → $82,070.90 → $82,919 → $89,282 → $95,645
🟢 Major Support: $80,519 → $79,168 → $77,447 → $77,249 → $75,982 → $75,045
📉 Dynamic EMA Support: $77,248.95 — 20 EMA | $73,962.83 — 50 EMA | $73,200.05 — 200 EMA | $71,649.09 — 100 EMA
🚀 Upside References: $82,919 → $89,282 → $95,645 → $104,705 → $116,245
📌 Final Outlook
BTC's broader structure has strengthened after the recent recovery, with price now holding around $81K and above the major $77K–$80K support structure.
The $77K–$80K area is now an important short-term support region, while $82K–$83K remains the immediate major resistance zone.
A confirmed move above $82,919 could open the path toward $89,282, followed by $95,645 and $104,705.
However, rejection from the upper resistance area followed by a sustained loss of $75,045 would weaken the current recovery structure and bring the lower support zones back into focus.
Bias: 🟢 Recovery structure intact above $75,045. A sustained move above $82,919 could open the path toward $89,282, with $95,645 as the next major Fibonacci reference.
$BTC
12
·
--
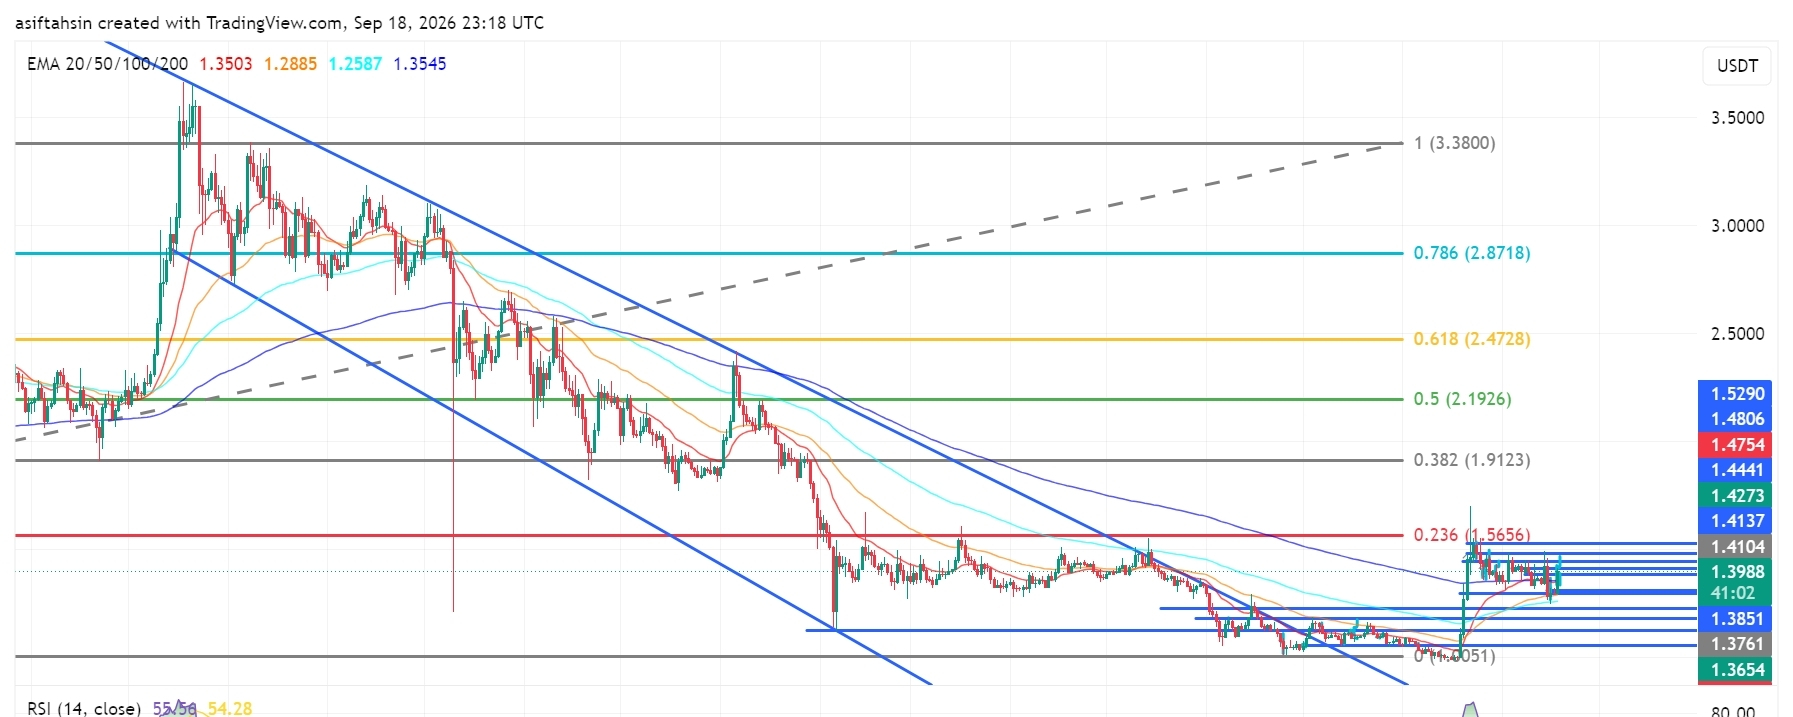
Məqalə
XRP Texniki Baxış: XRP $1.40 Yaxınlığında qalır, öküzlər (builslər) qırılmanı müdafiə edirXRP hazırda təxminən $1.40 ətrafında ticarət edir; avqustun aşağılarından güclü bərpa və əvvəlki enən strukturdan kəskin qırılmadan sonra konsolidasiya mərhələsindədir.
Geniş struktur əhəmiyyətli dərəcədə yaxşılaşıb: XRP 20, 50 və 100 EMA-ların üzərində ticarət edir. Lakin qiymət indi $1.41–$1.43 ətrafında mühüm müqavimət klasteri ilə üzləşib. Bu zonadan yuxarıda təmiz bir qırılma, növbəti yüksəliş ekspansiyasını təsdiqləmək üçün öküzlərə (builslərə) lazımdır.
📈 EMA Strukturı
20 EMA: $1.3503
50 EMA: $1.2885
100 EMA: $1.2586
200 EMA: $1.3545
XRP hazırda əsas dörd EMA-nın hamısından yuxarıda ticarət edir və bərpa strukturunu konstruktiv saxlayır.
XRP Texniki Baxış: XRP $1.40 Yaxınlığında qalır, öküzlər (builslər) qırılmanı müdafiə edir
XRP hazırda təxminən $1.40 ətrafında ticarət edir; avqustun aşağılarından güclü bərpa və əvvəlki enən strukturdan kəskin qırılmadan sonra konsolidasiya mərhələsindədir.
Geniş struktur əhəmiyyətli dərəcədə yaxşılaşıb: XRP 20, 50 və 100 EMA-ların üzərində ticarət edir. Lakin qiymət indi $1.41–$1.43 ətrafında mühüm müqavimət klasteri ilə üzləşib. Bu zonadan yuxarıda təmiz bir qırılma, növbəti yüksəliş ekspansiyasını təsdiqləmək üçün öküzlərə (builslərə) lazımdır.
📈 EMA Strukturı
20 EMA: $1.3503
50 EMA: $1.2885
100 EMA: $1.2586
200 EMA: $1.3545
XRP hazırda əsas dörd EMA-nın hamısından yuxarıda ticarət edir və bərpa strukturunu konstruktiv saxlayır.
Geniş struktur əhəmiyyətli dərəcədə yaxşılaşıb: XRP 20, 50 və 100 EMA-ların üzərində ticarət edir. Lakin qiymət indi $1.41–$1.43 ətrafında mühüm müqavimət klasteri ilə üzləşib. Bu zonadan yuxarıda təmiz bir qırılma, növbəti yüksəliş ekspansiyasını təsdiqləmək üçün öküzlərə (builslərə) lazımdır.
📈 EMA Strukturı
20 EMA: $1.3503
50 EMA: $1.2885
100 EMA: $1.2586
200 EMA: $1.3545
XRP hazırda əsas dörd EMA-nın hamısından yuxarıda ticarət edir və bərpa strukturunu konstruktiv saxlayır.
276
·
--
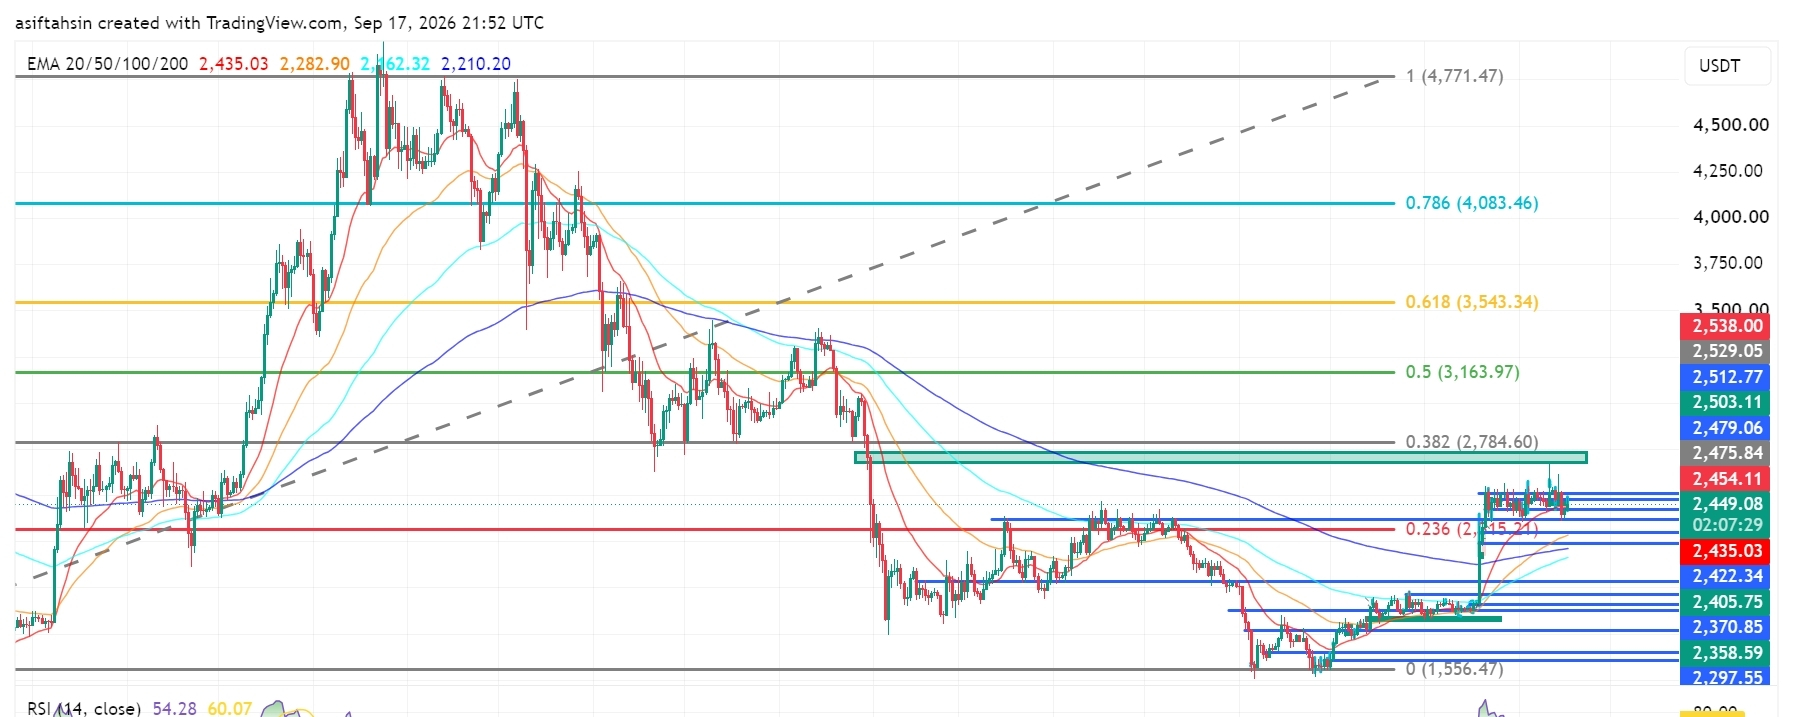
Məqalə
Tərcüməyə bax
ETH Technical Outlook: Ethereum Holds Above $2.4K as Recovery Structure BuildsETH is currently trading around $2,450, holding above the $2,405–$2,435 support area after the recent recovery from the $2,300–$2,360 demand zone.
The broader structure is improving, but ETH is now consolidating below the $2,475–$2,538 resistance cluster. The next major chart area is around $2,784.60, which aligns with the 0.382 Fibonacci level.
📈 EMA Structure
20 EMA: $2,435.06
50 EMA: $2,282.92
100 EMA: $2,162.32
200 EMA: $2,210.20
ETH is currently trading above the 20 EMA at $2,435.06.
The recovery above the 50 EMA at $2,282.92, 100 EMA at $2,162.32, and 200 EMA at $2,210.20 keeps the broader recovery structure constructive.
A sustained hold above the 20 EMA would support short-term momentum, while losing the $2,210–$2,283 area would weaken the current structure.
📐 Fibonacci Levels
Key Fibonacci levels:
0.236: $2,315.21
0.382: $2,784.60
0.5: $3,163.97
0.618: $3,543.34
0.786: $4,083.46
1.0: $4,771.47
ETH is currently holding well above the 0.236 Fibonacci level at $2,315.21.
The next major Fibonacci resistance is $2,784.60 — 0.382 Fib.
A sustained move through the $2,475–$2,538 resistance structure could place the $2,784.60 region into focus.
🟢 Bullish Scenario
ETH is consolidating after the recent recovery and is currently holding above the $2,435 area.
Immediate resistance:
$2,454.11
$2,475.84
$2,479.06
$2,503.11
$2,512.77
$2,529.05
$2,538.00
$2,784.60 — 0.382 Fibonacci
A clean breakout and sustained close above the $2,529–$2,538 zone would provide stronger confirmation of continued recovery.
🎯 Target 1: $2,475.84
🎯 Target 2: $2,503.11
🎯 Target 3: $2,529.05
🎯 Target 4: $2,538.00
🎯 Target 5: $2,784.60 — 0.382 Fibonacci
🎯 Target 6: $3,163.97 — 0.5 Fibonacci
A confirmed move above $2,538 could strengthen the medium-term recovery structure and bring the $2,784–$3,164 region into focus.
🔴 Pullback Scenario
After the recent recovery, a retest of the breakout area would be normal.
Key supports:
$2,449.37
$2,435.06 — 20 EMA
$2,422.34
$2,405.75
$2,370.85
$2,358.59
$2,297.55
$2,282.92 — 50 EMA
$2,210.20 — 200 EMA
The $2,405–$2,435 zone is particularly important.
If ETH continues to hold this area during a pullback, the current recovery structure remains active.
A sustained loss of $2,282.92 would weaken the broader structure and could expose the $2,210–$2,162 area.
🧠 Market Structure & Liquidity
ETH has formed a clear recovery structure after sweeping liquidity around the $2,280–$2,360 region.
The recent move produced a strong recovery followed by a breakout above the previous consolidation area.
ETH is now moving through an important:
Recovery → Breakout → Retest → Consolidation
structure.
The major upside liquidity is concentrated around $2,475–$2,538. A decisive move through this zone would place $2,784.60 as the next major Fibonacci reference.
📊 RSI Momentum
RSI (14): 54.28
RSI remains above the neutral 50 level after the recent recovery.
The current reading shows moderately positive momentum, while the RSI signal line is around 60.07.
A sustained RSI move above 55–60 would indicate improving momentum toward the upper resistance area.
A move back below 50 would indicate increasing short-term momentum weakness.
🎯 Key Levels
🔴 Major Resistance: $2,454.11 → $2,475.84 → $2,503.11 → $2,529.05 → $2,538.00
🟢 Major Support: $2,435.06 → $2,422.34 → $2,405.75 → $2,370.85 → $2,358.59
📉 Dynamic EMA Support: $2,435.06 — 20 EMA | $2,282.92 — 50 EMA | $2,210.20 — 200 EMA | $2,162.32 — 100 EMA
🚀 Upside References: $2,538 → $2,784.60 → $3,163.97 → $3,543.34
📌 Final Outlook
ETH's broader structure remains constructive after the recent recovery, with price holding above the $2,405–$2,435 area.
The $2,405–$2,435 zone is now an important short-term support region. As long as ETH maintains this area, the current recovery structure remains active.
The immediate battle is around $2,475–$2,538. A confirmed move above $2,538 could open the path toward $2,784.60, followed by $3,163.97.
However, rejection from resistance followed by a sustained loss of $2,282.92 would weaken the broader structure and increase the possibility of a deeper retracement toward the $2,210–$2,162 area.
Bias: 🟢 Recovery structure intact above $2,282.92. A breakout above $2,538 could open the path toward $2,784.60, with $3,163.97 as the next major Fibonacci reference.
$ETH
{future}(ETHUSDT)
ETH Technical Outlook: Ethereum Holds Above $2.4K as Recovery Structure Builds
ETH is currently trading around $2,450, holding above the $2,405–$2,435 support area after the recent recovery from the $2,300–$2,360 demand zone.
The broader structure is improving, but ETH is now consolidating below the $2,475–$2,538 resistance cluster. The next major chart area is around $2,784.60, which aligns with the 0.382 Fibonacci level.
📈 EMA Structure
20 EMA: $2,435.06
50 EMA: $2,282.92
100 EMA: $2,162.32
200 EMA: $2,210.20
ETH is currently trading above the 20 EMA at $2,435.06.
The recovery above the 50 EMA at $2,282.92, 100 EMA at $2,162.32, and 200 EMA at $2,210.20 keeps the broader recovery structure constructive.
A sustained hold above the 20 EMA would support short-term momentum, while losing the $2,210–$2,283 area would weaken the current structure.
📐 Fibonacci Levels
Key Fibonacci levels:
0.236: $2,315.21
0.382: $2,784.60
0.5: $3,163.97
0.618: $3,543.34
0.786: $4,083.46
1.0: $4,771.47
ETH is currently holding well above the 0.236 Fibonacci level at $2,315.21.
The next major Fibonacci resistance is $2,784.60 — 0.382 Fib.
A sustained move through the $2,475–$2,538 resistance structure could place the $2,784.60 region into focus.
🟢 Bullish Scenario
ETH is consolidating after the recent recovery and is currently holding above the $2,435 area.
Immediate resistance:
$2,454.11
$2,475.84
$2,479.06
$2,503.11
$2,512.77
$2,529.05
$2,538.00
$2,784.60 — 0.382 Fibonacci
A clean breakout and sustained close above the $2,529–$2,538 zone would provide stronger confirmation of continued recovery.
🎯 Target 1: $2,475.84
🎯 Target 2: $2,503.11
🎯 Target 3: $2,529.05
🎯 Target 4: $2,538.00
🎯 Target 5: $2,784.60 — 0.382 Fibonacci
🎯 Target 6: $3,163.97 — 0.5 Fibonacci
A confirmed move above $2,538 could strengthen the medium-term recovery structure and bring the $2,784–$3,164 region into focus.
🔴 Pullback Scenario
After the recent recovery, a retest of the breakout area would be normal.
Key supports:
$2,449.37
$2,435.06 — 20 EMA
$2,422.34
$2,405.75
$2,370.85
$2,358.59
$2,297.55
$2,282.92 — 50 EMA
$2,210.20 — 200 EMA
The $2,405–$2,435 zone is particularly important.
If ETH continues to hold this area during a pullback, the current recovery structure remains active.
A sustained loss of $2,282.92 would weaken the broader structure and could expose the $2,210–$2,162 area.
🧠 Market Structure & Liquidity
ETH has formed a clear recovery structure after sweeping liquidity around the $2,280–$2,360 region.
The recent move produced a strong recovery followed by a breakout above the previous consolidation area.
ETH is now moving through an important:
Recovery → Breakout → Retest → Consolidation
structure.
The major upside liquidity is concentrated around $2,475–$2,538. A decisive move through this zone would place $2,784.60 as the next major Fibonacci reference.
📊 RSI Momentum
RSI (14): 54.28
RSI remains above the neutral 50 level after the recent recovery.
The current reading shows moderately positive momentum, while the RSI signal line is around 60.07.
A sustained RSI move above 55–60 would indicate improving momentum toward the upper resistance area.
A move back below 50 would indicate increasing short-term momentum weakness.
🎯 Key Levels
🔴 Major Resistance: $2,454.11 → $2,475.84 → $2,503.11 → $2,529.05 → $2,538.00
🟢 Major Support: $2,435.06 → $2,422.34 → $2,405.75 → $2,370.85 → $2,358.59
📉 Dynamic EMA Support: $2,435.06 — 20 EMA | $2,282.92 — 50 EMA | $2,210.20 — 200 EMA | $2,162.32 — 100 EMA
🚀 Upside References: $2,538 → $2,784.60 → $3,163.97 → $3,543.34
📌 Final Outlook
ETH's broader structure remains constructive after the recent recovery, with price holding above the $2,405–$2,435 area.
The $2,405–$2,435 zone is now an important short-term support region. As long as ETH maintains this area, the current recovery structure remains active.
The immediate battle is around $2,475–$2,538. A confirmed move above $2,538 could open the path toward $2,784.60, followed by $3,163.97.
However, rejection from resistance followed by a sustained loss of $2,282.92 would weaken the broader structure and increase the possibility of a deeper retracement toward the $2,210–$2,162 area.
Bias: 🟢 Recovery structure intact above $2,282.92. A breakout above $2,538 could open the path toward $2,784.60, with $3,163.97 as the next major Fibonacci reference.
$ETH
The broader structure is improving, but ETH is now consolidating below the $2,475–$2,538 resistance cluster. The next major chart area is around $2,784.60, which aligns with the 0.382 Fibonacci level.
📈 EMA Structure
20 EMA: $2,435.06
50 EMA: $2,282.92
100 EMA: $2,162.32
200 EMA: $2,210.20
ETH is currently trading above the 20 EMA at $2,435.06.
The recovery above the 50 EMA at $2,282.92, 100 EMA at $2,162.32, and 200 EMA at $2,210.20 keeps the broader recovery structure constructive.
A sustained hold above the 20 EMA would support short-term momentum, while losing the $2,210–$2,283 area would weaken the current structure.
📐 Fibonacci Levels
Key Fibonacci levels:
0.236: $2,315.21
0.382: $2,784.60
0.5: $3,163.97
0.618: $3,543.34
0.786: $4,083.46
1.0: $4,771.47
ETH is currently holding well above the 0.236 Fibonacci level at $2,315.21.
The next major Fibonacci resistance is $2,784.60 — 0.382 Fib.
A sustained move through the $2,475–$2,538 resistance structure could place the $2,784.60 region into focus.
🟢 Bullish Scenario
ETH is consolidating after the recent recovery and is currently holding above the $2,435 area.
Immediate resistance:
$2,454.11
$2,475.84
$2,479.06
$2,503.11
$2,512.77
$2,529.05
$2,538.00
$2,784.60 — 0.382 Fibonacci
A clean breakout and sustained close above the $2,529–$2,538 zone would provide stronger confirmation of continued recovery.
🎯 Target 1: $2,475.84
🎯 Target 2: $2,503.11
🎯 Target 3: $2,529.05
🎯 Target 4: $2,538.00
🎯 Target 5: $2,784.60 — 0.382 Fibonacci
🎯 Target 6: $3,163.97 — 0.5 Fibonacci
A confirmed move above $2,538 could strengthen the medium-term recovery structure and bring the $2,784–$3,164 region into focus.
🔴 Pullback Scenario
After the recent recovery, a retest of the breakout area would be normal.
Key supports:
$2,449.37
$2,435.06 — 20 EMA
$2,422.34
$2,405.75
$2,370.85
$2,358.59
$2,297.55
$2,282.92 — 50 EMA
$2,210.20 — 200 EMA
The $2,405–$2,435 zone is particularly important.
If ETH continues to hold this area during a pullback, the current recovery structure remains active.
A sustained loss of $2,282.92 would weaken the broader structure and could expose the $2,210–$2,162 area.
🧠 Market Structure & Liquidity
ETH has formed a clear recovery structure after sweeping liquidity around the $2,280–$2,360 region.
The recent move produced a strong recovery followed by a breakout above the previous consolidation area.
ETH is now moving through an important:
Recovery → Breakout → Retest → Consolidation
structure.
The major upside liquidity is concentrated around $2,475–$2,538. A decisive move through this zone would place $2,784.60 as the next major Fibonacci reference.
📊 RSI Momentum
RSI (14): 54.28
RSI remains above the neutral 50 level after the recent recovery.
The current reading shows moderately positive momentum, while the RSI signal line is around 60.07.
A sustained RSI move above 55–60 would indicate improving momentum toward the upper resistance area.
A move back below 50 would indicate increasing short-term momentum weakness.
🎯 Key Levels
🔴 Major Resistance: $2,454.11 → $2,475.84 → $2,503.11 → $2,529.05 → $2,538.00
🟢 Major Support: $2,435.06 → $2,422.34 → $2,405.75 → $2,370.85 → $2,358.59
📉 Dynamic EMA Support: $2,435.06 — 20 EMA | $2,282.92 — 50 EMA | $2,210.20 — 200 EMA | $2,162.32 — 100 EMA
🚀 Upside References: $2,538 → $2,784.60 → $3,163.97 → $3,543.34
📌 Final Outlook
ETH's broader structure remains constructive after the recent recovery, with price holding above the $2,405–$2,435 area.
The $2,405–$2,435 zone is now an important short-term support region. As long as ETH maintains this area, the current recovery structure remains active.
The immediate battle is around $2,475–$2,538. A confirmed move above $2,538 could open the path toward $2,784.60, followed by $3,163.97.
However, rejection from resistance followed by a sustained loss of $2,282.92 would weaken the broader structure and increase the possibility of a deeper retracement toward the $2,210–$2,162 area.
Bias: 🟢 Recovery structure intact above $2,282.92. A breakout above $2,538 could open the path toward $2,784.60, with $3,163.97 as the next major Fibonacci reference.
$ETH
75
·
--
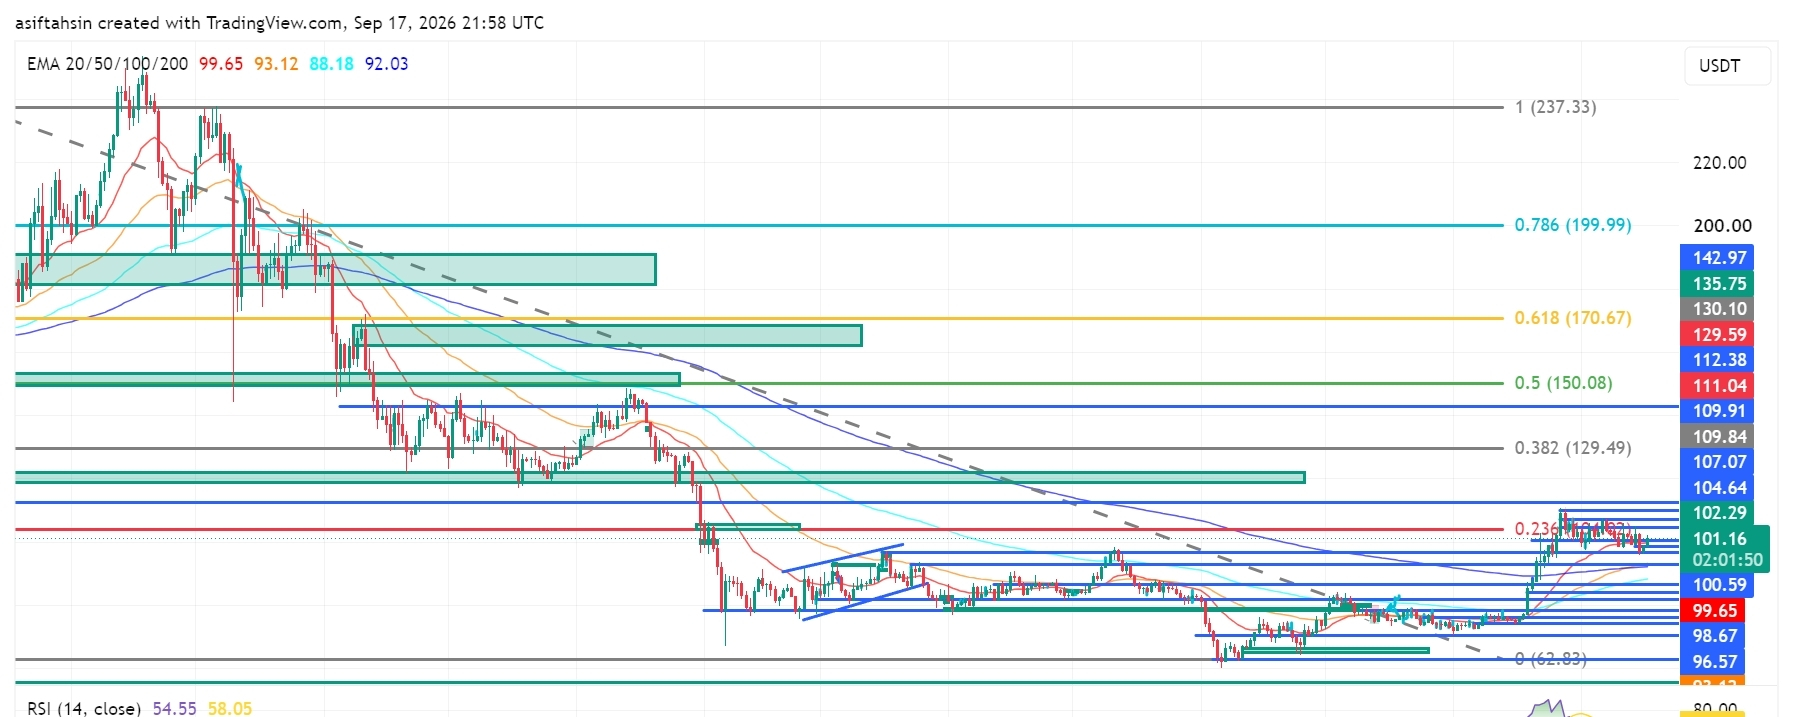
Məqalə
Tərcüməyə bax
SOL Technical Outlook: Solana Holds Above $100 as Bulls Defend the RecoverySOL is currently trading around $101.16, holding above the $99–$100 breakout zone after the recent bullish expansion from the $92–$94 demand area.
The broader recovery structure remains constructive, but SOL is now consolidating below the $102.29–$107.07 resistance cluster. Bulls need to reclaim this area and break the $109.91–$112.38 zone for the next major upside expansion.
📈 EMA Structure
- 20 EMA: $99.65
- 50 EMA: $93.12
- 100 EMA: $88.18
- 200 EMA: $92.03
SOL is currently trading above the 20 EMA at $99.65.
The recovery above the 50 EMA at $93.12 and 200 EMA at $92.03 keeps the broader recovery structure intact.
A sustained hold above the 20 EMA would support short-term momentum, while losing the $93.12–$92.03 area would weaken the current structure.
📐 Fibonacci Levels
Key Fibonacci levels:
- 0.236: $104.64
- 0.382: $129.49
- 0.5: $150.08
- 0.618: $170.67
- 0.786: $199.99
- 1.0: $237.33
SOL is currently trading below the 0.236 Fibonacci level at $104.64.
The next major Fibonacci resistance is $129.49 — 0.382 Fib.
A sustained breakout through the $104–$112 resistance structure could open the path toward the $129.49 region.
🟢 Bullish Scenario
SOL is consolidating after the recent recovery and is currently maintaining acceptance above the $100 area.
Immediate resistance:
- $102.29
- $104.64 — 0.236 Fibonacci
- $107.07
- $109.84
- $109.91
- $111.04
- $112.38
A clean breakout and sustained close above $111.04–$112.38 would provide stronger confirmation of bullish continuation.
🎯 Target 1: $104.64
🎯 Target 2: $107.07
🎯 Target 3: $109.91
🎯 Target 4: $112.38
🎯 Target 5: $129.49 — 0.382 Fibonacci
🎯 Target 6: $150.08 — 0.5 Fibonacci
A confirmed breakout above the $111–$112 zone could strengthen the medium-term recovery structure and potentially accelerate SOL toward the $129–$150 region.
🔴 Pullback Scenario
After the recent bullish expansion, a retest of the breakout area would be normal.
Key supports:
- $100.59
- $99.65 — 20 EMA
- $98.67
- $96.57
- $93.12 — 50 EMA
- $92.94
- $92.03 — 200 EMA
- $88.18 — 100 EMA
The $96–$100 zone is particularly important.
If SOL continues to hold this area during a pullback, the current recovery structure remains active.
A sustained loss of $92.03 would weaken the current structure and could expose the $88.18 support zone.
🧠 Market Structure & Liquidity
SOL has formed a clear recovery structure after sweeping liquidity around the $92–$94 demand region.
The recent move produced a market-structure shift followed by a breakout and higher-low formation.
SOL is now moving through an important:
Breakout → Retest → Consolidation → Continuation
structure.
The major upside liquidity is concentrated around $102–$112. A decisive breakout above this zone would place $129.49 as the next major Fibonacci reference.
📊 RSI Momentum
RSI (14): 54.55
RSI remains above the neutral 50 level after cooling from the recent bullish expansion.
The current reading shows moderately positive momentum without reaching an extreme zone.
A sustained RSI move above 55–60 would indicate improving momentum toward the upper resistance area.
A move back below 50 would indicate increasing short-term momentum weakness.
🎯 Key Levels
🔴 Major Resistance: $102.29 → $104.64 → $107.07 → $109.91 → $111.04 → $112.38
🟢 Major Support: $100.59 → $99.65 → $98.67 → $96.57 → $93.12 → $92.03
📉 Dynamic EMA Support: $99.65 — 20 EMA | $93.12 — 50 EMA | $92.03 — 200 EMA | $88.18 — 100 EMA
🚀 Upside Targets: $112.38 → $129.49 → $150.08 → $170.67
📌 Final Outlook
SOL's broader structure remains constructive after the recent breakout, with price holding above the $99–$100 region.
The $96–$100 area is now an important short-term support region. As long as SOL maintains this area, the current recovery structure remains active.
The immediate battle is around $102–$112. A confirmed breakout above $112.38 could open the path toward $129.49, followed by $150.08 and potentially $170.67.
However, rejection from resistance followed by a sustained loss of $92.03 would weaken the current structure and increase the possibility of a deeper retracement toward the $88.18 area.
Bias: 🟢 Recovery structure intact above $92.03. A breakout above $112.38 could open the path toward $129.49, with $150.08 as the next major Fibonacci target.
$SOL
{future}(SOLUSDT)
SOL Technical Outlook: Solana Holds Above $100 as Bulls Defend the Recovery
SOL is currently trading around $101.16, holding above the $99–$100 breakout zone after the recent bullish expansion from the $92–$94 demand area.
The broader recovery structure remains constructive, but SOL is now consolidating below the $102.29–$107.07 resistance cluster. Bulls need to reclaim this area and break the $109.91–$112.38 zone for the next major upside expansion.
📈 EMA Structure
- 20 EMA: $99.65
- 50 EMA: $93.12
- 100 EMA: $88.18
- 200 EMA: $92.03
SOL is currently trading above the 20 EMA at $99.65.
The recovery above the 50 EMA at $93.12 and 200 EMA at $92.03 keeps the broader recovery structure intact.
A sustained hold above the 20 EMA would support short-term momentum, while losing the $93.12–$92.03 area would weaken the current structure.
📐 Fibonacci Levels
Key Fibonacci levels:
- 0.236: $104.64
- 0.382: $129.49
- 0.5: $150.08
- 0.618: $170.67
- 0.786: $199.99
- 1.0: $237.33
SOL is currently trading below the 0.236 Fibonacci level at $104.64.
The next major Fibonacci resistance is $129.49 — 0.382 Fib.
A sustained breakout through the $104–$112 resistance structure could open the path toward the $129.49 region.
🟢 Bullish Scenario
SOL is consolidating after the recent recovery and is currently maintaining acceptance above the $100 area.
Immediate resistance:
- $102.29
- $104.64 — 0.236 Fibonacci
- $107.07
- $109.84
- $109.91
- $111.04
- $112.38
A clean breakout and sustained close above $111.04–$112.38 would provide stronger confirmation of bullish continuation.
🎯 Target 1: $104.64
🎯 Target 2: $107.07
🎯 Target 3: $109.91
🎯 Target 4: $112.38
🎯 Target 5: $129.49 — 0.382 Fibonacci
🎯 Target 6: $150.08 — 0.5 Fibonacci
A confirmed breakout above the $111–$112 zone could strengthen the medium-term recovery structure and potentially accelerate SOL toward the $129–$150 region.
🔴 Pullback Scenario
After the recent bullish expansion, a retest of the breakout area would be normal.
Key supports:
- $100.59
- $99.65 — 20 EMA
- $98.67
- $96.57
- $93.12 — 50 EMA
- $92.94
- $92.03 — 200 EMA
- $88.18 — 100 EMA
The $96–$100 zone is particularly important.
If SOL continues to hold this area during a pullback, the current recovery structure remains active.
A sustained loss of $92.03 would weaken the current structure and could expose the $88.18 support zone.
🧠 Market Structure & Liquidity
SOL has formed a clear recovery structure after sweeping liquidity around the $92–$94 demand region.
The recent move produced a market-structure shift followed by a breakout and higher-low formation.
SOL is now moving through an important:
Breakout → Retest → Consolidation → Continuation
structure.
The major upside liquidity is concentrated around $102–$112. A decisive breakout above this zone would place $129.49 as the next major Fibonacci reference.
📊 RSI Momentum
RSI (14): 54.55
RSI remains above the neutral 50 level after cooling from the recent bullish expansion.
The current reading shows moderately positive momentum without reaching an extreme zone.
A sustained RSI move above 55–60 would indicate improving momentum toward the upper resistance area.
A move back below 50 would indicate increasing short-term momentum weakness.
🎯 Key Levels
🔴 Major Resistance: $102.29 → $104.64 → $107.07 → $109.91 → $111.04 → $112.38
🟢 Major Support: $100.59 → $99.65 → $98.67 → $96.57 → $93.12 → $92.03
📉 Dynamic EMA Support: $99.65 — 20 EMA | $93.12 — 50 EMA | $92.03 — 200 EMA | $88.18 — 100 EMA
🚀 Upside Targets: $112.38 → $129.49 → $150.08 → $170.67
📌 Final Outlook
SOL's broader structure remains constructive after the recent breakout, with price holding above the $99–$100 region.
The $96–$100 area is now an important short-term support region. As long as SOL maintains this area, the current recovery structure remains active.
The immediate battle is around $102–$112. A confirmed breakout above $112.38 could open the path toward $129.49, followed by $150.08 and potentially $170.67.
However, rejection from resistance followed by a sustained loss of $92.03 would weaken the current structure and increase the possibility of a deeper retracement toward the $88.18 area.
Bias: 🟢 Recovery structure intact above $92.03. A breakout above $112.38 could open the path toward $129.49, with $150.08 as the next major Fibonacci target.
$SOL
The broader recovery structure remains constructive, but SOL is now consolidating below the $102.29–$107.07 resistance cluster. Bulls need to reclaim this area and break the $109.91–$112.38 zone for the next major upside expansion.
📈 EMA Structure
- 20 EMA: $99.65
- 50 EMA: $93.12
- 100 EMA: $88.18
- 200 EMA: $92.03
SOL is currently trading above the 20 EMA at $99.65.
The recovery above the 50 EMA at $93.12 and 200 EMA at $92.03 keeps the broader recovery structure intact.
A sustained hold above the 20 EMA would support short-term momentum, while losing the $93.12–$92.03 area would weaken the current structure.
📐 Fibonacci Levels
Key Fibonacci levels:
- 0.236: $104.64
- 0.382: $129.49
- 0.5: $150.08
- 0.618: $170.67
- 0.786: $199.99
- 1.0: $237.33
SOL is currently trading below the 0.236 Fibonacci level at $104.64.
The next major Fibonacci resistance is $129.49 — 0.382 Fib.
A sustained breakout through the $104–$112 resistance structure could open the path toward the $129.49 region.
🟢 Bullish Scenario
SOL is consolidating after the recent recovery and is currently maintaining acceptance above the $100 area.
Immediate resistance:
- $102.29
- $104.64 — 0.236 Fibonacci
- $107.07
- $109.84
- $109.91
- $111.04
- $112.38
A clean breakout and sustained close above $111.04–$112.38 would provide stronger confirmation of bullish continuation.
🎯 Target 1: $104.64
🎯 Target 2: $107.07
🎯 Target 3: $109.91
🎯 Target 4: $112.38
🎯 Target 5: $129.49 — 0.382 Fibonacci
🎯 Target 6: $150.08 — 0.5 Fibonacci
A confirmed breakout above the $111–$112 zone could strengthen the medium-term recovery structure and potentially accelerate SOL toward the $129–$150 region.
🔴 Pullback Scenario
After the recent bullish expansion, a retest of the breakout area would be normal.
Key supports:
- $100.59
- $99.65 — 20 EMA
- $98.67
- $96.57
- $93.12 — 50 EMA
- $92.94
- $92.03 — 200 EMA
- $88.18 — 100 EMA
The $96–$100 zone is particularly important.
If SOL continues to hold this area during a pullback, the current recovery structure remains active.
A sustained loss of $92.03 would weaken the current structure and could expose the $88.18 support zone.
🧠 Market Structure & Liquidity
SOL has formed a clear recovery structure after sweeping liquidity around the $92–$94 demand region.
The recent move produced a market-structure shift followed by a breakout and higher-low formation.
SOL is now moving through an important:
Breakout → Retest → Consolidation → Continuation
structure.
The major upside liquidity is concentrated around $102–$112. A decisive breakout above this zone would place $129.49 as the next major Fibonacci reference.
📊 RSI Momentum
RSI (14): 54.55
RSI remains above the neutral 50 level after cooling from the recent bullish expansion.
The current reading shows moderately positive momentum without reaching an extreme zone.
A sustained RSI move above 55–60 would indicate improving momentum toward the upper resistance area.
A move back below 50 would indicate increasing short-term momentum weakness.
🎯 Key Levels
🔴 Major Resistance: $102.29 → $104.64 → $107.07 → $109.91 → $111.04 → $112.38
🟢 Major Support: $100.59 → $99.65 → $98.67 → $96.57 → $93.12 → $92.03
📉 Dynamic EMA Support: $99.65 — 20 EMA | $93.12 — 50 EMA | $92.03 — 200 EMA | $88.18 — 100 EMA
🚀 Upside Targets: $112.38 → $129.49 → $150.08 → $170.67
📌 Final Outlook
SOL's broader structure remains constructive after the recent breakout, with price holding above the $99–$100 region.
The $96–$100 area is now an important short-term support region. As long as SOL maintains this area, the current recovery structure remains active.
The immediate battle is around $102–$112. A confirmed breakout above $112.38 could open the path toward $129.49, followed by $150.08 and potentially $170.67.
However, rejection from resistance followed by a sustained loss of $92.03 would weaken the current structure and increase the possibility of a deeper retracement toward the $88.18 area.
Bias: 🟢 Recovery structure intact above $92.03. A breakout above $112.38 could open the path toward $129.49, with $150.08 as the next major Fibonacci target.
$SOL
73
·
--
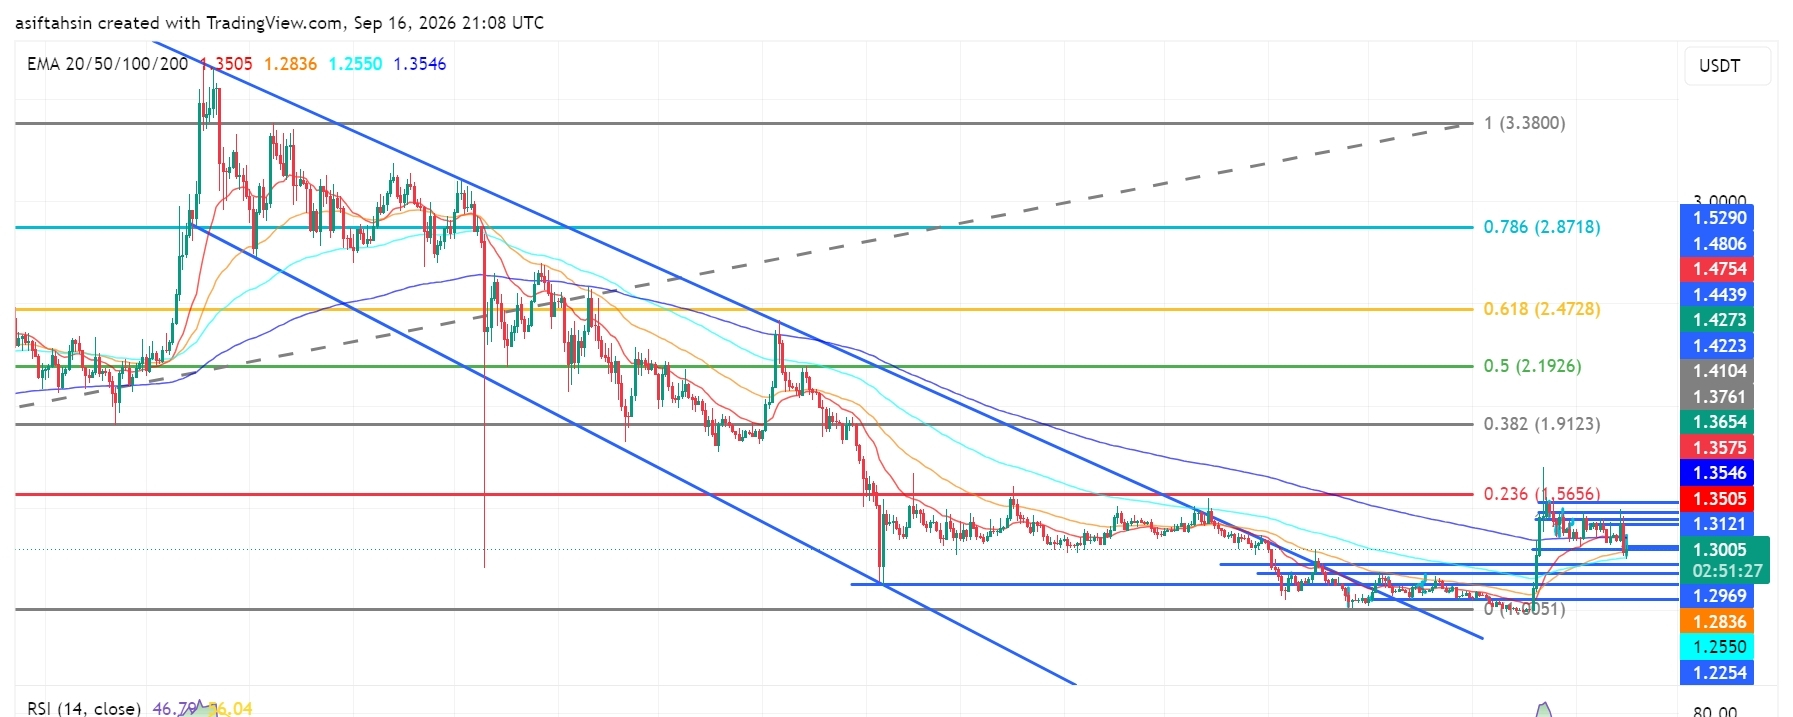
Məqalə
XRP Texniki Baxış: XRP $1.30 yaxınlığında kəskin geri çəkilmədən sonra konsolidasiya edirXRP $1.35–$1.43 zonasında kəskin rədd cavabından sonra qrafikdə $1.30 ətrafında ticarət edir. Qiymət qırılma (breakout) sahəsinə doğru geri qayıdıb, halbuki daha geniş qrafik $1.20–$1.25 zonadan bərpa mərhələsindədir. Cari impuls neytraldır, RSI isə 50-dən aşağıdır.
📈 EMA Strukturu
20 EMA: $1.3505
50 EMA: $1.2836
100 EMA: $1.2550
200 EMA: $1.3546
XRP hazırda 20 EMA və 200 EMA-nın altındadır, halbuki 50 və 100 EMA-lar qiymətdən aşağı qalır. $1.35 səviyyəsini geri qaytarmaq qısamüddətli strukturu yaxşılaşdırardı.
XRP Texniki Baxış: XRP $1.30 yaxınlığında kəskin geri çəkilmədən sonra konsolidasiya edir
XRP $1.35–$1.43 zonasında kəskin rədd cavabından sonra qrafikdə $1.30 ətrafında ticarət edir. Qiymət qırılma (breakout) sahəsinə doğru geri qayıdıb, halbuki daha geniş qrafik $1.20–$1.25 zonadan bərpa mərhələsindədir. Cari impuls neytraldır, RSI isə 50-dən aşağıdır.
📈 EMA Strukturu
20 EMA: $1.3505
50 EMA: $1.2836
100 EMA: $1.2550
200 EMA: $1.3546
XRP hazırda 20 EMA və 200 EMA-nın altındadır, halbuki 50 və 100 EMA-lar qiymətdən aşağı qalır. $1.35 səviyyəsini geri qaytarmaq qısamüddətli strukturu yaxşılaşdırardı.
📈 EMA Strukturu
20 EMA: $1.3505
50 EMA: $1.2836
100 EMA: $1.2550
200 EMA: $1.3546
XRP hazırda 20 EMA və 200 EMA-nın altındadır, halbuki 50 və 100 EMA-lar qiymətdən aşağı qalır. $1.35 səviyyəsini geri qaytarmaq qısamüddətli strukturu yaxşılaşdırardı.
1
3
790
·
--
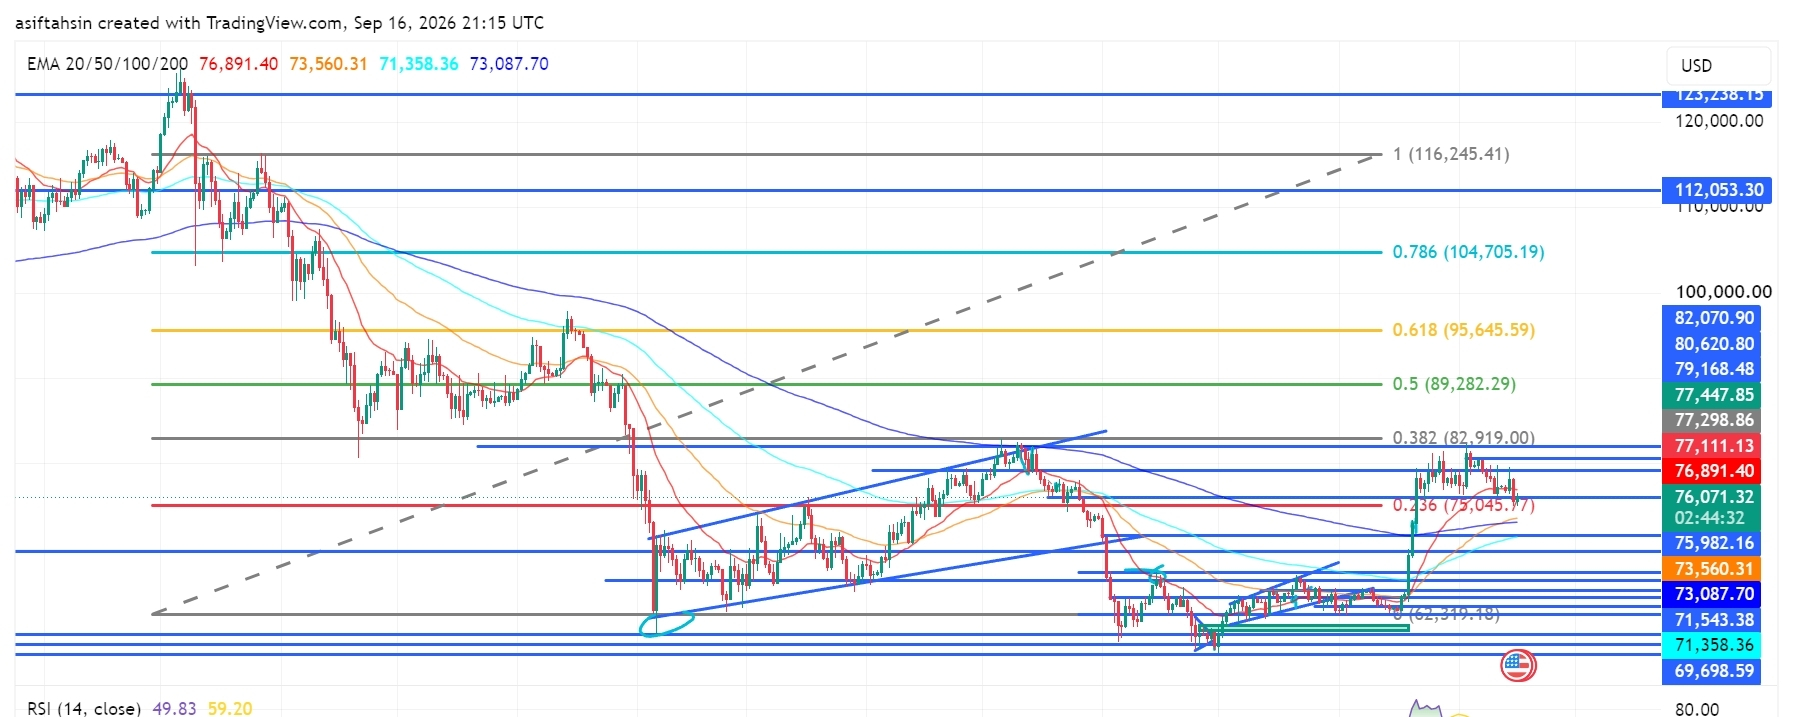
Məqalə
BTC Texniki Görünüş: Bitcoin $77K-dan Aşağı Konsolidə Olur, Boğalar Bərpanı Müdafiə EdirBitcoin $76.9K civarında ticarət edir və yaxın vaxtlarda $69K–$71K tələb zonasından bərpa olunduqdan sonra konsolidasiya mərhələsindədir. Qiymət əsas $75K dəstək zonasının üzərində qalır, lakin BTC $77.1K–$82.9K müqavimət bölgəsinin altında qaldıqca momentum zəifləyib. Növbəti çıxış (breakout) və ya eniş (breakdown) qısa müddətli istiqaməti müəyyən etməlidir.
📈 EMA Strukturu
20 EMA: $76,891
50 EMA: $73,560
100 EMA: $71,358
200 EMA: $73,088
BTC hazırda 20 EMA-nın ətrafında yerləşir, halbuki 50/100/200 EMA-lar qiymətin altında qalır. $75K-dan yuxarıda qalmaq daha geniş bərpa strukturu qoruyur, amma 20 EMA-nı itirmək daha dərin yenidən yoxlama (retest) ilə nəticələnə bilər.
BTC Texniki Görünüş: Bitcoin $77K-dan Aşağı Konsolidə Olur, Boğalar Bərpanı Müdafiə Edir
Bitcoin $76.9K civarında ticarət edir və yaxın vaxtlarda $69K–$71K tələb zonasından bərpa olunduqdan sonra konsolidasiya mərhələsindədir. Qiymət əsas $75K dəstək zonasının üzərində qalır, lakin BTC $77.1K–$82.9K müqavimət bölgəsinin altında qaldıqca momentum zəifləyib. Növbəti çıxış (breakout) və ya eniş (breakdown) qısa müddətli istiqaməti müəyyən etməlidir.
📈 EMA Strukturu
20 EMA: $76,891
50 EMA: $73,560
100 EMA: $71,358
200 EMA: $73,088
BTC hazırda 20 EMA-nın ətrafında yerləşir, halbuki 50/100/200 EMA-lar qiymətin altında qalır. $75K-dan yuxarıda qalmaq daha geniş bərpa strukturu qoruyur, amma 20 EMA-nı itirmək daha dərin yenidən yoxlama (retest) ilə nəticələnə bilər.
📈 EMA Strukturu
20 EMA: $76,891
50 EMA: $73,560
100 EMA: $71,358
200 EMA: $73,088
BTC hazırda 20 EMA-nın ətrafında yerləşir, halbuki 50/100/200 EMA-lar qiymətin altında qalır. $75K-dan yuxarıda qalmaq daha geniş bərpa strukturu qoruyur, amma 20 EMA-nı itirmək daha dərin yenidən yoxlama (retest) ilə nəticələnə bilər.
61
·
--
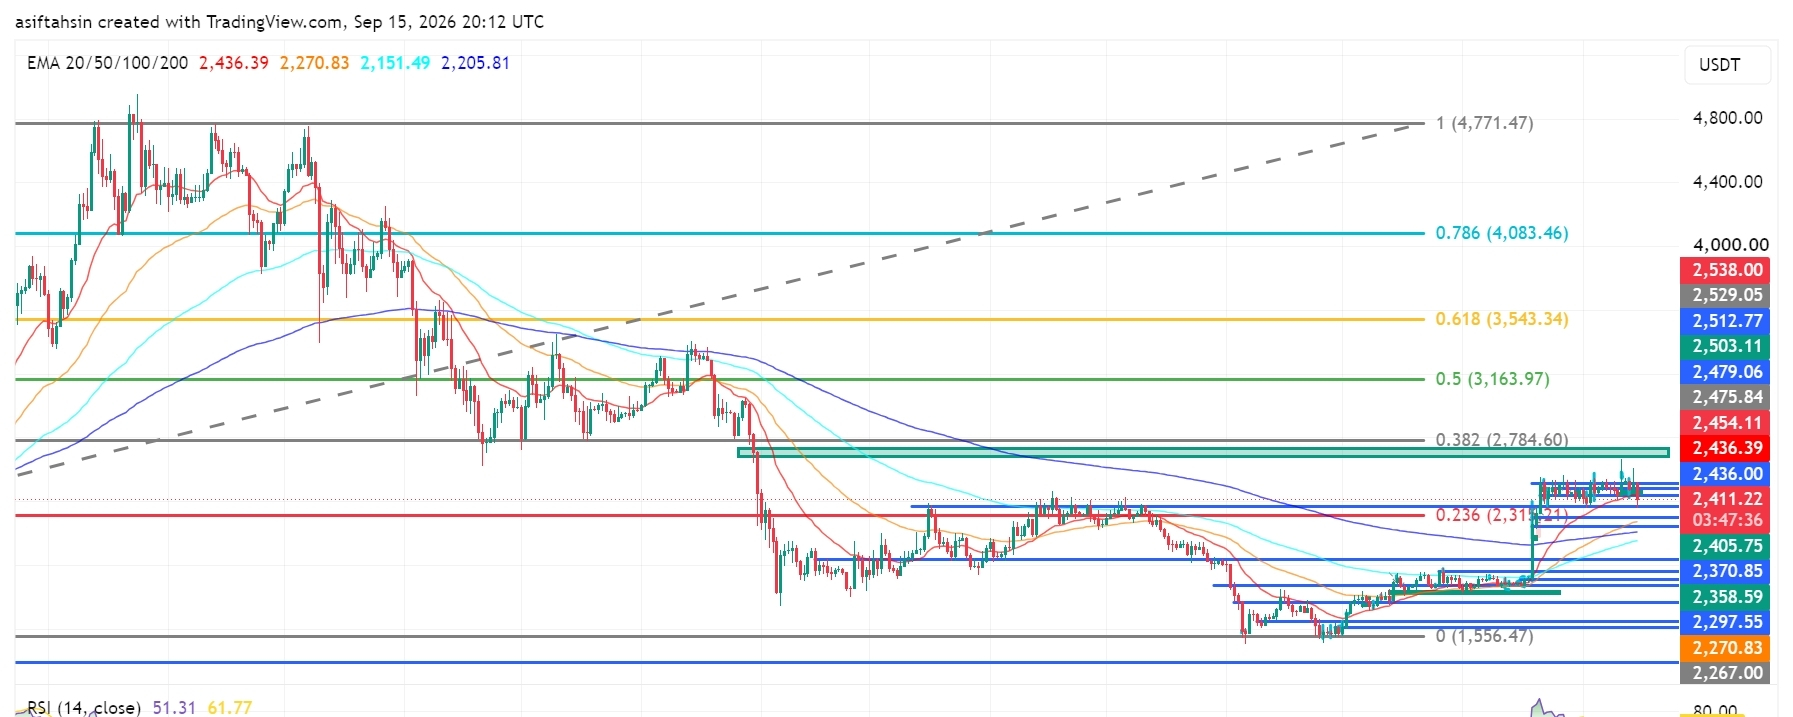
Məqalə
Tərcüməyə bax
SOL Technical Outlook: Solana Holds Near $100 as Bulls Defend the BreakoutSOL is currently trading around $99.6, holding near the $99–$100 breakout zone after the recent bullish expansion from the $92–$94 demand area.
The broader recovery structure remains constructive, but SOL is now consolidating below the $100.59–$104.64 resistance cluster. Bulls need to reclaim this area and break the $107.07–$109.91 zone for the next major upside expansion.
📈 EMA Structure
20 EMA: $99.62
50 EMA: $92.58
100 EMA: $87.71
200 EMA: $91.88
SOL is currently testing the 20 EMA at $99.62.
The recovery above the 50 EMA at $92.58 and 200 EMA at $91.88 keeps the broader recovery structure intact.
A sustained hold above the 20 EMA would strengthen short-term momentum, while losing the $92.58–$91.88 area would weaken the current structure.
📐 Fibonacci Levels
Key Fibonacci levels:
0.236: $100.02
0.382: $129.49
0.5: $150.08
0.618: $170.67
0.786: $199.99
1.0: $237.33
SOL is currently testing the 0.236 Fibonacci region around $100.02.
The next major Fibonacci resistance is $129.49 — 0.382 Fib.
A sustained breakout above the $100–$107 resistance structure could open the path toward the $129.49 region.
🟢 Bullish Scenario
SOL is consolidating after the recent recovery and is currently building acceptance around the $99–$100 area.
Immediate resistance:
$100.02 — 0.236 Fibonacci
$100.59
$102.00
$102.29
$104.64
$107.07
$109.91
$111.04
A clean breakout and sustained close above $109.91–$111.04 would provide stronger confirmation of bullish continuation.
🎯 Target 1: $100.59
🎯 Target 2: $104.64
🎯 Target 3: $107.07
🎯 Target 4: $111.04
🎯 Target 5: $129.49 — 0.382 Fibonacci
🎯 Target 6: $150.08 — 0.5 Fibonacci
A confirmed breakout above the $109.91–$111.04 zone could strengthen the medium-term recovery structure and potentially accelerate SOL toward the $129–$150 region.
🔴 Pullback Scenario
After the recent bullish expansion, a retest of the breakout area would be normal.
Key supports:
$97.42
$96.33
$92.94
$92.58 — 50 EMA
$91.88 — 200 EMA
$87.71 — 100 EMA
The $92–$97 zone is particularly important.
If SOL continues to hold this area during a pullback, the current recovery structure remains valid.
A sustained loss of $91.88 would weaken the bullish setup and could expose the $87.71 support zone.
🧠 Market Structure & Liquidity
SOL has formed a clear recovery structure after sweeping liquidity around the $92–$94 demand region.
The recent move produced a market-structure shift followed by a breakout and higher-low formation.
SOL is now moving through an important:
Breakout → Retest → Consolidation → Continuation
structure.
The major upside liquidity is concentrated around $100–$111. A decisive breakout above this zone would place $129.49 as the next major Fibonacci target.
📊 RSI Momentum
RSI (14): 49.30
RSI has cooled back toward the neutral 50 level after the recent bullish expansion.
The current reading shows that short-term momentum is balanced rather than strongly overbought.
A sustained RSI move back above 50–55 would favor another bullish attempt toward the resistance zone.
A breakdown below 50 would indicate increasing short-term momentum weakness.
🎯 Key Levels
🔴 Major Resistance: $100.02 → $100.59 → $104.64 → $107.07 → $109.91 → $111.04
🟢 Major Support: $97.42 → $96.33 → $92.94 → $92.58 → $91.88
📉 Dynamic EMA Support: $92.58 — 50 EMA | $91.88 — 200 EMA | $87.71 — 100 EMA
🚀 Upside Targets: $111.04 → $129.49 → $150.08 → $170.67
📌 Final Outlook
SOL's broader structure remains constructive after the recent breakout, but price is currently consolidating around the $100 area and below the $100.59–$111 resistance zone.
The $92–$97 area is now the key short-term support region. As long as SOL holds above this zone, the current recovery structure remains active.
The immediate battle is around $100–$111. A confirmed breakout above $111.04 could open the path toward $129.49, followed by $150.08 and potentially $170.67.
However, rejection from resistance followed by a sustained loss of $91.88 would weaken the bullish structure and increase the risk of a deeper retracement toward the $87.71 area.
Bias: 🟢 Recovery structure intact above $91.88. A breakout above $111.04 could open the path toward $129.49, with $150.08 as the next major Fibonacci target.
$SOL
{future}(SOLUSDT)
SOL Technical Outlook: Solana Holds Near $100 as Bulls Defend the Breakout
SOL is currently trading around $99.6, holding near the $99–$100 breakout zone after the recent bullish expansion from the $92–$94 demand area.
The broader recovery structure remains constructive, but SOL is now consolidating below the $100.59–$104.64 resistance cluster. Bulls need to reclaim this area and break the $107.07–$109.91 zone for the next major upside expansion.
📈 EMA Structure
20 EMA: $99.62
50 EMA: $92.58
100 EMA: $87.71
200 EMA: $91.88
SOL is currently testing the 20 EMA at $99.62.
The recovery above the 50 EMA at $92.58 and 200 EMA at $91.88 keeps the broader recovery structure intact.
A sustained hold above the 20 EMA would strengthen short-term momentum, while losing the $92.58–$91.88 area would weaken the current structure.
📐 Fibonacci Levels
Key Fibonacci levels:
0.236: $100.02
0.382: $129.49
0.5: $150.08
0.618: $170.67
0.786: $199.99
1.0: $237.33
SOL is currently testing the 0.236 Fibonacci region around $100.02.
The next major Fibonacci resistance is $129.49 — 0.382 Fib.
A sustained breakout above the $100–$107 resistance structure could open the path toward the $129.49 region.
🟢 Bullish Scenario
SOL is consolidating after the recent recovery and is currently building acceptance around the $99–$100 area.
Immediate resistance:
$100.02 — 0.236 Fibonacci
$100.59
$102.00
$102.29
$104.64
$107.07
$109.91
$111.04
A clean breakout and sustained close above $109.91–$111.04 would provide stronger confirmation of bullish continuation.
🎯 Target 1: $100.59
🎯 Target 2: $104.64
🎯 Target 3: $107.07
🎯 Target 4: $111.04
🎯 Target 5: $129.49 — 0.382 Fibonacci
🎯 Target 6: $150.08 — 0.5 Fibonacci
A confirmed breakout above the $109.91–$111.04 zone could strengthen the medium-term recovery structure and potentially accelerate SOL toward the $129–$150 region.
🔴 Pullback Scenario
After the recent bullish expansion, a retest of the breakout area would be normal.
Key supports:
$97.42
$96.33
$92.94
$92.58 — 50 EMA
$91.88 — 200 EMA
$87.71 — 100 EMA
The $92–$97 zone is particularly important.
If SOL continues to hold this area during a pullback, the current recovery structure remains valid.
A sustained loss of $91.88 would weaken the bullish setup and could expose the $87.71 support zone.
🧠 Market Structure & Liquidity
SOL has formed a clear recovery structure after sweeping liquidity around the $92–$94 demand region.
The recent move produced a market-structure shift followed by a breakout and higher-low formation.
SOL is now moving through an important:
Breakout → Retest → Consolidation → Continuation
structure.
The major upside liquidity is concentrated around $100–$111. A decisive breakout above this zone would place $129.49 as the next major Fibonacci target.
📊 RSI Momentum
RSI (14): 49.30
RSI has cooled back toward the neutral 50 level after the recent bullish expansion.
The current reading shows that short-term momentum is balanced rather than strongly overbought.
A sustained RSI move back above 50–55 would favor another bullish attempt toward the resistance zone.
A breakdown below 50 would indicate increasing short-term momentum weakness.
🎯 Key Levels
🔴 Major Resistance: $100.02 → $100.59 → $104.64 → $107.07 → $109.91 → $111.04
🟢 Major Support: $97.42 → $96.33 → $92.94 → $92.58 → $91.88
📉 Dynamic EMA Support: $92.58 — 50 EMA | $91.88 — 200 EMA | $87.71 — 100 EMA
🚀 Upside Targets: $111.04 → $129.49 → $150.08 → $170.67
📌 Final Outlook
SOL's broader structure remains constructive after the recent breakout, but price is currently consolidating around the $100 area and below the $100.59–$111 resistance zone.
The $92–$97 area is now the key short-term support region. As long as SOL holds above this zone, the current recovery structure remains active.
The immediate battle is around $100–$111. A confirmed breakout above $111.04 could open the path toward $129.49, followed by $150.08 and potentially $170.67.
However, rejection from resistance followed by a sustained loss of $91.88 would weaken the bullish structure and increase the risk of a deeper retracement toward the $87.71 area.
Bias: 🟢 Recovery structure intact above $91.88. A breakout above $111.04 could open the path toward $129.49, with $150.08 as the next major Fibonacci target.
$SOL
The broader recovery structure remains constructive, but SOL is now consolidating below the $100.59–$104.64 resistance cluster. Bulls need to reclaim this area and break the $107.07–$109.91 zone for the next major upside expansion.
📈 EMA Structure
20 EMA: $99.62
50 EMA: $92.58
100 EMA: $87.71
200 EMA: $91.88
SOL is currently testing the 20 EMA at $99.62.
The recovery above the 50 EMA at $92.58 and 200 EMA at $91.88 keeps the broader recovery structure intact.
A sustained hold above the 20 EMA would strengthen short-term momentum, while losing the $92.58–$91.88 area would weaken the current structure.
📐 Fibonacci Levels
Key Fibonacci levels:
0.236: $100.02
0.382: $129.49
0.5: $150.08
0.618: $170.67
0.786: $199.99
1.0: $237.33
SOL is currently testing the 0.236 Fibonacci region around $100.02.
The next major Fibonacci resistance is $129.49 — 0.382 Fib.
A sustained breakout above the $100–$107 resistance structure could open the path toward the $129.49 region.
🟢 Bullish Scenario
SOL is consolidating after the recent recovery and is currently building acceptance around the $99–$100 area.
Immediate resistance:
$100.02 — 0.236 Fibonacci
$100.59
$102.00
$102.29
$104.64
$107.07
$109.91
$111.04
A clean breakout and sustained close above $109.91–$111.04 would provide stronger confirmation of bullish continuation.
🎯 Target 1: $100.59
🎯 Target 2: $104.64
🎯 Target 3: $107.07
🎯 Target 4: $111.04
🎯 Target 5: $129.49 — 0.382 Fibonacci
🎯 Target 6: $150.08 — 0.5 Fibonacci
A confirmed breakout above the $109.91–$111.04 zone could strengthen the medium-term recovery structure and potentially accelerate SOL toward the $129–$150 region.
🔴 Pullback Scenario
After the recent bullish expansion, a retest of the breakout area would be normal.
Key supports:
$97.42
$96.33
$92.94
$92.58 — 50 EMA
$91.88 — 200 EMA
$87.71 — 100 EMA
The $92–$97 zone is particularly important.
If SOL continues to hold this area during a pullback, the current recovery structure remains valid.
A sustained loss of $91.88 would weaken the bullish setup and could expose the $87.71 support zone.
🧠 Market Structure & Liquidity
SOL has formed a clear recovery structure after sweeping liquidity around the $92–$94 demand region.
The recent move produced a market-structure shift followed by a breakout and higher-low formation.
SOL is now moving through an important:
Breakout → Retest → Consolidation → Continuation
structure.
The major upside liquidity is concentrated around $100–$111. A decisive breakout above this zone would place $129.49 as the next major Fibonacci target.
📊 RSI Momentum
RSI (14): 49.30
RSI has cooled back toward the neutral 50 level after the recent bullish expansion.
The current reading shows that short-term momentum is balanced rather than strongly overbought.
A sustained RSI move back above 50–55 would favor another bullish attempt toward the resistance zone.
A breakdown below 50 would indicate increasing short-term momentum weakness.
🎯 Key Levels
🔴 Major Resistance: $100.02 → $100.59 → $104.64 → $107.07 → $109.91 → $111.04
🟢 Major Support: $97.42 → $96.33 → $92.94 → $92.58 → $91.88
📉 Dynamic EMA Support: $92.58 — 50 EMA | $91.88 — 200 EMA | $87.71 — 100 EMA
🚀 Upside Targets: $111.04 → $129.49 → $150.08 → $170.67
📌 Final Outlook
SOL's broader structure remains constructive after the recent breakout, but price is currently consolidating around the $100 area and below the $100.59–$111 resistance zone.
The $92–$97 area is now the key short-term support region. As long as SOL holds above this zone, the current recovery structure remains active.
The immediate battle is around $100–$111. A confirmed breakout above $111.04 could open the path toward $129.49, followed by $150.08 and potentially $170.67.
However, rejection from resistance followed by a sustained loss of $91.88 would weaken the bullish structure and increase the risk of a deeper retracement toward the $87.71 area.
Bias: 🟢 Recovery structure intact above $91.88. A breakout above $111.04 could open the path toward $129.49, with $150.08 as the next major Fibonacci target.
$SOL
62
·
--
Məqalə
Tərcüməyə bax
ETH Technical Outlook: Ethereum Holds Above $2.4K as Bulls Defend the RecoveryETH is currently trading around $2.41K, holding above the $2.40K–$2.41K support area after the recent recovery from the $2.27K–$2.30K demand zone.
The broader recovery structure remains constructive, but ETH is now consolidating below the $2.436K–$2.454K resistance cluster. Bulls need to reclaim this area and break $2,538 for the next major upside expansion.
📈 EMA Structure
20 EMA: $2,436.39
50 EMA: $2,270.83
100 EMA: $2,151.49
200 EMA: $2,205.81
ETH remains above the 50, 100 and 200 EMAs.
The 20 EMA at $2,436.39 is currently the key short-term resistance. A sustained reclaim above this level would strengthen the bullish recovery structure.
The 200 EMA at $2,205.81 remains an important dynamic support.
📐 Fibonacci Levels
Key Fibonacci levels:
0.236: $2,315.21
0.382: $2,784.60
0.5: $3,163.97
0.618: $3,543.34
0.786: $4,083.46
1.0: $4,771.47
ETH has reclaimed the 0.236 Fibonacci region at $2,315.21, while the next major Fibonacci resistance is $2,784.60 — 0.382 Fib.
A sustained breakout above the current resistance structure could open the path toward the $2.78K region.
🟢 Bullish Scenario
ETH is consolidating after the recent recovery and is currently building acceptance around the $2.4K area.
Immediate resistance:
$2,436.39 — 20 EMA
$2,454.11
$2,475.84
$2,503.11
$2,512.77
$2,529.05
$2,538.00
A clean breakout and sustained close above $2,538 would provide stronger confirmation of bullish continuation.
🎯 Target 1: $2,475.84
🎯 Target 2: $2,503.11
🎯 Target 3: $2,538
🎯 Target 4: $2,784.60 — 0.382 Fibonacci
🎯 Target 5: $3,163.97 — 0.5 Fibonacci
A confirmed breakout above $2,538 could strengthen the medium-term structure and potentially accelerate ETH toward the $2.78K–$3.16K region.
🔴 Pullback Scenario
After the recent recovery, consolidation or a retest of the breakout area would be normal.
Key supports:
$2,405.75
$2,370.85
$2,358.59
$2,297.55
$2,270.83 — 50 EMA
$2,205.81 — 200 EMA
$2,151.49 — 100 EMA
The $2,358–$2,405 zone is particularly important.
If ETH continues to hold this area during a pullback, the current recovery structure remains valid.
A sustained loss of $2,315.21 would weaken the bullish setup and could expose the $2,270–$2,205 support zone.
🧠 Market Structure & Liquidity
ETH has formed a clear recovery structure after sweeping liquidity around the $2.27K–$2.30K demand region.
The recent move produced a market-structure shift followed by a breakout and higher-low formation.
ETH is now moving through an important:
Breakout → Retest → Consolidation → Continuation
structure.
The major upside liquidity remains around $2,436–$2,538. A decisive breakout above this zone would place $2,784.60 as the next major Fibonacci target.
📊 RSI Momentum
RSI (14): 51.31
RSI has cooled toward the neutral 50 level, showing that short-term momentum has weakened after the previous recovery.
A sustained RSI hold above 50–55 would favor another bullish attempt toward the resistance zone.
A breakdown below 50 would indicate increasing short-term momentum weakness.
🎯 Key Levels
🔴 Major Resistance: $2,436.39 → $2,454.11 → $2,475.84 → $2,503.11 → $2,538
🟢 Major Support: $2,405.75 → $2,370.85 → $2,358.59 → $2,297.55
📉 Dynamic EMA Support: $2,270.83 — 50 EMA | $2,205.81 — 200 EMA
🚀 Upside Targets: $2,538 → $2,784.60 → $3,163.97 → $3,543.34
📌 Final Outlook
ETH's broader structure remains constructive after the recent recovery, but price is currently consolidating below the $2.436K–$2.538K resistance zone.
The $2.358K–$2.405K area is now the key short-term support region. As long as ETH holds above this zone, the current recovery structure remains active.
The immediate battle is around $2,436–$2,538. A confirmed breakout above $2,538 could open the path toward $2,784.60, followed by $3,163.97 and potentially $3,543.34.
However, rejection from resistance followed by a sustained loss of $2,315.21 would weaken the bullish structure and increase the risk of a deeper retracement toward the $2,270–$2,205 area.
Bias: 🟢 Bullish above $2,315.21. A breakout above $2,538 could open the path toward $2,784.60, with $3,163.97 as the next major Fibonacci target.
$ETH
{future}(ETHUSDT)
ETH Technical Outlook: Ethereum Holds Above $2.4K as Bulls Defend the Recovery
ETH is currently trading around $2.41K, holding above the $2.40K–$2.41K support area after the recent recovery from the $2.27K–$2.30K demand zone.
The broader recovery structure remains constructive, but ETH is now consolidating below the $2.436K–$2.454K resistance cluster. Bulls need to reclaim this area and break $2,538 for the next major upside expansion.
📈 EMA Structure
20 EMA: $2,436.39
50 EMA: $2,270.83
100 EMA: $2,151.49
200 EMA: $2,205.81
ETH remains above the 50, 100 and 200 EMAs.
The 20 EMA at $2,436.39 is currently the key short-term resistance. A sustained reclaim above this level would strengthen the bullish recovery structure.
The 200 EMA at $2,205.81 remains an important dynamic support.
📐 Fibonacci Levels
Key Fibonacci levels:
0.236: $2,315.21
0.382: $2,784.60
0.5: $3,163.97
0.618: $3,543.34
0.786: $4,083.46
1.0: $4,771.47
ETH has reclaimed the 0.236 Fibonacci region at $2,315.21, while the next major Fibonacci resistance is $2,784.60 — 0.382 Fib.
A sustained breakout above the current resistance structure could open the path toward the $2.78K region.
🟢 Bullish Scenario
ETH is consolidating after the recent recovery and is currently building acceptance around the $2.4K area.
Immediate resistance:
$2,436.39 — 20 EMA
$2,454.11
$2,475.84
$2,503.11
$2,512.77
$2,529.05
$2,538.00
A clean breakout and sustained close above $2,538 would provide stronger confirmation of bullish continuation.
🎯 Target 1: $2,475.84
🎯 Target 2: $2,503.11
🎯 Target 3: $2,538
🎯 Target 4: $2,784.60 — 0.382 Fibonacci
🎯 Target 5: $3,163.97 — 0.5 Fibonacci
A confirmed breakout above $2,538 could strengthen the medium-term structure and potentially accelerate ETH toward the $2.78K–$3.16K region.
🔴 Pullback Scenario
After the recent recovery, consolidation or a retest of the breakout area would be normal.
Key supports:
$2,405.75
$2,370.85
$2,358.59
$2,297.55
$2,270.83 — 50 EMA
$2,205.81 — 200 EMA
$2,151.49 — 100 EMA
The $2,358–$2,405 zone is particularly important.
If ETH continues to hold this area during a pullback, the current recovery structure remains valid.
A sustained loss of $2,315.21 would weaken the bullish setup and could expose the $2,270–$2,205 support zone.
🧠 Market Structure & Liquidity
ETH has formed a clear recovery structure after sweeping liquidity around the $2.27K–$2.30K demand region.
The recent move produced a market-structure shift followed by a breakout and higher-low formation.
ETH is now moving through an important:
Breakout → Retest → Consolidation → Continuation
structure.
The major upside liquidity remains around $2,436–$2,538. A decisive breakout above this zone would place $2,784.60 as the next major Fibonacci target.
📊 RSI Momentum
RSI (14): 51.31
RSI has cooled toward the neutral 50 level, showing that short-term momentum has weakened after the previous recovery.
A sustained RSI hold above 50–55 would favor another bullish attempt toward the resistance zone.
A breakdown below 50 would indicate increasing short-term momentum weakness.
🎯 Key Levels
🔴 Major Resistance: $2,436.39 → $2,454.11 → $2,475.84 → $2,503.11 → $2,538
🟢 Major Support: $2,405.75 → $2,370.85 → $2,358.59 → $2,297.55
📉 Dynamic EMA Support: $2,270.83 — 50 EMA | $2,205.81 — 200 EMA
🚀 Upside Targets: $2,538 → $2,784.60 → $3,163.97 → $3,543.34
📌 Final Outlook
ETH's broader structure remains constructive after the recent recovery, but price is currently consolidating below the $2.436K–$2.538K resistance zone.
The $2.358K–$2.405K area is now the key short-term support region. As long as ETH holds above this zone, the current recovery structure remains active.
The immediate battle is around $2,436–$2,538. A confirmed breakout above $2,538 could open the path toward $2,784.60, followed by $3,163.97 and potentially $3,543.34.
However, rejection from resistance followed by a sustained loss of $2,315.21 would weaken the bullish structure and increase the risk of a deeper retracement toward the $2,270–$2,205 area.
Bias: 🟢 Bullish above $2,315.21. A breakout above $2,538 could open the path toward $2,784.60, with $3,163.97 as the next major Fibonacci target.
$ETH
The broader recovery structure remains constructive, but ETH is now consolidating below the $2.436K–$2.454K resistance cluster. Bulls need to reclaim this area and break $2,538 for the next major upside expansion.
📈 EMA Structure
20 EMA: $2,436.39
50 EMA: $2,270.83
100 EMA: $2,151.49
200 EMA: $2,205.81
ETH remains above the 50, 100 and 200 EMAs.
The 20 EMA at $2,436.39 is currently the key short-term resistance. A sustained reclaim above this level would strengthen the bullish recovery structure.
The 200 EMA at $2,205.81 remains an important dynamic support.
📐 Fibonacci Levels
Key Fibonacci levels:
0.236: $2,315.21
0.382: $2,784.60
0.5: $3,163.97
0.618: $3,543.34
0.786: $4,083.46
1.0: $4,771.47
ETH has reclaimed the 0.236 Fibonacci region at $2,315.21, while the next major Fibonacci resistance is $2,784.60 — 0.382 Fib.
A sustained breakout above the current resistance structure could open the path toward the $2.78K region.
🟢 Bullish Scenario
ETH is consolidating after the recent recovery and is currently building acceptance around the $2.4K area.
Immediate resistance:
$2,436.39 — 20 EMA
$2,454.11
$2,475.84
$2,503.11
$2,512.77
$2,529.05
$2,538.00
A clean breakout and sustained close above $2,538 would provide stronger confirmation of bullish continuation.
🎯 Target 1: $2,475.84
🎯 Target 2: $2,503.11
🎯 Target 3: $2,538
🎯 Target 4: $2,784.60 — 0.382 Fibonacci
🎯 Target 5: $3,163.97 — 0.5 Fibonacci
A confirmed breakout above $2,538 could strengthen the medium-term structure and potentially accelerate ETH toward the $2.78K–$3.16K region.
🔴 Pullback Scenario
After the recent recovery, consolidation or a retest of the breakout area would be normal.
Key supports:
$2,405.75
$2,370.85
$2,358.59
$2,297.55
$2,270.83 — 50 EMA
$2,205.81 — 200 EMA
$2,151.49 — 100 EMA
The $2,358–$2,405 zone is particularly important.
If ETH continues to hold this area during a pullback, the current recovery structure remains valid.
A sustained loss of $2,315.21 would weaken the bullish setup and could expose the $2,270–$2,205 support zone.
🧠 Market Structure & Liquidity
ETH has formed a clear recovery structure after sweeping liquidity around the $2.27K–$2.30K demand region.
The recent move produced a market-structure shift followed by a breakout and higher-low formation.
ETH is now moving through an important:
Breakout → Retest → Consolidation → Continuation
structure.
The major upside liquidity remains around $2,436–$2,538. A decisive breakout above this zone would place $2,784.60 as the next major Fibonacci target.
📊 RSI Momentum
RSI (14): 51.31
RSI has cooled toward the neutral 50 level, showing that short-term momentum has weakened after the previous recovery.
A sustained RSI hold above 50–55 would favor another bullish attempt toward the resistance zone.
A breakdown below 50 would indicate increasing short-term momentum weakness.
🎯 Key Levels
🔴 Major Resistance: $2,436.39 → $2,454.11 → $2,475.84 → $2,503.11 → $2,538
🟢 Major Support: $2,405.75 → $2,370.85 → $2,358.59 → $2,297.55
📉 Dynamic EMA Support: $2,270.83 — 50 EMA | $2,205.81 — 200 EMA
🚀 Upside Targets: $2,538 → $2,784.60 → $3,163.97 → $3,543.34
📌 Final Outlook
ETH's broader structure remains constructive after the recent recovery, but price is currently consolidating below the $2.436K–$2.538K resistance zone.
The $2.358K–$2.405K area is now the key short-term support region. As long as ETH holds above this zone, the current recovery structure remains active.
The immediate battle is around $2,436–$2,538. A confirmed breakout above $2,538 could open the path toward $2,784.60, followed by $3,163.97 and potentially $3,543.34.
However, rejection from resistance followed by a sustained loss of $2,315.21 would weaken the bullish structure and increase the risk of a deeper retracement toward the $2,270–$2,205 area.
Bias: 🟢 Bullish above $2,315.21. A breakout above $2,538 could open the path toward $2,784.60, with $3,163.97 as the next major Fibonacci target.
$ETH
63
·
--
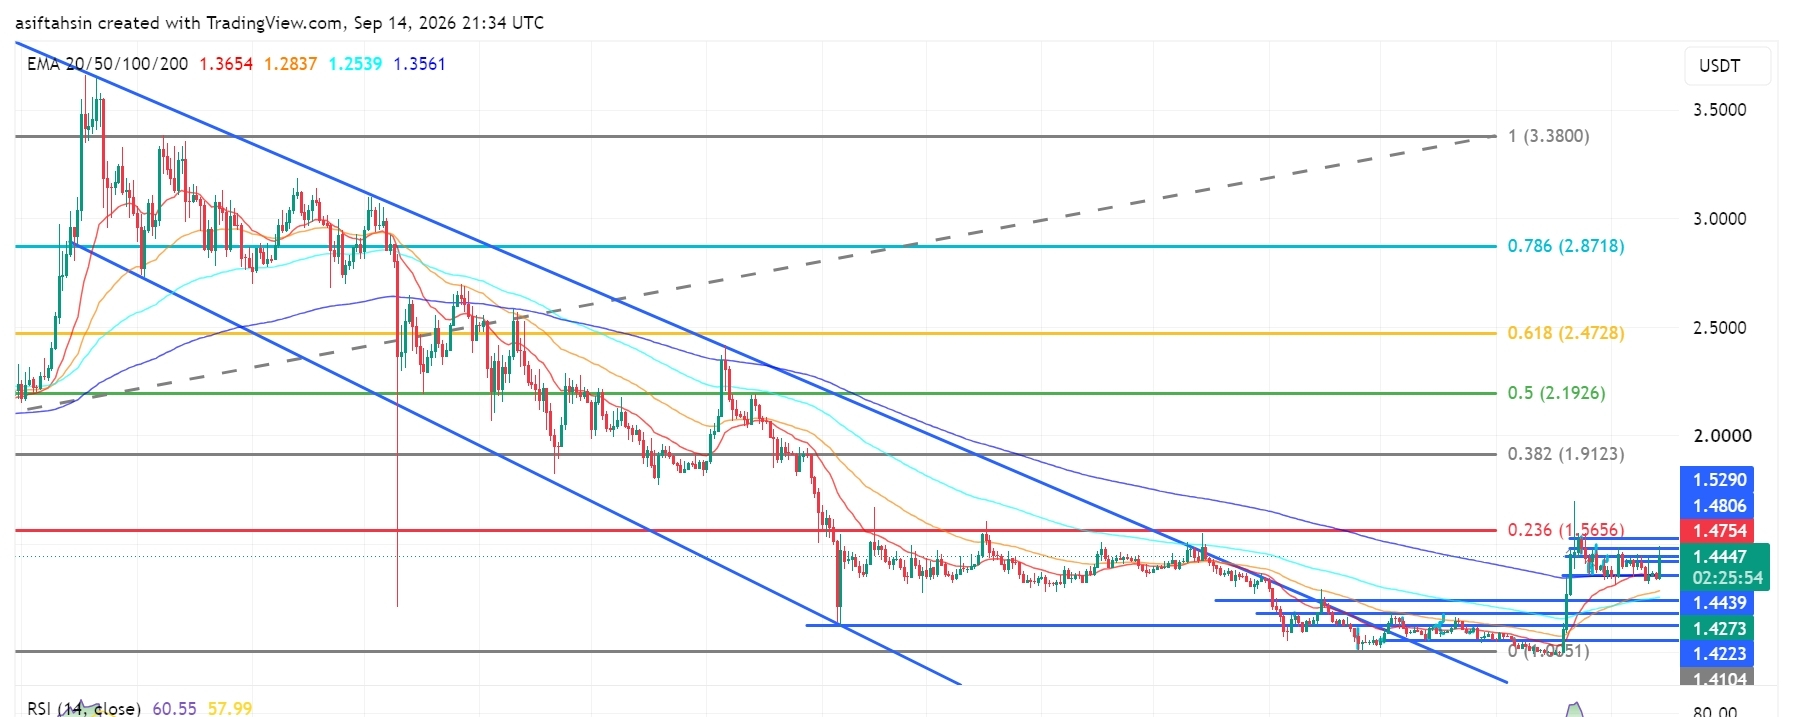
Məqalə
XRP Texniki Baxış: Boğalar $1.56-ya hədəf alarkən XRP $1.40-dan yuxarı qalırXRP hazırda $1.44 civarında ticarət edir, İyun–İyul minimumlarından güclü bərpanın ardınca mühüm $1.40 psixoloji səviyyəsindən yuxarı konsolidasiya olunur.
Ümumi struktur əhəmiyyətli dərəcədə yaxşılaşıb: XRP indi dörd əsas EMA-nın hamısından yuxarı ticarət edir. Buna baxmayaraq, qiymət $1.475–$1.53 ətrafındakı əsas müqavimət klasterinə yaxınlaşır. Boğaların bu zonadan yuxarı aydın bir qırılma etməsi $1.5656 Fibonaççi müqavimətinə gedən yolu açar.
📈 EMA Strukturu
20 EMA: $1.3653
50 EMA: $1.2837
100 EMA: $1.2539
200 EMA: $1.3561
XRP Texniki Baxış: Boğalar $1.56-ya hədəf alarkən XRP $1.40-dan yuxarı qalır
XRP hazırda $1.44 civarında ticarət edir, İyun–İyul minimumlarından güclü bərpanın ardınca mühüm $1.40 psixoloji səviyyəsindən yuxarı konsolidasiya olunur.
Ümumi struktur əhəmiyyətli dərəcədə yaxşılaşıb: XRP indi dörd əsas EMA-nın hamısından yuxarı ticarət edir. Buna baxmayaraq, qiymət $1.475–$1.53 ətrafındakı əsas müqavimət klasterinə yaxınlaşır. Boğaların bu zonadan yuxarı aydın bir qırılma etməsi $1.5656 Fibonaççi müqavimətinə gedən yolu açar.
📈 EMA Strukturu
20 EMA: $1.3653
50 EMA: $1.2837
100 EMA: $1.2539
200 EMA: $1.3561
Ümumi struktur əhəmiyyətli dərəcədə yaxşılaşıb: XRP indi dörd əsas EMA-nın hamısından yuxarı ticarət edir. Buna baxmayaraq, qiymət $1.475–$1.53 ətrafındakı əsas müqavimət klasterinə yaxınlaşır. Boğaların bu zonadan yuxarı aydın bir qırılma etməsi $1.5656 Fibonaççi müqavimətinə gedən yolu açar.
📈 EMA Strukturu
20 EMA: $1.3653
50 EMA: $1.2837
100 EMA: $1.2539
200 EMA: $1.3561
2
1
1.2k
·
--
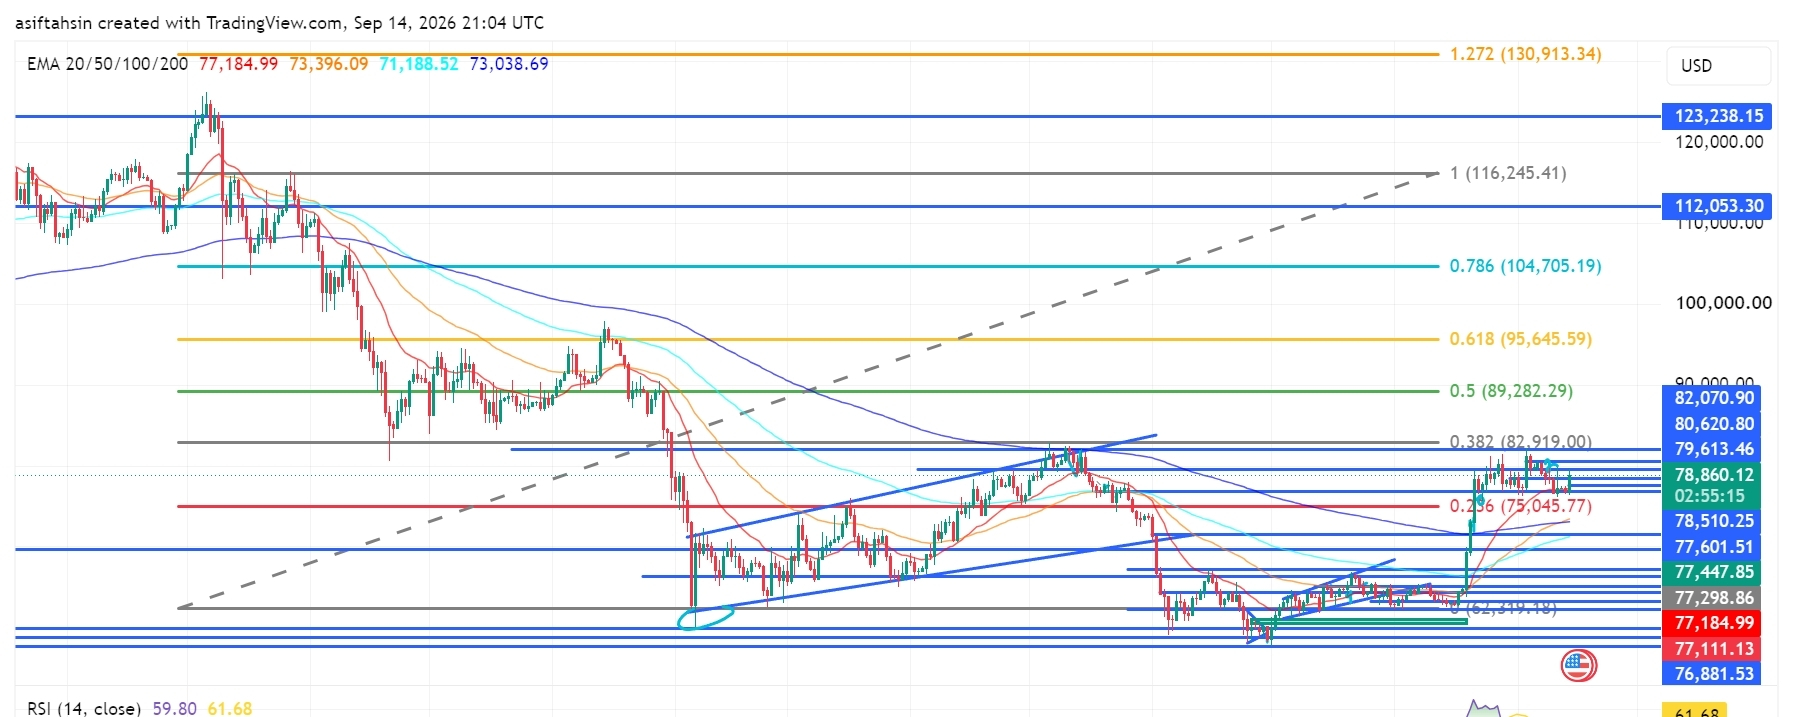
Məqalə
Tərcüməyə bax
Bitcoin (BTC) Technical Outlook: BTC Holds Above $78K as Bulls Target $80K–$83K ResistanceBTC is currently trading around $78,860, consolidating above the $78K level after a strong recovery from the June lows.
The broader structure remains constructive, with BTC trading above all four major EMAs. However, price is now approaching a significant resistance cluster around $79,613–$82,070. Bulls need a clean breakout above this zone to open the path toward the $82,919 Fibonacci resistance and potentially higher levels.
📈 EMA Structure
20 EMA: $77,182.98
50 EMA: $73,395.26
100 EMA: $71,188.10
200 EMA: $73,038.48
BTC remains above all four major EMAs, keeping the medium-term recovery structure bullish.
The $77,182.98 20 EMA is now the key dynamic support. As long as BTC remains above this level, buyers maintain control of the current recovery.
📐 Fibonacci Levels
0.236: $75,045.77
0.382: $82,919.00
0.5: $89,282.29
0.618: $95,645.59
0.786: $104,705.19
1.0: $116,245.41
1.272: $130,913.34
The $82,919 0.382 Fibonacci level is the next major upside objective after the current resistance cluster.
🟢 Bullish Scenario
BTC is consolidating just below the $79,613–$82,070 resistance area.
A clean breakout and sustained close above $82,070 could trigger another bullish expansion.
🎯 Target 1: $82,070
🎯 Target 2: $82,919
🎯 Target 3: $89,282
🎯 Target 4: $95,645
🎯 Target 5: $104,705
🎯 Target 6: $116,245
A decisive reclaim of $82,919 would be an important confirmation that BTC is transitioning into a stronger medium-term recovery phase.
🔴 Pullback Scenario
If BTC fails to break the $79,613–$82,070 resistance cluster, a short-term pullback could develop.
Key supports:
$78,510.25
$77,601.51
$77,447.85
$77,298.86
$77,182.98 — 20 EMA
$77,111.13
$76,881.53
$75,045.77 — 0.236 Fib
The $77,600–$77,180 region is particularly important. A successful retest here could provide a base for another attempt at the $80K+ resistance zone.
A sustained break below the 20 EMA at $77,182.98 would weaken the short-term bullish structure.
🧠 Market Structure & Liquidity
BTC's recent structure can be viewed as:
Liquidity Sweep → Accumulation → Higher Lows → Breakout → Reclaim → Consolidation → Potential Continuation
The June low created a major liquidity event, followed by accumulation and a gradual recovery.
BTC subsequently broke higher from the July–August consolidation structure and reclaimed the $75K area. Price is now consolidating near $79K, with the next major structural test sitting between $79,613 and $82,070.
A breakout above this region would put the $82,919 Fibonacci level into focus.
📊 RSI Momentum
RSI: 59.80
RSI MA: 61.68
RSI remains above 50, confirming that bullish momentum is still present.
However, RSI is currently slightly below its moving average, suggesting that momentum has cooled from the recent upside move. A renewed move above 62–65 would strengthen the continuation setup.
🎯 Key Levels
Resistance:
$79,613.46 → $80,620.80 → $82,070.90 → $82,919 → $89,282.29 → $95,645.59
Support:
$78,510.25 → $77,601.51 → $77,447.85 → $77,298.86 → $77,182.98 → $77,111.13 → $76,881.53 → $75,045.77
📌 Final Outlook
BTC remains in a constructive recovery structure while holding above the $77K area and all four major EMAs.
The immediate battle is $79,613–$82,070. A decisive breakout above this zone could push BTC toward $82,919 → $89,282 → $95,645, while a sustained reclaim of $82,919 could open the path toward the higher Fibonacci levels.
On the downside, $77,182.98 is the key dynamic support. As long as BTC holds above this level, the broader bullish recovery remains intact.
Bias: 🟢 Bullish above $77,183 | Stronger above $82,070
$BTC
{future}(BTCUSDT)
Bitcoin (BTC) Technical Outlook: BTC Holds Above $78K as Bulls Target $80K–$83K Resistance
BTC is currently trading around $78,860, consolidating above the $78K level after a strong recovery from the June lows.
The broader structure remains constructive, with BTC trading above all four major EMAs. However, price is now approaching a significant resistance cluster around $79,613–$82,070. Bulls need a clean breakout above this zone to open the path toward the $82,919 Fibonacci resistance and potentially higher levels.
📈 EMA Structure
20 EMA: $77,182.98
50 EMA: $73,395.26
100 EMA: $71,188.10
200 EMA: $73,038.48
BTC remains above all four major EMAs, keeping the medium-term recovery structure bullish.
The $77,182.98 20 EMA is now the key dynamic support. As long as BTC remains above this level, buyers maintain control of the current recovery.
📐 Fibonacci Levels
0.236: $75,045.77
0.382: $82,919.00
0.5: $89,282.29
0.618: $95,645.59
0.786: $104,705.19
1.0: $116,245.41
1.272: $130,913.34
The $82,919 0.382 Fibonacci level is the next major upside objective after the current resistance cluster.
🟢 Bullish Scenario
BTC is consolidating just below the $79,613–$82,070 resistance area.
A clean breakout and sustained close above $82,070 could trigger another bullish expansion.
🎯 Target 1: $82,070
🎯 Target 2: $82,919
🎯 Target 3: $89,282
🎯 Target 4: $95,645
🎯 Target 5: $104,705
🎯 Target 6: $116,245
A decisive reclaim of $82,919 would be an important confirmation that BTC is transitioning into a stronger medium-term recovery phase.
🔴 Pullback Scenario
If BTC fails to break the $79,613–$82,070 resistance cluster, a short-term pullback could develop.
Key supports:
$78,510.25
$77,601.51
$77,447.85
$77,298.86
$77,182.98 — 20 EMA
$77,111.13
$76,881.53
$75,045.77 — 0.236 Fib
The $77,600–$77,180 region is particularly important. A successful retest here could provide a base for another attempt at the $80K+ resistance zone.
A sustained break below the 20 EMA at $77,182.98 would weaken the short-term bullish structure.
🧠 Market Structure & Liquidity
BTC's recent structure can be viewed as:
Liquidity Sweep → Accumulation → Higher Lows → Breakout → Reclaim → Consolidation → Potential Continuation
The June low created a major liquidity event, followed by accumulation and a gradual recovery.
BTC subsequently broke higher from the July–August consolidation structure and reclaimed the $75K area. Price is now consolidating near $79K, with the next major structural test sitting between $79,613 and $82,070.
A breakout above this region would put the $82,919 Fibonacci level into focus.
📊 RSI Momentum
RSI: 59.80
RSI MA: 61.68
RSI remains above 50, confirming that bullish momentum is still present.
However, RSI is currently slightly below its moving average, suggesting that momentum has cooled from the recent upside move. A renewed move above 62–65 would strengthen the continuation setup.
🎯 Key Levels
Resistance:
$79,613.46 → $80,620.80 → $82,070.90 → $82,919 → $89,282.29 → $95,645.59
Support:
$78,510.25 → $77,601.51 → $77,447.85 → $77,298.86 → $77,182.98 → $77,111.13 → $76,881.53 → $75,045.77
📌 Final Outlook
BTC remains in a constructive recovery structure while holding above the $77K area and all four major EMAs.
The immediate battle is $79,613–$82,070. A decisive breakout above this zone could push BTC toward $82,919 → $89,282 → $95,645, while a sustained reclaim of $82,919 could open the path toward the higher Fibonacci levels.
On the downside, $77,182.98 is the key dynamic support. As long as BTC holds above this level, the broader bullish recovery remains intact.
Bias: 🟢 Bullish above $77,183 | Stronger above $82,070
$BTC
The broader structure remains constructive, with BTC trading above all four major EMAs. However, price is now approaching a significant resistance cluster around $79,613–$82,070. Bulls need a clean breakout above this zone to open the path toward the $82,919 Fibonacci resistance and potentially higher levels.
📈 EMA Structure
20 EMA: $77,182.98
50 EMA: $73,395.26
100 EMA: $71,188.10
200 EMA: $73,038.48
BTC remains above all four major EMAs, keeping the medium-term recovery structure bullish.
The $77,182.98 20 EMA is now the key dynamic support. As long as BTC remains above this level, buyers maintain control of the current recovery.
📐 Fibonacci Levels
0.236: $75,045.77
0.382: $82,919.00
0.5: $89,282.29
0.618: $95,645.59
0.786: $104,705.19
1.0: $116,245.41
1.272: $130,913.34
The $82,919 0.382 Fibonacci level is the next major upside objective after the current resistance cluster.
🟢 Bullish Scenario
BTC is consolidating just below the $79,613–$82,070 resistance area.
A clean breakout and sustained close above $82,070 could trigger another bullish expansion.
🎯 Target 1: $82,070
🎯 Target 2: $82,919
🎯 Target 3: $89,282
🎯 Target 4: $95,645
🎯 Target 5: $104,705
🎯 Target 6: $116,245
A decisive reclaim of $82,919 would be an important confirmation that BTC is transitioning into a stronger medium-term recovery phase.
🔴 Pullback Scenario
If BTC fails to break the $79,613–$82,070 resistance cluster, a short-term pullback could develop.
Key supports:
$78,510.25
$77,601.51
$77,447.85
$77,298.86
$77,182.98 — 20 EMA
$77,111.13
$76,881.53
$75,045.77 — 0.236 Fib
The $77,600–$77,180 region is particularly important. A successful retest here could provide a base for another attempt at the $80K+ resistance zone.
A sustained break below the 20 EMA at $77,182.98 would weaken the short-term bullish structure.
🧠 Market Structure & Liquidity
BTC's recent structure can be viewed as:
Liquidity Sweep → Accumulation → Higher Lows → Breakout → Reclaim → Consolidation → Potential Continuation
The June low created a major liquidity event, followed by accumulation and a gradual recovery.
BTC subsequently broke higher from the July–August consolidation structure and reclaimed the $75K area. Price is now consolidating near $79K, with the next major structural test sitting between $79,613 and $82,070.
A breakout above this region would put the $82,919 Fibonacci level into focus.
📊 RSI Momentum
RSI: 59.80
RSI MA: 61.68
RSI remains above 50, confirming that bullish momentum is still present.
However, RSI is currently slightly below its moving average, suggesting that momentum has cooled from the recent upside move. A renewed move above 62–65 would strengthen the continuation setup.
🎯 Key Levels
Resistance:
$79,613.46 → $80,620.80 → $82,070.90 → $82,919 → $89,282.29 → $95,645.59
Support:
$78,510.25 → $77,601.51 → $77,447.85 → $77,298.86 → $77,182.98 → $77,111.13 → $76,881.53 → $75,045.77
📌 Final Outlook
BTC remains in a constructive recovery structure while holding above the $77K area and all four major EMAs.
The immediate battle is $79,613–$82,070. A decisive breakout above this zone could push BTC toward $82,919 → $89,282 → $95,645, while a sustained reclaim of $82,919 could open the path toward the higher Fibonacci levels.
On the downside, $77,182.98 is the key dynamic support. As long as BTC holds above this level, the broader bullish recovery remains intact.
Bias: 🟢 Bullish above $77,183 | Stronger above $82,070
$BTC
69
·
--
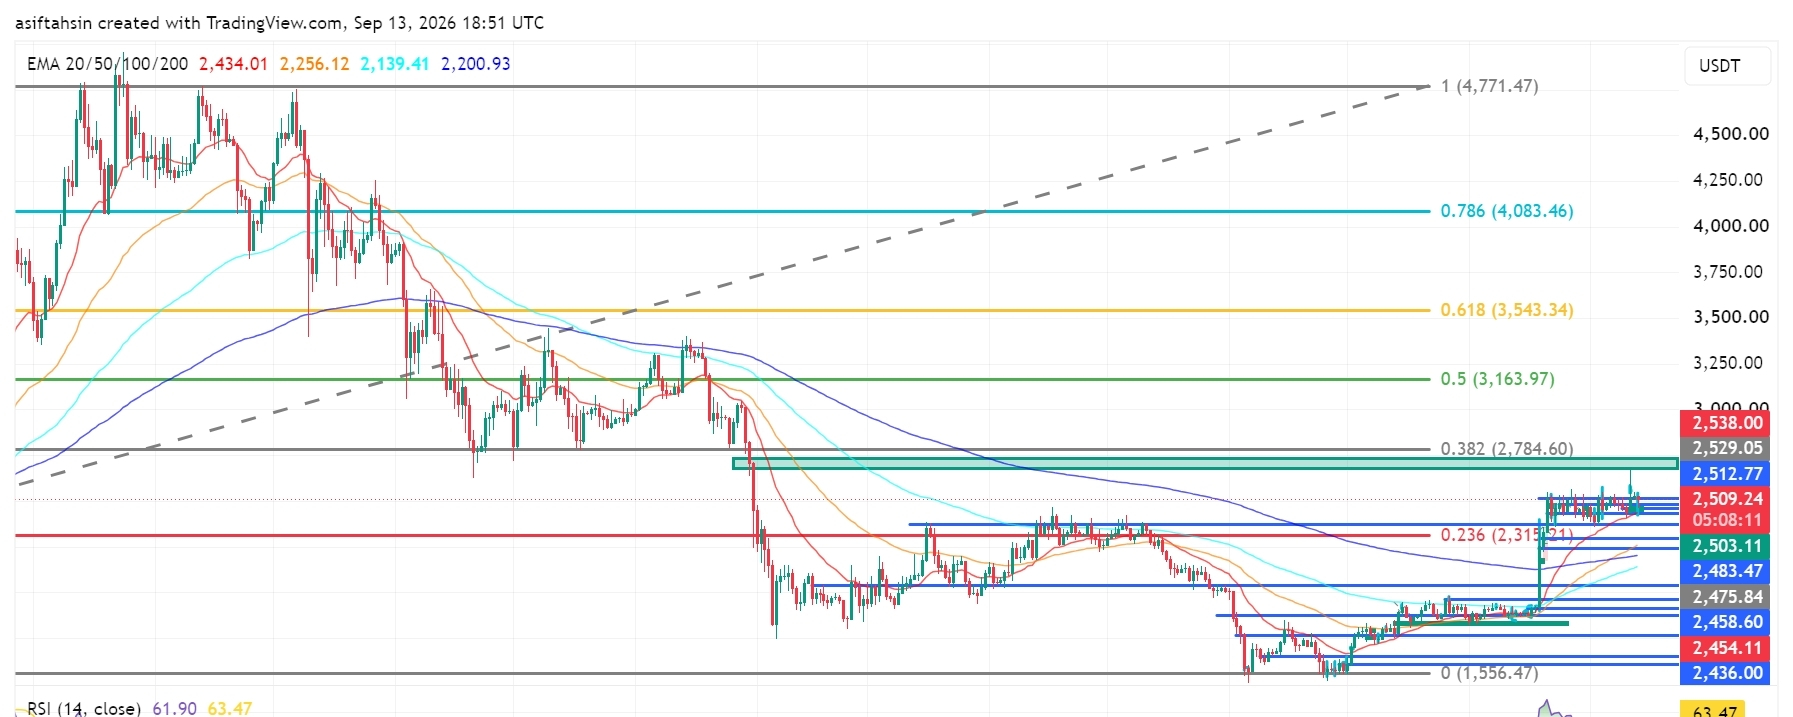
Məqalə
Tərcüməyə bax
Solana (SOL) Technical Outlook: SOL Holds Above $100 as Bulls Target Higher ResistanceSOL is currently trading around $101.25, consolidating above the psychological $100 level after a strong recovery from the June lows.
The broader structure is showing signs of improvement, with SOL now trading above all four major EMAs. However, price is facing a significant resistance cluster around $102.29–$104.64. Bulls need a clean breakout above this zone to open the path toward the $107–$109 area and the $129.49 Fibonacci resistance.
📈 EMA Structure
20 EMA: $99.76
50 EMA: $92.04
100 EMA: $87.25
200 EMA: $91.74
SOL is currently trading above all four major EMAs, supporting the ongoing recovery structure.
The $99.76 20 EMA is the key dynamic support. As long as SOL remains above this level, buyers maintain control of the current short-term structure.
📐 Fibonacci Levels
0.236: $104.00
0.382: $129.49
0.5: $150.08
0.618: $170.67
0.786: $199.99
1.0: $237.33
The $104.00 0.236 Fibonacci level is the immediate major resistance. A successful reclaim could strengthen the path toward $129.49.
🟢 Bullish Scenario
SOL is consolidating around the $100–$102 region after recovering from the recent lows.
A clean breakout and sustained close above $104.64 could trigger another bullish expansion.
🎯 Target 1: $107.07
🎯 Target 2: $109.84
🎯 Target 3: $112.00
🎯 Target 4: $129.49
🎯 Target 5: $150.08
🎯 Target 6: $170.67
A decisive reclaim of $129.49 would be an important confirmation that SOL is transitioning into a stronger medium-term recovery phase.
🔴 Pullback Scenario
If SOL fails to break the $102.29–$104.64 resistance cluster, a short-term pullback could develop.
Key supports:
$100.59
$99.76
$96.33
$92.94
$92.04
$91.74 — 200 EMA
$87.25 — 100 EMA
$86.69
The $100.59–$99.76 region is particularly important. A successful retest here could provide a base for another attempt at the $104 resistance.
A sustained break below the 20 EMA at $99.76 would weaken the short-term bullish structure.
🧠 Market Structure & Liquidity
SOL's recent structure can be viewed as:
Liquidity Sweep → Accumulation → Higher Lows → MSS/BOS → Breakout → Reclaim → Consolidation → Potential Continuation
The June low created a major liquidity event, followed by a prolonged accumulation phase and gradual recovery.
SOL has now reclaimed the $100 psychological level and is holding above the major EMA cluster.
The next major structural test is $102.29–$104.64, followed by the $107–$112 resistance area.
📊 RSI Momentum
RSI: 56.24
RSI MA: 61.94
RSI remains above 50, indicating that bullish momentum is still present.
However, RSI is currently below its moving average, suggesting that momentum has cooled from the recent upside move. A renewed push above 60–62 would strengthen the continuation setup.
🎯 Key Levels
Resistance:
$102.29 → $104.00 → $104.64 → $107.07 → $109.84 → $112.00 → $129.49
Support:
$100.59 → $99.76 → $96.33 → $92.94 → $92.04 → $91.74 → $87.25 → $86.69
📌 Final Outlook
SOL remains in a constructive recovery structure while holding above the $100 area and all major EMAs.
The immediate battle is $102.29–$104.64. A decisive breakout above this zone could push SOL toward $107 → $109.84 → $112, while a sustained move beyond these levels could open the path toward $129.49.
On the downside, $99.76 is the key dynamic support. As long as SOL holds above this level, the broader recovery structure remains intact.
Bias: 🟢 Bullish above $99.76 | Stronger above $104.64
$SOL
{future}(SOLUSDT)
Solana (SOL) Technical Outlook: SOL Holds Above $100 as Bulls Target Higher Resistance
SOL is currently trading around $101.25, consolidating above the psychological $100 level after a strong recovery from the June lows.
The broader structure is showing signs of improvement, with SOL now trading above all four major EMAs. However, price is facing a significant resistance cluster around $102.29–$104.64. Bulls need a clean breakout above this zone to open the path toward the $107–$109 area and the $129.49 Fibonacci resistance.
📈 EMA Structure
20 EMA: $99.76
50 EMA: $92.04
100 EMA: $87.25
200 EMA: $91.74
SOL is currently trading above all four major EMAs, supporting the ongoing recovery structure.
The $99.76 20 EMA is the key dynamic support. As long as SOL remains above this level, buyers maintain control of the current short-term structure.
📐 Fibonacci Levels
0.236: $104.00
0.382: $129.49
0.5: $150.08
0.618: $170.67
0.786: $199.99
1.0: $237.33
The $104.00 0.236 Fibonacci level is the immediate major resistance. A successful reclaim could strengthen the path toward $129.49.
🟢 Bullish Scenario
SOL is consolidating around the $100–$102 region after recovering from the recent lows.
A clean breakout and sustained close above $104.64 could trigger another bullish expansion.
🎯 Target 1: $107.07
🎯 Target 2: $109.84
🎯 Target 3: $112.00
🎯 Target 4: $129.49
🎯 Target 5: $150.08
🎯 Target 6: $170.67
A decisive reclaim of $129.49 would be an important confirmation that SOL is transitioning into a stronger medium-term recovery phase.
🔴 Pullback Scenario
If SOL fails to break the $102.29–$104.64 resistance cluster, a short-term pullback could develop.
Key supports:
$100.59
$99.76
$96.33
$92.94
$92.04
$91.74 — 200 EMA
$87.25 — 100 EMA
$86.69
The $100.59–$99.76 region is particularly important. A successful retest here could provide a base for another attempt at the $104 resistance.
A sustained break below the 20 EMA at $99.76 would weaken the short-term bullish structure.
🧠 Market Structure & Liquidity
SOL's recent structure can be viewed as:
Liquidity Sweep → Accumulation → Higher Lows → MSS/BOS → Breakout → Reclaim → Consolidation → Potential Continuation
The June low created a major liquidity event, followed by a prolonged accumulation phase and gradual recovery.
SOL has now reclaimed the $100 psychological level and is holding above the major EMA cluster.
The next major structural test is $102.29–$104.64, followed by the $107–$112 resistance area.
📊 RSI Momentum
RSI: 56.24
RSI MA: 61.94
RSI remains above 50, indicating that bullish momentum is still present.
However, RSI is currently below its moving average, suggesting that momentum has cooled from the recent upside move. A renewed push above 60–62 would strengthen the continuation setup.
🎯 Key Levels
Resistance:
$102.29 → $104.00 → $104.64 → $107.07 → $109.84 → $112.00 → $129.49
Support:
$100.59 → $99.76 → $96.33 → $92.94 → $92.04 → $91.74 → $87.25 → $86.69
📌 Final Outlook
SOL remains in a constructive recovery structure while holding above the $100 area and all major EMAs.
The immediate battle is $102.29–$104.64. A decisive breakout above this zone could push SOL toward $107 → $109.84 → $112, while a sustained move beyond these levels could open the path toward $129.49.
On the downside, $99.76 is the key dynamic support. As long as SOL holds above this level, the broader recovery structure remains intact.
Bias: 🟢 Bullish above $99.76 | Stronger above $104.64
$SOL
The broader structure is showing signs of improvement, with SOL now trading above all four major EMAs. However, price is facing a significant resistance cluster around $102.29–$104.64. Bulls need a clean breakout above this zone to open the path toward the $107–$109 area and the $129.49 Fibonacci resistance.
📈 EMA Structure
20 EMA: $99.76
50 EMA: $92.04
100 EMA: $87.25
200 EMA: $91.74
SOL is currently trading above all four major EMAs, supporting the ongoing recovery structure.
The $99.76 20 EMA is the key dynamic support. As long as SOL remains above this level, buyers maintain control of the current short-term structure.
📐 Fibonacci Levels
0.236: $104.00
0.382: $129.49
0.5: $150.08
0.618: $170.67
0.786: $199.99
1.0: $237.33
The $104.00 0.236 Fibonacci level is the immediate major resistance. A successful reclaim could strengthen the path toward $129.49.
🟢 Bullish Scenario
SOL is consolidating around the $100–$102 region after recovering from the recent lows.
A clean breakout and sustained close above $104.64 could trigger another bullish expansion.
🎯 Target 1: $107.07
🎯 Target 2: $109.84
🎯 Target 3: $112.00
🎯 Target 4: $129.49
🎯 Target 5: $150.08
🎯 Target 6: $170.67
A decisive reclaim of $129.49 would be an important confirmation that SOL is transitioning into a stronger medium-term recovery phase.
🔴 Pullback Scenario
If SOL fails to break the $102.29–$104.64 resistance cluster, a short-term pullback could develop.
Key supports:
$100.59
$99.76
$96.33
$92.94
$92.04
$91.74 — 200 EMA
$87.25 — 100 EMA
$86.69
The $100.59–$99.76 region is particularly important. A successful retest here could provide a base for another attempt at the $104 resistance.
A sustained break below the 20 EMA at $99.76 would weaken the short-term bullish structure.
🧠 Market Structure & Liquidity
SOL's recent structure can be viewed as:
Liquidity Sweep → Accumulation → Higher Lows → MSS/BOS → Breakout → Reclaim → Consolidation → Potential Continuation
The June low created a major liquidity event, followed by a prolonged accumulation phase and gradual recovery.
SOL has now reclaimed the $100 psychological level and is holding above the major EMA cluster.
The next major structural test is $102.29–$104.64, followed by the $107–$112 resistance area.
📊 RSI Momentum
RSI: 56.24
RSI MA: 61.94
RSI remains above 50, indicating that bullish momentum is still present.
However, RSI is currently below its moving average, suggesting that momentum has cooled from the recent upside move. A renewed push above 60–62 would strengthen the continuation setup.
🎯 Key Levels
Resistance:
$102.29 → $104.00 → $104.64 → $107.07 → $109.84 → $112.00 → $129.49
Support:
$100.59 → $99.76 → $96.33 → $92.94 → $92.04 → $91.74 → $87.25 → $86.69
📌 Final Outlook
SOL remains in a constructive recovery structure while holding above the $100 area and all major EMAs.
The immediate battle is $102.29–$104.64. A decisive breakout above this zone could push SOL toward $107 → $109.84 → $112, while a sustained move beyond these levels could open the path toward $129.49.
On the downside, $99.76 is the key dynamic support. As long as SOL holds above this level, the broader recovery structure remains intact.
Bias: 🟢 Bullish above $99.76 | Stronger above $104.64
$SOL
61
Daha çox kontent araşdırmaq üçün daxil olun
Binance Square-də qlobal kriptovalyuta istifadəçilərinə qoşulun
⚡️ Kriptovalyuta haqqında ən son və faydalı məlumatları əldə edin.
💬 Dünyanın ən böyük kriptovalyuta birjası tərəfindən etibar edilir.
👍 Doğrulanmış yaradıcılardan gələn real məlumatları kəşf edin.
E-poçt/Telefon nömrəsi
Trenddə olan mövzular
AIStocksWhatNext
361,914 baxış
Müzakirə edir: 2,973
Trendləşən hashtag kampaniyamızda Paylaş və Qazan Trafik Mükafatı
✨ Mövzu: AI səhmələri yüksəlməyə davam etdikcə hansı digər investisiya imkanları hələ də qalır?
👉 Necə qoşulmaq:
#AIStocksWhatNext hashtagı ilə qısa post və ya məqalə dərc edin
Bəllə edin ki, siz boğasınız, yoxsa ayısınız, həm də AI səhm portfelinizi və ya treydinizi paylaşın — treyd widgetından istifadə uyğunluğunuzu artıra bilər.
Həmçinin məlumatlar və ya qrafiklər paylaşaraq postunuzu gücləndirə, AI tərəfindən yaradılmış şəkillərdən isə çəkinə bilərsiniz.
✍️ Aşağıdakı bucaqlara əsasən kontent yaradın:
- Nvidia deyir ki, çip satışları gələn il ikiqat olacaq və aparıcı AI şirkətləri rekord gəlir vurmağa davam edir — bunun arxasında dayanan hesablama xərci də həqiqətən heyrətamiz dərəcədə böyükdür. AI tələbi doğrudan da artır? Və bu nə qədər davam edə bilər? AI səhmələri bütün bazarda yüksəlib. Bu, real bir qırılma/breakout-dur, yoxsa sadəcə qısamüddətli sıçrayış?
- Sənaye liderləri AI inkişafını ləngitmək çağırışı edir, Trump isə gələcəkdə AI-nin ABŞ ÜDM-nin 25%-ni təşkil edə biləcəyini iddia edərək “AI Force” qurmaq planı haqqında danışır. Sizin tərəfiniz kim tərəfindədır? Dövlət səviyyəsində dəstək AI səhmələri üçün uzunmüddətli qazanc olacaqmı?
- Siz AI səhmələrini alırsınız? Trade paylaşma widgetımızla AI ilə bağlı treydinizi və ya portfelinizi paylaşın.
⏰ Kampaniya Dövrü:
- 2026-09-22 7:00 - 2026-09-24 4:00 UTC
🎁 Mükafat:
- Yuxarıdakı qaydalara uyğun gələn və 100-dən çox söz ehtiva edən ixtisaslı postlar nəzərdən keçiriləcək və 500-dən 3,000-ə qədər təsadüfi trafik artımı ala bilər. Postunuz seçilərsə, feed katibinizdən bildiriş alacaqsınız.
- Məqalənizin Binance Square Official-da nümayiş olunması üçün şans qazanın
Postunuz üçün ideyalar lazımdır? Mövzu səhifəsinə keçin #AIStocksWhatNext və ya Square Guide on How to Post for Better Reach.
Binance Square Official
·363 bəyənmə
·889.7k baxış
BitcoinBreaksAboveMayHighNears$86K
14,630 baxış
Müzakirə edir: 190
DogecoinRises15%
46,381 baxış
Müzakirə edir: 984