

CryptoFrontNews
17.8k Paylaşımlar

CryptoFrontNews
 Square Verified+
Şikayət et
İstifadəçini blokla
CryptoFrontNews (CFN) delivers the latest in cryptocurrency with real-time updates, expert analyses, and in-depth articles on digital currencies and blockchain.
4 İzlənilir
12.7K+ İzləyicilər
19.1K+ Bəyəndi
Postlar
Məqalə
Tərcüməyə bax
Stellar Price Eyes $0.80 as XLM Faces Two Major CeilingsXLM trades near $0.1689 after falling from September highs above $0.23, with immediate support around 0.167–0.165.
Analyst identifies $0.2254 as the first resistance, followed by a major 0.45–0.50 zone on the potential path toward $0.80.
RSI remains below 50 and MACD is slightly bearish; a break below $0.165 could extend losses, while reclaiming $0.180 may improve momentum.
Stellar’s XLM token is testing support near $0.17 as analyst Giannis Andreou outlines two resistance levels before a potential move toward $0.80. Andreou identified $0.2254 as the first hurdle, followed by macro resistance between $0.45 and $0.50. Meanwhile, the four-hour chart shows continued selling pressure after XLM’s decline from September highs above $0.23.
XLM Tests Support After Falling From September Highs
XLM traded between $0.21 and $0.23 in late September, briefly moving above $0.23 around September 29. However, momentum weakened in October, pushing the token below $0.21 and $0.20.
A rebound toward $0.205 around October 11 failed to reverse the decline. By mid-October, XLM had dropped below $0.19, while another recovery attempt near $0.187 around October 21 also faded.
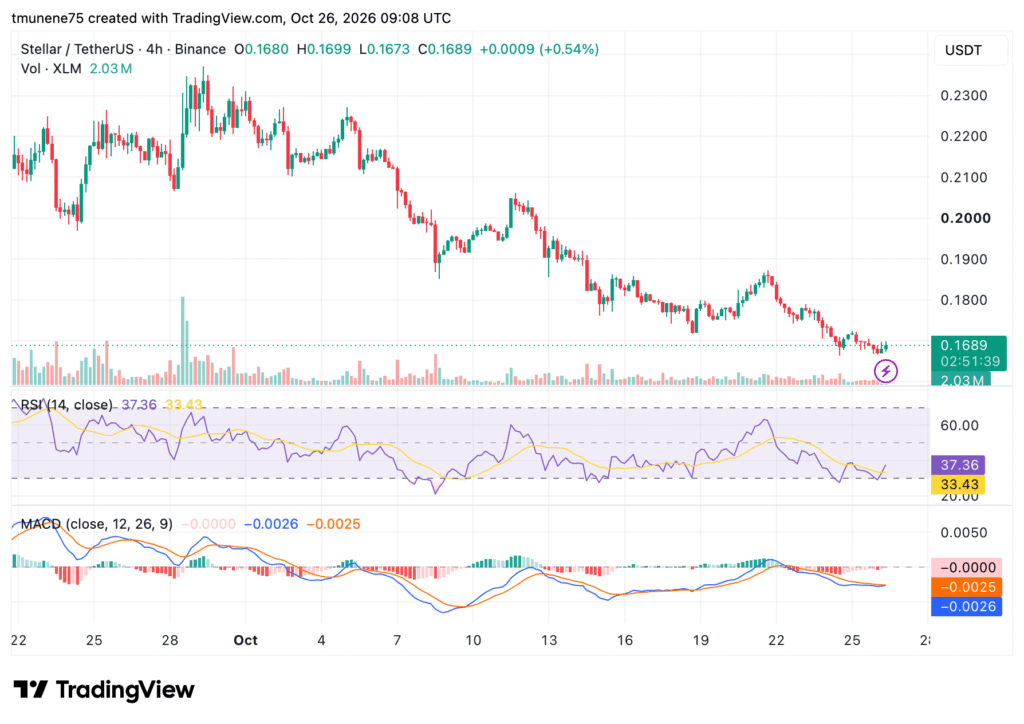
The latest four-hour Binance chart shows XLM at $0.1689, up 0.54% on the latest candle. The candle opened at $0.1680, reached $0.1699, and fell to $0.1673. Trading volume stood at 2.03 million XLM.
Source: TradingView
The Relative Strength Index is at 37.36, above its average of 33.43 but below the neutral 50 level. Meanwhile, the MACD line remains slightly below its signal line, with readings of -0.0026 and -0.0025, respectively.
Andreou Identifies $0.2254 as First Resistance
Andreou said XLM’s weekly chart is testing rising support around 0.16–0.17. The recovery would first need to reclaim $0.2254 and break above a steeper descending trendline.
A successful move could bring the 0.45–0.50 macro resistance zone into focus. Andreou’s scenario allows for an initial rejection before another breakout attempt. If XLM later turns that trendline into support, the analyst sees a possible route toward $0.80.
XLM Support Levels Could Shape the Next Move
The four-hour chart places immediate support around 0.167–0.165, followed by $0.160. A break below $0.165 could extend the decline.
However, resistance is around 0.175–0.180, with another barrier between $0.187 and $0.190. A sustained recovery above $0.180 would provide an early sign of improving price momentum. Andreou warned that losing rising support would weaken the recovery setup.
Stellar Price Eyes $0.80 as XLM Faces Two Major Ceilings
XLM trades near $0.1689 after falling from September highs above $0.23, with immediate support around 0.167–0.165.
Analyst identifies $0.2254 as the first resistance, followed by a major 0.45–0.50 zone on the potential path toward $0.80.
RSI remains below 50 and MACD is slightly bearish; a break below $0.165 could extend losses, while reclaiming $0.180 may improve momentum.
Stellar’s XLM token is testing support near $0.17 as analyst Giannis Andreou outlines two resistance levels before a potential move toward $0.80. Andreou identified $0.2254 as the first hurdle, followed by macro resistance between $0.45 and $0.50. Meanwhile, the four-hour chart shows continued selling pressure after XLM’s decline from September highs above $0.23.
XLM Tests Support After Falling From September Highs
XLM traded between $0.21 and $0.23 in late September, briefly moving above $0.23 around September 29. However, momentum weakened in October, pushing the token below $0.21 and $0.20.
A rebound toward $0.205 around October 11 failed to reverse the decline. By mid-October, XLM had dropped below $0.19, while another recovery attempt near $0.187 around October 21 also faded.
The latest four-hour Binance chart shows XLM at $0.1689, up 0.54% on the latest candle. The candle opened at $0.1680, reached $0.1699, and fell to $0.1673. Trading volume stood at 2.03 million XLM.
Source: TradingView
The Relative Strength Index is at 37.36, above its average of 33.43 but below the neutral 50 level. Meanwhile, the MACD line remains slightly below its signal line, with readings of -0.0026 and -0.0025, respectively.
Andreou Identifies $0.2254 as First Resistance
Andreou said XLM’s weekly chart is testing rising support around 0.16–0.17. The recovery would first need to reclaim $0.2254 and break above a steeper descending trendline.
A successful move could bring the 0.45–0.50 macro resistance zone into focus. Andreou’s scenario allows for an initial rejection before another breakout attempt. If XLM later turns that trendline into support, the analyst sees a possible route toward $0.80.
XLM Support Levels Could Shape the Next Move
The four-hour chart places immediate support around 0.167–0.165, followed by $0.160. A break below $0.165 could extend the decline.
However, resistance is around 0.175–0.180, with another barrier between $0.187 and $0.190. A sustained recovery above $0.180 would provide an early sign of improving price momentum. Andreou warned that losing rising support would weaken the recovery setup.
30

Məqalə
Tərcüməyə bax
Tokenized Assets Surge Toward $40 BillionSupply the chart shows that the total value of tokenized assets increased from $0.7 billion in 2021-$38.8 billion in 2026 year-to-date.
Ondo brings traditional financial products like Treasuries and equities to the tokenized asset space.
Market value alone cannot establish trading activity, investor access, or Ondo’s share of the expanding tokenized asset market.
Total value of tokenized assets increased 500,000-fold, growing from $0.7 billion in 2021 to $38.8 billion in 2026.
Tokenized Assets Record Rapid Market Growth
The chart shows that the growth is steady and begins to rise significantly in 2023.Market value in 2023 was USD 1.7 billion and USD 1 billion in 2022. Total reached $10.1 billion by 2024.
Source: X
The value reported for the increase went up to $25.5 billion in 2025. The YTD total for 2026 is $38.8B. But that is not an actual calendar year.
The biggest increase was in 2024 with a total increase of almost six times. The following year added another $15.4 billion to the reported market value. The latest figure adds $13.3 billion beyond the 2025 total.
These figures describe the market’s reported value rather than its daily trading activity. They also fail to identify the quantity of investors who are trading tokenised financial products. Trading volumes and ownership figures would provide additional context.
Ondo Brings Traditional Financial Products On-Chain
ALLINCRYPTO linked the market’s expansion to Ondo and blockchain-based financial products. The post identified stocks and US Treasuries as examples of assets being tokenized. It described Ondo as a leading participant in this developing market.
Tokenization creates digital representations of assets through blockchain-based systems. Depending on their structure, these products can provide exposure to traditional financial instruments. Their ownership rights and redemption conditions depend on the arrangements governing each offering.
Tokenized Treasuries connect blockchain users with products linked to government debt. Tokenized equities extend similar arrangements to stock-market investments. These products remain distinct from cryptocurrencies because their value relates to underlying financial assets.
Ondo’s position in this sector places its offerings within a growing market. However, the supplied chart does not identify individual issuers or their respective market shares. It therefore cannot establish how much of the reported growth belongs to Ondo.
Market Growth Faces Practical Tests
A higher reported value does not necessarily imply improved liquidity or greater accessibility to investors. There are also products that could have a large stake but do not trade on the secondary market often. Some other people might support other uses, such as lending and using as collateral.
The other factor that investors consider is who the owner of the investment is and how secure the investment is. Redemption procedures and accurate pricing matter when products represent traditional financial assets. Access may also depend on eligibility rules and the jurisdictions involved.
The supplied material does not include a current ONDO token price. It also provides no figures linking token performance directly to the market’s expansion. Those measurements would be needed to assess price movements against sector growth.
The distinction between market expansion and individual project performance remains important. A growing category does not guarantee that every issuer will attract equal demand. Ondo’s position would require separate figures on its products and activity.
The chart shows that the value of the tokenized asset has risen significantly since 2021. This growth was especially marked from 2024. The growth will be determined by how these products meet the needs of investors and financial markets.
Tokenized Assets Surge Toward $40 Billion
Supply the chart shows that the total value of tokenized assets increased from $0.7 billion in 2021-$38.8 billion in 2026 year-to-date.
Ondo brings traditional financial products like Treasuries and equities to the tokenized asset space.
Market value alone cannot establish trading activity, investor access, or Ondo’s share of the expanding tokenized asset market.
Total value of tokenized assets increased 500,000-fold, growing from $0.7 billion in 2021 to $38.8 billion in 2026.
Tokenized Assets Record Rapid Market Growth
The chart shows that the growth is steady and begins to rise significantly in 2023.Market value in 2023 was USD 1.7 billion and USD 1 billion in 2022. Total reached $10.1 billion by 2024.
Source: X
The value reported for the increase went up to $25.5 billion in 2025. The YTD total for 2026 is $38.8B. But that is not an actual calendar year.
The biggest increase was in 2024 with a total increase of almost six times. The following year added another $15.4 billion to the reported market value. The latest figure adds $13.3 billion beyond the 2025 total.
These figures describe the market’s reported value rather than its daily trading activity. They also fail to identify the quantity of investors who are trading tokenised financial products. Trading volumes and ownership figures would provide additional context.
Ondo Brings Traditional Financial Products On-Chain
ALLINCRYPTO linked the market’s expansion to Ondo and blockchain-based financial products. The post identified stocks and US Treasuries as examples of assets being tokenized. It described Ondo as a leading participant in this developing market.
Tokenization creates digital representations of assets through blockchain-based systems. Depending on their structure, these products can provide exposure to traditional financial instruments. Their ownership rights and redemption conditions depend on the arrangements governing each offering.
Tokenized Treasuries connect blockchain users with products linked to government debt. Tokenized equities extend similar arrangements to stock-market investments. These products remain distinct from cryptocurrencies because their value relates to underlying financial assets.
Ondo’s position in this sector places its offerings within a growing market. However, the supplied chart does not identify individual issuers or their respective market shares. It therefore cannot establish how much of the reported growth belongs to Ondo.
Market Growth Faces Practical Tests
A higher reported value does not necessarily imply improved liquidity or greater accessibility to investors. There are also products that could have a large stake but do not trade on the secondary market often. Some other people might support other uses, such as lending and using as collateral.
The other factor that investors consider is who the owner of the investment is and how secure the investment is. Redemption procedures and accurate pricing matter when products represent traditional financial assets. Access may also depend on eligibility rules and the jurisdictions involved.
The supplied material does not include a current ONDO token price. It also provides no figures linking token performance directly to the market’s expansion. Those measurements would be needed to assess price movements against sector growth.
The distinction between market expansion and individual project performance remains important. A growing category does not guarantee that every issuer will attract equal demand. Ondo’s position would require separate figures on its products and activity.
The chart shows that the value of the tokenized asset has risen significantly since 2021. This growth was especially marked from 2024. The growth will be determined by how these products meet the needs of investors and financial markets.
143
Məqalə
Tərcüməyə bax
Ethena (ENA) Rebounds 8.8% as Analysts Watch $0.25 TargetENA rebounded 8.8% after Arthur Hayes sold 14 million tokens worth about $2.7 million, but the token remains below its 200-day moving average.
CryptoBullet expects a prolonged correction and identifies 0.122–0.172 as a potential buying zone before another sustained breakout.
Crypto Patel targets $0.25 initially, with longer-term levels up to $3; a break above $0.223 could strengthen the recovery outlook.
Ethena’s ENA token has rebounded 8.8% after Arthur Hayes sold 14 million tokens worth approximately $2.7 million. Analysts CryptoBullet and Crypto Patel have outlined different paths for the token, with both tracking potential gains. However, CryptoBullet expects a prolonged correction, while ENA trades near $0.211 below its 200-day moving average.
https://twitter.com/CryptoPatel/status/2112959601834426860?s=20
CryptoBullet Expects a Longer Correction Before Breakout
CryptoBullet said ENA rose fourfold between July and September, describing the rally as a sign of strength. The analyst classified the move as an aggressive five-wave impulse and expects a correction before another sustained breakout.
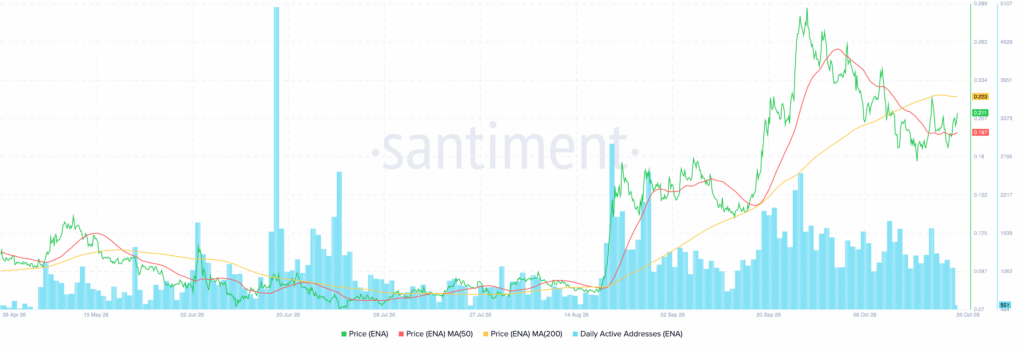
According to CryptoBullet, the pullback so far has not been sufficient. The analyst anticipates a prolonged flat correction and identified 0.122–0.172 as a potential buying zone. Meanwhile, ENA’s chart shows a decline from approximately 0.10–0.13 in late April toward 0.07–0.08 by mid-August.
The token then climbed above $0.10 in late August before accelerating toward $0.285 in September. However, October selling pushed it back toward 0.18–0.20 before the recent recovery.
Crypto Patel Maps ENA Targets From $0.13 to $3
Crypto Patel highlighted a possible trend reversal on the higher-timeframe chart and listed $0.13 and $0.25 as initial price targets. The analyst also identified longer-term targets at $0.50, $0.80, $1.25, and $3.
ENA currently trades around $0.211, above its 50-day moving average near $0.197 but below its 200-day average around $0.223. The latter level remains an important resistance area, while 0.197–0.200 provides near-term support.
ENA Network Activity and Resistance Levels Remain in Focus
The chart records major spikes in daily active addresses during June and the August–September rally. Network activity rose alongside the price advance, although recent readings alone cannot establish sustained adoption.
Source: Santiment
A move above $0.223 could open the way toward resistance between $0.234 and $0.250. Conversely, a break below $0.197 could expose ENA to further downside, with $0.180 representing another support level.
Ethena (ENA) Rebounds 8.8% as Analysts Watch $0.25 Target
ENA rebounded 8.8% after Arthur Hayes sold 14 million tokens worth about $2.7 million, but the token remains below its 200-day moving average.
CryptoBullet expects a prolonged correction and identifies 0.122–0.172 as a potential buying zone before another sustained breakout.
Crypto Patel targets $0.25 initially, with longer-term levels up to $3; a break above $0.223 could strengthen the recovery outlook.
Ethena’s ENA token has rebounded 8.8% after Arthur Hayes sold 14 million tokens worth approximately $2.7 million. Analysts CryptoBullet and Crypto Patel have outlined different paths for the token, with both tracking potential gains. However, CryptoBullet expects a prolonged correction, while ENA trades near $0.211 below its 200-day moving average.
https://twitter.com/CryptoPatel/status/2112959601834426860?s=20
CryptoBullet Expects a Longer Correction Before Breakout
CryptoBullet said ENA rose fourfold between July and September, describing the rally as a sign of strength. The analyst classified the move as an aggressive five-wave impulse and expects a correction before another sustained breakout.
According to CryptoBullet, the pullback so far has not been sufficient. The analyst anticipates a prolonged flat correction and identified 0.122–0.172 as a potential buying zone. Meanwhile, ENA’s chart shows a decline from approximately 0.10–0.13 in late April toward 0.07–0.08 by mid-August.
The token then climbed above $0.10 in late August before accelerating toward $0.285 in September. However, October selling pushed it back toward 0.18–0.20 before the recent recovery.
Crypto Patel Maps ENA Targets From $0.13 to $3
Crypto Patel highlighted a possible trend reversal on the higher-timeframe chart and listed $0.13 and $0.25 as initial price targets. The analyst also identified longer-term targets at $0.50, $0.80, $1.25, and $3.
ENA currently trades around $0.211, above its 50-day moving average near $0.197 but below its 200-day average around $0.223. The latter level remains an important resistance area, while 0.197–0.200 provides near-term support.
ENA Network Activity and Resistance Levels Remain in Focus
The chart records major spikes in daily active addresses during June and the August–September rally. Network activity rose alongside the price advance, although recent readings alone cannot establish sustained adoption.
Source: Santiment
A move above $0.223 could open the way toward resistance between $0.234 and $0.250. Conversely, a break below $0.197 could expose ENA to further downside, with $0.180 representing another support level.
106
Məqalə
Analitik xəbərdarlıq edir: Balinalar satışa davam etsə, XRP 22% ucuzlaşa bilər10–100 milyon token saxlayan XRP pul kisələrinin sayı 351-dən 339-a düşüb, birjalardakı qalıqlar isə təxminən 50 milyon XRP artıb.
Ali Charts xəbərdarlıq edir ki, qiymət 1,26 dollardan aşağı düşərsə, 1,11 və 0,98 dollar səviyyələrindəki hədəflərə enə bilər.
XRP 50 və 200 günlük hərəkətli ortalamalarının altında ticarət olunur. Sahiblərin sayı 8,25 milyona çatsa da, aktiv ünvanların sayı təxminən 23 800-ə düşüb.
Analitik Ali Charts-ın sözlərinə görə, iri sahiblər satışa davam etsə və qiymət 1,26 dollardan aşağı düşsə, XRP 0,98 dollara doğru enə bilər. Analitik 10–100 milyon XRP saxlayan pul kisələrinin sayının azaldığını, birjalardakı qalıqların isə artdığını bildirib. Bu arada, XRP oktyabrın 26-da 1,276 dollardan ticarət olunub ki, bu da onun 50 günlük hərəkətli ortalamasından aşağıdır.
Analitik xəbərdarlıq edir: Balinalar satışa davam etsə, XRP 22% ucuzlaşa bilər
10–100 milyon token saxlayan XRP pul kisələrinin sayı 351-dən 339-a düşüb, birjalardakı qalıqlar isə təxminən 50 milyon XRP artıb.
Ali Charts xəbərdarlıq edir ki, qiymət 1,26 dollardan aşağı düşərsə, 1,11 və 0,98 dollar səviyyələrindəki hədəflərə enə bilər.
XRP 50 və 200 günlük hərəkətli ortalamalarının altında ticarət olunur. Sahiblərin sayı 8,25 milyona çatsa da, aktiv ünvanların sayı təxminən 23 800-ə düşüb.
Analitik Ali Charts-ın sözlərinə görə, iri sahiblər satışa davam etsə və qiymət 1,26 dollardan aşağı düşsə, XRP 0,98 dollara doğru enə bilər. Analitik 10–100 milyon XRP saxlayan pul kisələrinin sayının azaldığını, birjalardakı qalıqların isə artdığını bildirib. Bu arada, XRP oktyabrın 26-da 1,276 dollardan ticarət olunub ki, bu da onun 50 günlük hərəkətli ortalamasından aşağıdır.
1
892
Məqalə
Tərcüməyə bax
Ethereum Market Cap Drops $54B as ETH Tests $2,300Ethereum’s market cap fell by $54 billion in three weeks as total open interest across exchanges dropped to $11.5 billion.
Binance open interest declined by $1.3 billion to $5.7 billion, while Gate, HTX and Bybit also recorded substantial monthly decreases.
ETH trades near $2,304 with bearish RSI and MACD readings; a break below $2,300 could expose $2,250 and $2,200 support.
Ethereum has lost $54 billion in market capitalization over three weeks as ETH fell about 15% and derivatives traders reduced exposure. Analyst Darkfost reported that total Ethereum open interest across exchanges dropped to $11.5 billion. Meanwhile, ETH traded near $2,304.53 on October 26, as technical indicators showed continued selling pressure.
Ethereum Open Interest Falls Across Major Exchanges
Darkfost reported that Ethereum open interest on Binance declined by $1.3 billion in one month, reaching $5.7 billion. Across other platforms, Gate recorded a $995 million decrease, HTX lost $857 million, and Bybit fell by $310 million over 30 days.
Despite the declines, Binance still accounted for 50% of Ethereum’s total open interest. Bybit held 17.5%, while Gate and OKX each accounted for 14.7%. Darkfost attributed the broader decline to falling prices, liquidations, and traders closing positions to reduce risk.
The analyst also noted that open interest fell more sharply in July. That deleveraging period preceded Ethereum’s stabilization and a technical rebound exceeding 32%, which pushed ETH above $2,800 for the first time since January.
ETH Chart Shows Bearish Momentum Near $2,300
The four-hour ETH/USD chart on Binance showed ETH trading at $2,304.53 on October 26, down $13.02, or 0.56%, on the latest candle. Ethereum traded around $2,700 in early October before falling below $2,600 and then $2,500.
Temporary rebounds lifted ETH toward $2,550 around October 12 and $2,510 on October 21. However, sellers regained control, pushing the price toward $2,300.
Source: TradingView
The Relative Strength Index stood at 36.68, below its moving average of 38.42. The MACD line also remained below its signal line, at -25.29 versus -22.21, with a histogram reading of -3.08.
Support Levels Put $2,250 and $2,200 in Focus
Ethereum is testing support near $2,300, with a breakdown potentially exposing $2,250 and $2,200. Resistance is around 2,350–2,400, followed by $2,500. Darkfost described deleveraging as part of the correction process, noting that such periods can bring fear and sometimes precede a final correction phase.
Ethereum Market Cap Drops $54B as ETH Tests $2,300
Ethereum’s market cap fell by $54 billion in three weeks as total open interest across exchanges dropped to $11.5 billion.
Binance open interest declined by $1.3 billion to $5.7 billion, while Gate, HTX and Bybit also recorded substantial monthly decreases.
ETH trades near $2,304 with bearish RSI and MACD readings; a break below $2,300 could expose $2,250 and $2,200 support.
Ethereum has lost $54 billion in market capitalization over three weeks as ETH fell about 15% and derivatives traders reduced exposure. Analyst Darkfost reported that total Ethereum open interest across exchanges dropped to $11.5 billion. Meanwhile, ETH traded near $2,304.53 on October 26, as technical indicators showed continued selling pressure.
Ethereum Open Interest Falls Across Major Exchanges
Darkfost reported that Ethereum open interest on Binance declined by $1.3 billion in one month, reaching $5.7 billion. Across other platforms, Gate recorded a $995 million decrease, HTX lost $857 million, and Bybit fell by $310 million over 30 days.
Despite the declines, Binance still accounted for 50% of Ethereum’s total open interest. Bybit held 17.5%, while Gate and OKX each accounted for 14.7%. Darkfost attributed the broader decline to falling prices, liquidations, and traders closing positions to reduce risk.
The analyst also noted that open interest fell more sharply in July. That deleveraging period preceded Ethereum’s stabilization and a technical rebound exceeding 32%, which pushed ETH above $2,800 for the first time since January.
ETH Chart Shows Bearish Momentum Near $2,300
The four-hour ETH/USD chart on Binance showed ETH trading at $2,304.53 on October 26, down $13.02, or 0.56%, on the latest candle. Ethereum traded around $2,700 in early October before falling below $2,600 and then $2,500.
Temporary rebounds lifted ETH toward $2,550 around October 12 and $2,510 on October 21. However, sellers regained control, pushing the price toward $2,300.
Source: TradingView
The Relative Strength Index stood at 36.68, below its moving average of 38.42. The MACD line also remained below its signal line, at -25.29 versus -22.21, with a histogram reading of -3.08.
Support Levels Put $2,250 and $2,200 in Focus
Ethereum is testing support near $2,300, with a breakdown potentially exposing $2,250 and $2,200. Resistance is around 2,350–2,400, followed by $2,500. Darkfost described deleveraging as part of the correction process, noting that such periods can bring fear and sometimes precede a final correction phase.
1
92
Məqalə
Tərcüməyə bax
Bitcoin Whales Hold Back as Retail Deposits Nearly DoubleRetail Bitcoin inflows to Binance nearly doubled to $10.75 billion over 30 days, while whale deposits fell from $5.9 billion to $3.8 billion.
Ali Charts identifies $82,000 as resistance and $72,500 as a potential buying level if Bitcoin’s correction continues.
Bitcoin’s deepest drawdown in the current cycle has reached 7%, compared with declines of 28% or more in previous completed cycles.
Bitcoin faces a potential correction toward $72,500 as analyst Ali Charts tracks a breakdown below a rising channel. Meanwhile, Darkfost’s data shows retail Bitcoin inflows to Binance have reached a six-month high, while whale deposits continue declining. The contrasting trends come as BTC holds above $80,000 and analysts assess drawdowns during the current market cycle.
Retail Bitcoin Inflows Rise as Whale Deposits Decline
According to Darkfost, retail investors’ 30-day Bitcoin inflows to Binance nearly doubled from $5.5 billion to $10.75 billion. The increase marks their highest level in six months, following Bitcoin’s sustained position above $80,000 for several weeks.
Whale inflows have moved in the opposite direction. Their Bitcoin deposits to Binance declined steadily for almost two months, falling from $5.9 billion in late August to $3.8 billion.
Darkfost said retail investors may view the rebound as an opportunity to sell at more comfortable prices after a year-long decline. However, whales have shown less urgency to transfer Bitcoin to exchanges. The analyst said their reduced deposits suggest they are not rushing to distribute holdings at current levels.
Ali Charts Identifies $72,500 as Potential Buying Level
Ali Charts reported that Bitcoin appeared to break below a rising parallel channel on the four-hour chart. The analyst identified $82,000 as resistance and said BTC could continue correcting if that level holds.
https://twitter.com/alicharts/status/2114605513430462861?s=20
Under this scenario, Bitcoin could fall toward $72,500, where Ali Charts plans to look for another buying opportunity.
Darkfost Compares Bitcoin Drawdowns Across Cycles
Darkfost also examined how Bitcoin’s largest drawdowns have changed across market cycles. The first cycle recorded a 93% decline, compared with 35% in the second cycle and 53% during the 2021 cycle.
The most recent completed cycle saw drawdowns remain below 28%. Since the July 1 low, the current cycle’s deepest recorded drawdown has reached 7%.
https://twitter.com/Darkfost_Coc/status/2114478672614940895?s=20
Darkfost described pullbacks as normal during bull markets, when Bitcoin often corrects or trades sideways. The analyst said traders could use these declines to manage exposure during uptrends.
Bitcoin Whales Hold Back as Retail Deposits Nearly Double
Retail Bitcoin inflows to Binance nearly doubled to $10.75 billion over 30 days, while whale deposits fell from $5.9 billion to $3.8 billion.
Ali Charts identifies $82,000 as resistance and $72,500 as a potential buying level if Bitcoin’s correction continues.
Bitcoin’s deepest drawdown in the current cycle has reached 7%, compared with declines of 28% or more in previous completed cycles.
Bitcoin faces a potential correction toward $72,500 as analyst Ali Charts tracks a breakdown below a rising channel. Meanwhile, Darkfost’s data shows retail Bitcoin inflows to Binance have reached a six-month high, while whale deposits continue declining. The contrasting trends come as BTC holds above $80,000 and analysts assess drawdowns during the current market cycle.
Retail Bitcoin Inflows Rise as Whale Deposits Decline
According to Darkfost, retail investors’ 30-day Bitcoin inflows to Binance nearly doubled from $5.5 billion to $10.75 billion. The increase marks their highest level in six months, following Bitcoin’s sustained position above $80,000 for several weeks.
Whale inflows have moved in the opposite direction. Their Bitcoin deposits to Binance declined steadily for almost two months, falling from $5.9 billion in late August to $3.8 billion.
Darkfost said retail investors may view the rebound as an opportunity to sell at more comfortable prices after a year-long decline. However, whales have shown less urgency to transfer Bitcoin to exchanges. The analyst said their reduced deposits suggest they are not rushing to distribute holdings at current levels.
Ali Charts Identifies $72,500 as Potential Buying Level
Ali Charts reported that Bitcoin appeared to break below a rising parallel channel on the four-hour chart. The analyst identified $82,000 as resistance and said BTC could continue correcting if that level holds.
https://twitter.com/alicharts/status/2114605513430462861?s=20
Under this scenario, Bitcoin could fall toward $72,500, where Ali Charts plans to look for another buying opportunity.
Darkfost Compares Bitcoin Drawdowns Across Cycles
Darkfost also examined how Bitcoin’s largest drawdowns have changed across market cycles. The first cycle recorded a 93% decline, compared with 35% in the second cycle and 53% during the 2021 cycle.
The most recent completed cycle saw drawdowns remain below 28%. Since the July 1 low, the current cycle’s deepest recorded drawdown has reached 7%.
https://twitter.com/Darkfost_Coc/status/2114478672614940895?s=20
Darkfost described pullbacks as normal during bull markets, when Bitcoin often corrects or trades sideways. The analyst said traders could use these declines to manage exposure during uptrends.
1
138
Məqalə
Sinqapur, Malayziya və Tailand rəqəmsal puldan istifadənin genişləndirilməsinə təkan verirSinqapurun MAS-ı, Bank Negara Malaysia və Tailand Bankı sərhədlərarası rəqəmsal pul hesablaşmaları üzrə sənaye nümayəndələri ilə əməkdaşlıq edəcək.
BLOOM rəqəmsal pulun qəbulunu, sərhədlərarası hesablaşmaları, şəbəkələrin qarşılıqlı fəaliyyətini və şəxsiyyətin yoxlanılması, eləcə də sanksiya yoxlamaları kimi proqramlaşdırıla bilən nəzarət mexanizmlərini əhatə edəcək.
Ripple, Visa, Mastercard və Dünya Bankı Qrupu ödənişlər, xəzinədarlıq və ticarətin maliyyələşdirilməsi sahələrində tətbiq imkanlarını araşdıran iştirakçılar arasındadır.
Sinqapur, Malayziya və Tailand sərhədlərarası rəqəmsal pul hesablaşmaları üzrə maliyyə şirkətləri ilə birgə çalışacaq. Sinqapur Monetar İdarəsi BLOOM təşəbbüsünü oktyabrın 23-də elan edib. Bank Negara Malaysia və Tailand Bankı siyasət müəyyən edən qurumlar qismində təşəbbüsə qoşulub. Onlar müxtəlif qurum və yurisdiksiyalarda tənzimlənən stabilkoinlər və tokenləşdirilmiş depozitlər üçün yanaşmaların hazırlanmasına kömək edəcəklər.
Sinqapur, Malayziya və Tailand rəqəmsal puldan istifadənin genişləndirilməsinə təkan verir
Sinqapurun MAS-ı, Bank Negara Malaysia və Tailand Bankı sərhədlərarası rəqəmsal pul hesablaşmaları üzrə sənaye nümayəndələri ilə əməkdaşlıq edəcək.
BLOOM rəqəmsal pulun qəbulunu, sərhədlərarası hesablaşmaları, şəbəkələrin qarşılıqlı fəaliyyətini və şəxsiyyətin yoxlanılması, eləcə də sanksiya yoxlamaları kimi proqramlaşdırıla bilən nəzarət mexanizmlərini əhatə edəcək.
Ripple, Visa, Mastercard və Dünya Bankı Qrupu ödənişlər, xəzinədarlıq və ticarətin maliyyələşdirilməsi sahələrində tətbiq imkanlarını araşdıran iştirakçılar arasındadır.
Sinqapur, Malayziya və Tailand sərhədlərarası rəqəmsal pul hesablaşmaları üzrə maliyyə şirkətləri ilə birgə çalışacaq. Sinqapur Monetar İdarəsi BLOOM təşəbbüsünü oktyabrın 23-də elan edib. Bank Negara Malaysia və Tailand Bankı siyasət müəyyən edən qurumlar qismində təşəbbüsə qoşulub. Onlar müxtəlif qurum və yurisdiksiyalarda tənzimlənən stabilkoinlər və tokenləşdirilmiş depozitlər üçün yanaşmaların hazırlanmasına kömək edəcəklər.
317

Məqalə
Tərcüməyə bax
HTX Adds Russia to Restricted Jurisdictions After Bitget and MEXCHTX has added Russia to its restricted jurisdictions, potentially limiting account access and withdrawals for affected individuals and businesses.
Bitget and MEXC also restricted Russian market access in October, citing prohibited jurisdictions and regulatory compliance concerns.
Analysts point to rising regulatory and sanctions risks, though there is no evidence of coordinated action among the exchanges.
HTX has added Russia to its restricted jurisdictions, allowing the cryptocurrency exchange to limit services for Russian users. According to Russian business outlet RBC, the restrictions cover individuals residing in or located in Russia, alongside companies registered or primarily operating there. The move follows similar decisions by Bitget and MEXC in October, although HTX’s effective date remains unspecified.
https://twitter.com/WuBlockchain/status/2113804669357310017?s=20
HTX Agreement Allows Account Closures and Withdrawal Suspensions
According to HTX’s user agreement, the exchange may restrict access, suspend withdrawals, or close accounts belonging to affected users. The agreement also allows HTX to change its restricted jurisdictions list without notifying customers individually.
The list includes the United States, the United Kingdom, the European Union, Singapore, Hong Kong, Iran, Syria, and other countries and territories. These restrictions apply to both individuals and businesses meeting the agreement’s location or registration criteria.
HTX maintains separate restrictions on derivatives trading, which involves financial instruments linked to asset price movements. Those limits cover users from Taiwan, Israel, Iraq, Bangladesh, Bolivia, Ecuador, Kyrgyzstan, and New Zealand.
Founded in 2013 as Huobi, the exchange adopted the HTX name in 2023. Its services include spot cryptocurrency trading, futures, other derivatives, blockchain-related services, investments, and cryptocurrency storage.
Bitget and MEXC Also Restrict Russian Market Access
HTX’s decision follows restrictions announced by Bitget and MEXC earlier in October. Bitget added Russia, Belarus, and Kazakhstan to its prohibited jurisdictions list and advised affected clients to withdraw their funds by October 21.
MEXC announced its withdrawal from the Russian and Belarusian markets on October 20. The exchange cited improvements to its regulatory compliance system as the reason for its decision.
Analysts Point to Regulatory and Sanctions Risks
Experts attributed Bitget’s and MEXC’s departures to increased regulatory and sanctions risks. Nikita Zuborev, senior analyst at Bestchange.ru, said other international exchanges could follow, although no signs indicate coordinated action.
RBC did not specify when HTX’s restrictions took effect. The exchange’s agreement states that restricted jurisdictions may change based on its policies and services in each market. It directs users to check the latest information on its platform or within the agreement.
HTX Adds Russia to Restricted Jurisdictions After Bitget and MEXC
HTX has added Russia to its restricted jurisdictions, potentially limiting account access and withdrawals for affected individuals and businesses.
Bitget and MEXC also restricted Russian market access in October, citing prohibited jurisdictions and regulatory compliance concerns.
Analysts point to rising regulatory and sanctions risks, though there is no evidence of coordinated action among the exchanges.
HTX has added Russia to its restricted jurisdictions, allowing the cryptocurrency exchange to limit services for Russian users. According to Russian business outlet RBC, the restrictions cover individuals residing in or located in Russia, alongside companies registered or primarily operating there. The move follows similar decisions by Bitget and MEXC in October, although HTX’s effective date remains unspecified.
https://twitter.com/WuBlockchain/status/2113804669357310017?s=20
HTX Agreement Allows Account Closures and Withdrawal Suspensions
According to HTX’s user agreement, the exchange may restrict access, suspend withdrawals, or close accounts belonging to affected users. The agreement also allows HTX to change its restricted jurisdictions list without notifying customers individually.
The list includes the United States, the United Kingdom, the European Union, Singapore, Hong Kong, Iran, Syria, and other countries and territories. These restrictions apply to both individuals and businesses meeting the agreement’s location or registration criteria.
HTX maintains separate restrictions on derivatives trading, which involves financial instruments linked to asset price movements. Those limits cover users from Taiwan, Israel, Iraq, Bangladesh, Bolivia, Ecuador, Kyrgyzstan, and New Zealand.
Founded in 2013 as Huobi, the exchange adopted the HTX name in 2023. Its services include spot cryptocurrency trading, futures, other derivatives, blockchain-related services, investments, and cryptocurrency storage.
Bitget and MEXC Also Restrict Russian Market Access
HTX’s decision follows restrictions announced by Bitget and MEXC earlier in October. Bitget added Russia, Belarus, and Kazakhstan to its prohibited jurisdictions list and advised affected clients to withdraw their funds by October 21.
MEXC announced its withdrawal from the Russian and Belarusian markets on October 20. The exchange cited improvements to its regulatory compliance system as the reason for its decision.
Analysts Point to Regulatory and Sanctions Risks
Experts attributed Bitget’s and MEXC’s departures to increased regulatory and sanctions risks. Nikita Zuborev, senior analyst at Bestchange.ru, said other international exchanges could follow, although no signs indicate coordinated action.
RBC did not specify when HTX’s restrictions took effect. The exchange’s agreement states that restricted jurisdictions may change based on its policies and services in each market. It directs users to check the latest information on its platform or within the agreement.
74
Məqalə
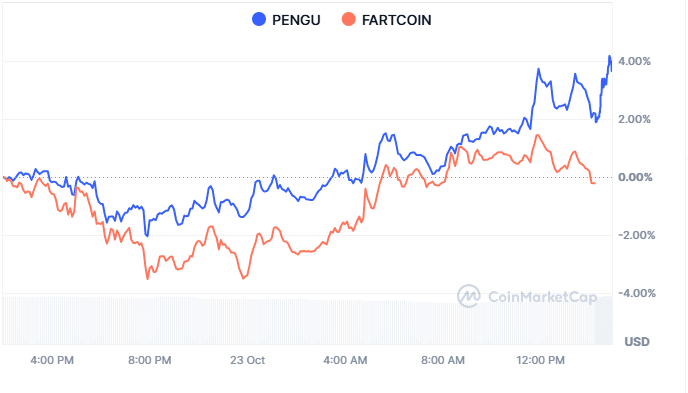
PENGU Qrafiki Mümkün Dönüş Əlamətləri GöstərirPENGU $0.0067–$0.0070 aralığı yaxınlığında iki dəfə sıçrayıb. Bu, aylarla davam edən eniş təzyiqindən sonra qiymətin dib formalaşdırması ehtimalını artırır.
Son sessiyada PENGU gecə ərzindəki itkilərdən daha yaxşı toparlanaraq FARTCOIN ilə müqayisədə gündəlik göstəricilərini yaxşılaşdırıb.
Yaxın müqavimət səviyyəsinin üzərində davamlı hərəkət dönüş ehtimalını gücləndirə bilər, dəstək səviyyəsinin altında satışların yenidən artması isə hazırkı mənzərəni zəiflədər.
PENGU, aylarla davam edən satışlardan sonra mümkün dönüş əlamətləri göstərir: dəstək səviyyəsindən dəfələrlə sıçrayıb və qısamüddətli göstəriciləri yaxşılaşıb.
PENGU Qrafiki Mümkün Dönüş Əlamətləri Göstərir
PENGU $0.0067–$0.0070 aralığı yaxınlığında iki dəfə sıçrayıb. Bu, aylarla davam edən eniş təzyiqindən sonra qiymətin dib formalaşdırması ehtimalını artırır.
Son sessiyada PENGU gecə ərzindəki itkilərdən daha yaxşı toparlanaraq FARTCOIN ilə müqayisədə gündəlik göstəricilərini yaxşılaşdırıb.
Yaxın müqavimət səviyyəsinin üzərində davamlı hərəkət dönüş ehtimalını gücləndirə bilər, dəstək səviyyəsinin altında satışların yenidən artması isə hazırkı mənzərəni zəiflədər.
PENGU, aylarla davam edən satışlardan sonra mümkün dönüş əlamətləri göstərir: dəstək səviyyəsindən dəfələrlə sıçrayıb və qısamüddətli göstəriciləri yaxşılaşıb.
469
Məqalə
Tərcüməyə bax
Ethereum Faces $2,300 Test as Glamsterdam Nears TestnetETH trades near $2,335 with RSI at 38.93 and a negative MACD histogram, while support is around 2,300–2,330.
Michael van de Poppe identifies $2,320 and $2,230 as potential long-entry levels if Ethereum faces further downside.
Crypto Patel highlights $0.004 gas fees as Glamsterdam approaches a Hoodi testnet milestone, with security and compatibility still under review.
Ethereum trades near $2,335 as bearish momentum pushes ETH toward $2,300 support, while analysts watch potential entry levels and network developments. Michael van de Poppe identified $2,320 and $2,230 as possible long positions during market weakness. Meanwhile, Crypto Patel highlighted $0.004 gas fees, while developers approach a Glamsterdam testnet milestone.
ETH Tests Support as Technical Indicators Remain Bearish
The four-hour ETH/USD chart on Binance shows Ethereum down 0.45% on the latest candle, trading at $2,335.30. The candle opened at $2,332.06, reached $2,335.30, and recorded a low of $2,332.05.
Source: TradingView
Ethereum traded between $2,650 and $2,750 during late September and early October, briefly approaching $2,780. However, a breakdown around October 7 pushed ETH below $2,600 and toward $2,430. A rebound near October 12 lifted the price toward $2,550, but the recovery failed to hold.
Further selling in mid-October drove ETH toward $2,350. Another rebound reached approximately $2,500 around October 21 before sellers pushed prices lower again. The Relative Strength Index is at 38.93, below its signal average of 40.47.
Meanwhile, the MACD line is at -22.04, below the -18.52 signal line, with a negative histogram of -3.52. Immediate support sits between $2,300 and $2,330, while resistance appears around 2,400–2,430. A further decline could expose $2,250.
Van de Poppe Identifies Two Potential ETH Entry Levels
As Bitcoin falls and market fear increases, Michael van de Poppe highlighted two Ethereum price levels. He described prices below $2,320 as an interesting area for long positions.
He also identified approximately $2,230 as another potential entry if markets experience a deeper price wick. These levels place his analysis below Ethereum’s current price of $2,335.30.
Crypto Patel Highlights Low Fees as Glamsterdam Nears
Crypto Patel reported Ethereum gas fees had fallen to $0.004, raising questions about the network’s transaction costs compared with Solana. The analyst pointed to low fees and expanding Layer-2 adoption while questioning whether Ethereum could maintain those costs during periods of rising demand.
https://twitter.com/CryptoPatel/status/2114016567268929924?s=20
Separately, Glamsterdam is approaching a Hoodi testnet milestone. The upgrade discussion focuses on the changes developers are testing, potential security or compatibility risks, and whether the changes deliver their intended improvements.
Ethereum Faces $2,300 Test as Glamsterdam Nears Testnet
ETH trades near $2,335 with RSI at 38.93 and a negative MACD histogram, while support is around 2,300–2,330.
Michael van de Poppe identifies $2,320 and $2,230 as potential long-entry levels if Ethereum faces further downside.
Crypto Patel highlights $0.004 gas fees as Glamsterdam approaches a Hoodi testnet milestone, with security and compatibility still under review.
Ethereum trades near $2,335 as bearish momentum pushes ETH toward $2,300 support, while analysts watch potential entry levels and network developments. Michael van de Poppe identified $2,320 and $2,230 as possible long positions during market weakness. Meanwhile, Crypto Patel highlighted $0.004 gas fees, while developers approach a Glamsterdam testnet milestone.
ETH Tests Support as Technical Indicators Remain Bearish
The four-hour ETH/USD chart on Binance shows Ethereum down 0.45% on the latest candle, trading at $2,335.30. The candle opened at $2,332.06, reached $2,335.30, and recorded a low of $2,332.05.
Source: TradingView
Ethereum traded between $2,650 and $2,750 during late September and early October, briefly approaching $2,780. However, a breakdown around October 7 pushed ETH below $2,600 and toward $2,430. A rebound near October 12 lifted the price toward $2,550, but the recovery failed to hold.
Further selling in mid-October drove ETH toward $2,350. Another rebound reached approximately $2,500 around October 21 before sellers pushed prices lower again. The Relative Strength Index is at 38.93, below its signal average of 40.47.
Meanwhile, the MACD line is at -22.04, below the -18.52 signal line, with a negative histogram of -3.52. Immediate support sits between $2,300 and $2,330, while resistance appears around 2,400–2,430. A further decline could expose $2,250.
Van de Poppe Identifies Two Potential ETH Entry Levels
As Bitcoin falls and market fear increases, Michael van de Poppe highlighted two Ethereum price levels. He described prices below $2,320 as an interesting area for long positions.
He also identified approximately $2,230 as another potential entry if markets experience a deeper price wick. These levels place his analysis below Ethereum’s current price of $2,335.30.
Crypto Patel Highlights Low Fees as Glamsterdam Nears
Crypto Patel reported Ethereum gas fees had fallen to $0.004, raising questions about the network’s transaction costs compared with Solana. The analyst pointed to low fees and expanding Layer-2 adoption while questioning whether Ethereum could maintain those costs during periods of rising demand.
https://twitter.com/CryptoPatel/status/2114016567268929924?s=20
Separately, Glamsterdam is approaching a Hoodi testnet milestone. The upgrade discussion focuses on the changes developers are testing, potential security or compatibility risks, and whether the changes deliver their intended improvements.
165
Məqalə
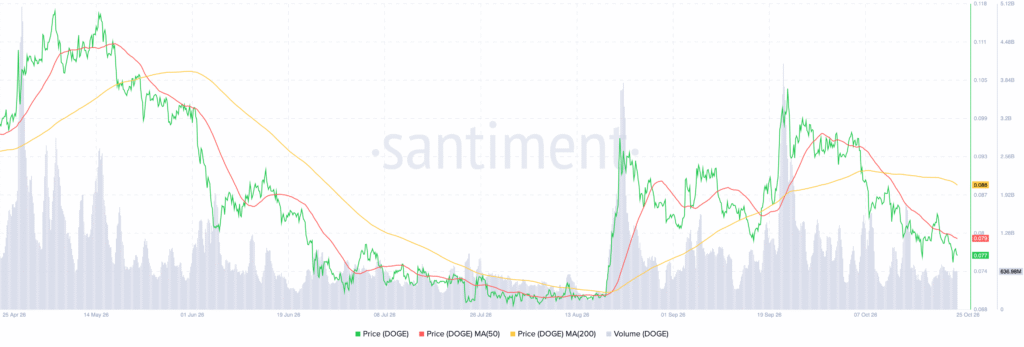
Analitiklər qırılma modellərini və əsas müqavimət səviyyələrini izləyərkən Dogecoin 0,70 dollara doğru irəliləyirDOGE 0,077 dollar ətrafında ticarət olunur və 50 günlük, eləcə də 200 günlük hərəkətli ortalamalardan aşağıdır. Yaxın dəstək səviyyəsi 0,075–0,077 dollar aralığındadır.
Giannis Andreou, DOGE 0,07–0,08 səviyyəsini qoruyub ardıcıl müqavimət səviyyələrini qırarsa, 0,70 dollara doğru potensial yolun mümkün olduğunu düşünür.
Trader Tardigrade Dogecoin-in aylıq qrafikini 2015–2017-ci illərdəki strukturu ilə müqayisə edərək, mümkün qırılmaya işarə edir, lakin konkret tarix müəyyənləşdirmir.
Oktyabr itkiləri avqust və sentyabr aylarında əldə edilən bərpanın böyük hissəsini silib apardıqdan sonra Dogecoin 0,077 dollar ətrafında ticarət olunur. Analitiklər isə uzunmüddətli perspektivdə mümkün qırılma modellərini izləyirlər. Giannis Andreou, DOGE bir neçə müqavimət səviyyəsini keçərsə, 0,70 dollara doğru potensial yolun mümkün olduğunu bildirdi. Bu arada Trader Tardigrade Dogecoin-in aylıq strukturunu 2015–2017-ci illərdəki qiymət modeli ilə müqayisə etdi.
Analitiklər qırılma modellərini və əsas müqavimət səviyyələrini izləyərkən Dogecoin 0,70 dollara doğru irəliləyir
DOGE 0,077 dollar ətrafında ticarət olunur və 50 günlük, eləcə də 200 günlük hərəkətli ortalamalardan aşağıdır. Yaxın dəstək səviyyəsi 0,075–0,077 dollar aralığındadır.
Giannis Andreou, DOGE 0,07–0,08 səviyyəsini qoruyub ardıcıl müqavimət səviyyələrini qırarsa, 0,70 dollara doğru potensial yolun mümkün olduğunu düşünür.
Trader Tardigrade Dogecoin-in aylıq qrafikini 2015–2017-ci illərdəki strukturu ilə müqayisə edərək, mümkün qırılmaya işarə edir, lakin konkret tarix müəyyənləşdirmir.
Oktyabr itkiləri avqust və sentyabr aylarında əldə edilən bərpanın böyük hissəsini silib apardıqdan sonra Dogecoin 0,077 dollar ətrafında ticarət olunur. Analitiklər isə uzunmüddətli perspektivdə mümkün qırılma modellərini izləyirlər. Giannis Andreou, DOGE bir neçə müqavimət səviyyəsini keçərsə, 0,70 dollara doğru potensial yolun mümkün olduğunu bildirdi. Bu arada Trader Tardigrade Dogecoin-in aylıq strukturunu 2015–2017-ci illərdəki qiymət modeli ilə müqayisə etdi.
2
433
Məqalə
BTC 80 min dollarlıq dəstək səviyyəsini sınaqdan keçirərkən uzunmüddətli Bitcoin investorları satış edirUzunmüddətli investorların sahib olduğu Bitcoin miqdarı avqust ayından bəri 300,000 BTC azalıb, 30 günlük orta dəyişiklik isə mənfi 195,000 BTC-yə çatıb.
RSI 50-dən aşağı qaldığı və MACD mənfi olduğu üçün zəif impulsu və davam edən satış təzyiqini əks etdirən BTC 80,535 dollar ətrafında ticarət olunur.
Bitcoin 80,000 və 79,000 dollar səviyyələrində dəstəklə üzləşir, 82,000 dolları yenidən aşması isə 83,000–84,000 dollara doğru bərpanın yolunu aça bilər.
Uzunmüddətli investorlar sahib olduqları BTC-ləri azaltdıqca Bitcoin 80,000 dollara yaxınlaşır və bununla da onsuz da zəifləyən bazara satış təzyiqi artır. Analitik Darkfost-un məlumatına görə, uzunmüddətli investorların sahib olduğu BTC miqdarı avqust ayından bəri 300,000 BTC azalıb, 30 günlük orta dəyişiklik isə mənfi 195,000 BTC təşkil edir. Bu arada, Bitcoin-in dörd saatlıq qrafiki təkrar müqavimət səviyyəsindən geri dönüşləri və zəif impulsu göstərir.
BTC 80 min dollarlıq dəstək səviyyəsini sınaqdan keçirərkən uzunmüddətli Bitcoin investorları satış edir
Uzunmüddətli investorların sahib olduğu Bitcoin miqdarı avqust ayından bəri 300,000 BTC azalıb, 30 günlük orta dəyişiklik isə mənfi 195,000 BTC-yə çatıb.
RSI 50-dən aşağı qaldığı və MACD mənfi olduğu üçün zəif impulsu və davam edən satış təzyiqini əks etdirən BTC 80,535 dollar ətrafında ticarət olunur.
Bitcoin 80,000 və 79,000 dollar səviyyələrində dəstəklə üzləşir, 82,000 dolları yenidən aşması isə 83,000–84,000 dollara doğru bərpanın yolunu aça bilər.
Uzunmüddətli investorlar sahib olduqları BTC-ləri azaltdıqca Bitcoin 80,000 dollara yaxınlaşır və bununla da onsuz da zəifləyən bazara satış təzyiqi artır. Analitik Darkfost-un məlumatına görə, uzunmüddətli investorların sahib olduğu BTC miqdarı avqust ayından bəri 300,000 BTC azalıb, 30 günlük orta dəyişiklik isə mənfi 195,000 BTC təşkil edir. Bu arada, Bitcoin-in dörd saatlıq qrafiki təkrar müqavimət səviyyəsindən geri dönüşləri və zəif impulsu göstərir.
580
Məqalə
Tərcüməyə bax
Cardano Risks 20% Drop as ADA Breaks Key Support, Says AnalystAnalyst warns ADA could fall 20% toward $0.166 if $0.220 resistance holds following a breakdown below its rising price channel.
Cardano’s RSI sits at 34.77 and MACD remains negative, signaling continued selling pressure as ADA trades near $0.2056.
Germany’s DZ BANK includes Cardano alongside Bitcoin, Ethereum and Litecoin on meinKrypto, subject to participating banks’ adoption decisions.
Cardano faces a potential 20% decline toward $0.166 after analyst Ali Charts reported a breakdown below its rising price channel. ADA also continues to trade near $0.20, with bearish momentum appearing across its four-hour chart. Meanwhile, Germany’s DZ BANK has included Cardano among four cryptocurrencies available through its meinKrypto platform.
Ali Charts Identifies $0.220 as Resistance
Ali Charts said ADA traded inside a rising parallel channel from late June, climbing from $0.138 to $0.282. However, the token has now fallen below the channel’s lower boundary, raising the possibility of a deeper correction.
The analyst identified $0.220 as the level that could limit recovery attempts. If that price continues to act as resistance, ADA could decline approximately 20% toward $0.166.
Recent price action supports the reported weakness. ADA previously traded around 0.24–0.26 before reaching approximately $0.28 around October 6. It then fell below $0.25, $0.24 and $0.23, forming lower highs and lower lows.
A recovery toward $0.23 around October 21 failed, and renewed selling pushed the price toward $0.20. The latest four-hour candle closed at $0.2056, down 1.15%, with volume reaching 4.44 million ADA.
RSI and MACD Show Continued Selling Pressure
ADA’s Relative Strength Index is at 34.77, below its moving average of 37.40. The reading places momentum near the oversold threshold of 30, although it has not crossed that level.
Source: TradingView
The MACD line is at -0.0038, below its -0.0033 signal line. Its histogram reads -0.0005, indicating continued downside momentum. Immediate support lies between $0.2040 and $0.2000, while resistance stands around 0.22–0.23. A recovery above $0.21 could provide initial relief.
DZ BANK Adds Cardano to Its Crypto Offering
Separately, DZ BANK’s meinKrypto platform selected ADA alongside Bitcoin, Ethereum and Litecoin for its initial offering. The MiCA-authorized service integrates cryptocurrency trading and custody into the VR Banking App.
https://twitter.com/gandreou007/status/2113963717742203371?s=20
Participating cooperative banks can offer the service through existing banking infrastructure. However, each bank must decide whether to adopt it and complete the required regulatory notification.
Cardano Risks 20% Drop as ADA Breaks Key Support, Says Analyst
Analyst warns ADA could fall 20% toward $0.166 if $0.220 resistance holds following a breakdown below its rising price channel.
Cardano’s RSI sits at 34.77 and MACD remains negative, signaling continued selling pressure as ADA trades near $0.2056.
Germany’s DZ BANK includes Cardano alongside Bitcoin, Ethereum and Litecoin on meinKrypto, subject to participating banks’ adoption decisions.
Cardano faces a potential 20% decline toward $0.166 after analyst Ali Charts reported a breakdown below its rising price channel. ADA also continues to trade near $0.20, with bearish momentum appearing across its four-hour chart. Meanwhile, Germany’s DZ BANK has included Cardano among four cryptocurrencies available through its meinKrypto platform.
Ali Charts Identifies $0.220 as Resistance
Ali Charts said ADA traded inside a rising parallel channel from late June, climbing from $0.138 to $0.282. However, the token has now fallen below the channel’s lower boundary, raising the possibility of a deeper correction.
The analyst identified $0.220 as the level that could limit recovery attempts. If that price continues to act as resistance, ADA could decline approximately 20% toward $0.166.
Recent price action supports the reported weakness. ADA previously traded around 0.24–0.26 before reaching approximately $0.28 around October 6. It then fell below $0.25, $0.24 and $0.23, forming lower highs and lower lows.
A recovery toward $0.23 around October 21 failed, and renewed selling pushed the price toward $0.20. The latest four-hour candle closed at $0.2056, down 1.15%, with volume reaching 4.44 million ADA.
RSI and MACD Show Continued Selling Pressure
ADA’s Relative Strength Index is at 34.77, below its moving average of 37.40. The reading places momentum near the oversold threshold of 30, although it has not crossed that level.
Source: TradingView
The MACD line is at -0.0038, below its -0.0033 signal line. Its histogram reads -0.0005, indicating continued downside momentum. Immediate support lies between $0.2040 and $0.2000, while resistance stands around 0.22–0.23. A recovery above $0.21 could provide initial relief.
DZ BANK Adds Cardano to Its Crypto Offering
Separately, DZ BANK’s meinKrypto platform selected ADA alongside Bitcoin, Ethereum and Litecoin for its initial offering. The MiCA-authorized service integrates cryptocurrency trading and custody into the VR Banking App.
https://twitter.com/gandreou007/status/2113963717742203371?s=20
Participating cooperative banks can offer the service through existing banking infrastructure. However, each bank must decide whether to adopt it and complete the required regulatory notification.
2
362
Məqalə
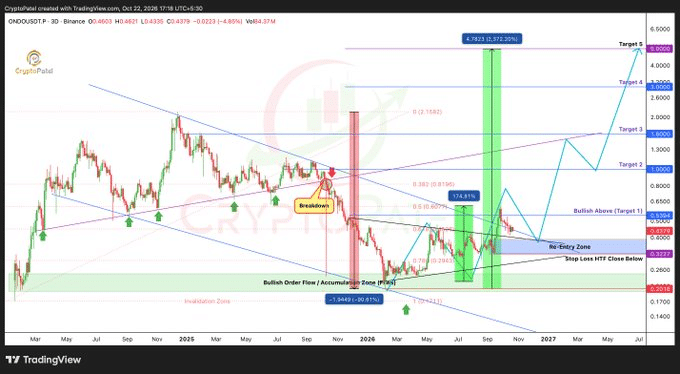
Bərpa zəiflədikcə ONDO müqavimətlə üzləşirONDO dəyər itirdikdən sonra 0,433 dollar ətrafında ticarət olunur. Bərpa gözləyən alıcılar üçün 0,435 dollar səviyyəsi qısamüddətli maneə rolunu oynayır.
Son rallilər zamanı birjalara kəskin vəsait axını və birjalardan kəskin vəsait çıxışı müşahidə olunub. Qiymət zirvəsindən geri çəkildikcə ONDO-nun bazar istiqaməti qeyri-müəyyən qalır.
0,39–0,33 dollar aralığındakı yenidən giriş zonası əhəmiyyətini qoruyur, daha yüksək zaman intervalında 0,32 dolların altında bağlanış isə qeyd olunan ssenarini etibarsız edər.
ONDO-nun qiymət hərəkəti ayı xarakterli olaraq qalır: qiymət zirvədən geri dönüb və orada möhkəmlənə bilməyib. Treyderlər yaxınlıqdakı dəstək və müqavimət səviyyələrinə uyğun mövqe tuturlar.
Bərpa zəiflədikcə ONDO müqavimətlə üzləşir
ONDO dəyər itirdikdən sonra 0,433 dollar ətrafında ticarət olunur. Bərpa gözləyən alıcılar üçün 0,435 dollar səviyyəsi qısamüddətli maneə rolunu oynayır.
Son rallilər zamanı birjalara kəskin vəsait axını və birjalardan kəskin vəsait çıxışı müşahidə olunub. Qiymət zirvəsindən geri çəkildikcə ONDO-nun bazar istiqaməti qeyri-müəyyən qalır.
0,39–0,33 dollar aralığındakı yenidən giriş zonası əhəmiyyətini qoruyur, daha yüksək zaman intervalında 0,32 dolların altında bağlanış isə qeyd olunan ssenarini etibarsız edər.
ONDO-nun qiymət hərəkəti ayı xarakterli olaraq qalır: qiymət zirvədən geri dönüb və orada möhkəmlənə bilməyib. Treyderlər yaxınlıqdakı dəstək və müqavimət səviyyələrinə uyğun mövqe tuturlar.
400
Doğrulanıb
Məqalə
Tərcüməyə bax
Arf and Ripple Bring RLUSD Settlement Liquidity to XRPLArf and Ripple plan to use RLUSD on XRPL to provide short-term settlement liquidity for licensed cross-border payment companies.
Arf reports approximately $10 billion in annual settlement volume, with liquidity typically repaid within one to five days.
Future integration with XRPL’s native Lending Protocol depends on approval of amendments XLS-65 and XLS-66 before mainnet activation.
Arf and Ripple are partnering to provide RLUSD-powered settlement liquidity to licensed cross-border payment companies on the XRP Ledger (XRPL). The arrangement will provide short-term working capital while international payments settle, addressing funding needs across markets. Arf reports about $10 billion in annual settlement volume, with capital turning over four times monthly.
https://twitter.com/Ripple/status/2113260588574843090?s=20
Arf Uses RLUSD to Support Payment Settlement
Payment companies often need working capital available across multiple markets to pre-fund transfers while awaiting settlement. However, traditional bank credit lines can take months to establish and typically require substantial collateral.
Arf and Ripple plan to use RLUSD, Ripple’s dollar-backed stablecoin, to provide short-duration liquidity on XRPL. According to Arf co-founder and CEO Ali Erhat Nalbant, the company’s model helps payment firms access capital while funds remain in transit.
Arf launched in November 2022 and has since reached approximately $10 billion in annual global settlement volume. The Zug, Switzerland-based company is a regulated financial institution and member of VQF. Its settlement liquidity typically repays within one to five days, allowing capital to support repeated payment flows.
XRPL Lending Protocol Could Expand the Arrangement
In the partnership’s first phase, Arf will provide direct RLUSD settlement liquidity on XRPL. However, the companies also plan to use the ledger’s native lending infrastructure when it becomes available.
The proposed system includes Single Asset Vaults for pooling and managing capital onchain. The Lending Protocol would allow that capital to support structured loans. Arf would continue handling underwriting and working capital decisions offchain.
Arf has already developed an implementation using the proposed protocol. However, the relevant amendments, XLS-65 and XLS-66, must pass XRPL’s amendment process before activation on mainnet.
RLUSD and XRP Have Different Roles
RippleX Head of Product Jasmine Cooper said XRPL offers settlement infrastructure, while RLUSD provides a dollar-denominated asset for working capital. RLUSD would support loan disbursements and repayments.
Meanwhile, XRP pays network transaction fees, and accounts and certain ledger objects require XRP reserves. Payment companies would not need to operate directly onchain. Arf supports treasury management between fiat currencies and stablecoins through bank accounts in major financial hubs.
Arf will continue advising on the Single Asset Vault and Lending Protocol specifications before any planned transition to the native infrastructure.
Arf and Ripple Bring RLUSD Settlement Liquidity to XRPL
Arf and Ripple plan to use RLUSD on XRPL to provide short-term settlement liquidity for licensed cross-border payment companies.
Arf reports approximately $10 billion in annual settlement volume, with liquidity typically repaid within one to five days.
Future integration with XRPL’s native Lending Protocol depends on approval of amendments XLS-65 and XLS-66 before mainnet activation.
Arf and Ripple are partnering to provide RLUSD-powered settlement liquidity to licensed cross-border payment companies on the XRP Ledger (XRPL). The arrangement will provide short-term working capital while international payments settle, addressing funding needs across markets. Arf reports about $10 billion in annual settlement volume, with capital turning over four times monthly.
https://twitter.com/Ripple/status/2113260588574843090?s=20
Arf Uses RLUSD to Support Payment Settlement
Payment companies often need working capital available across multiple markets to pre-fund transfers while awaiting settlement. However, traditional bank credit lines can take months to establish and typically require substantial collateral.
Arf and Ripple plan to use RLUSD, Ripple’s dollar-backed stablecoin, to provide short-duration liquidity on XRPL. According to Arf co-founder and CEO Ali Erhat Nalbant, the company’s model helps payment firms access capital while funds remain in transit.
Arf launched in November 2022 and has since reached approximately $10 billion in annual global settlement volume. The Zug, Switzerland-based company is a regulated financial institution and member of VQF. Its settlement liquidity typically repays within one to five days, allowing capital to support repeated payment flows.
XRPL Lending Protocol Could Expand the Arrangement
In the partnership’s first phase, Arf will provide direct RLUSD settlement liquidity on XRPL. However, the companies also plan to use the ledger’s native lending infrastructure when it becomes available.
The proposed system includes Single Asset Vaults for pooling and managing capital onchain. The Lending Protocol would allow that capital to support structured loans. Arf would continue handling underwriting and working capital decisions offchain.
Arf has already developed an implementation using the proposed protocol. However, the relevant amendments, XLS-65 and XLS-66, must pass XRPL’s amendment process before activation on mainnet.
RLUSD and XRP Have Different Roles
RippleX Head of Product Jasmine Cooper said XRPL offers settlement infrastructure, while RLUSD provides a dollar-denominated asset for working capital. RLUSD would support loan disbursements and repayments.
Meanwhile, XRP pays network transaction fees, and accounts and certain ledger objects require XRP reserves. Payment companies would not need to operate directly onchain. Arf supports treasury management between fiat currencies and stablecoins through bank accounts in major financial hubs.
Arf will continue advising on the Single Asset Vault and Lending Protocol specifications before any planned transition to the native infrastructure.
110
Qismən doğrudur

Məqalə
TVL 244 milyon dollara çatarkən NEAR ICP təsisçisinin məxfilik tənqidi ilə üzləşirHesabata görə, NEAR-da kilidlənmiş ümumi dəyər 244 milyon dollar, ICP-də isə 12 milyon dollardır; bunun 171 milyon dolları Confidential Intents-in payına düşür.
ICP-nin təsisçisi Dom NEAR-ın məxfilik modelini tənqid edib və vetKeys ilə bağlı narahatlıqlarını dilə gətirib, lakin bu iddialar mübahisəlidir.
Oktyabr rallilərini davam etdirə bilməyən NEAR dəstək səviyyəsinə doğru geri çəkildi; 29%–30% dəstək, 45%–50% isə müqavimət səviyyəsi olaraq qalır.
NEAR blokçeynində kilidlənmiş ümumi dəyər 244 milyon dollar, ICP-də isə 12 milyon dollardır; məxfilik texnologiyası ilə bağlı müzakirələr də getdikcə intensivləşir. Our Crypto Talk bu fərqi ICP-nin təsisçisi Domun tənqidləri ilə yanaşı vurğulayıb. Dom NEAR-ın Confidential Intents həllini tənqid edib və vetKeys ilə bağlı narahatlıqlarını dilə gətirib. Bu arada, NEAR-ın qrafiki oktyabr zirvələrindən sonra baş verən korreksiyanın ardınca impulsun zəiflədiyini göstərir.
TVL 244 milyon dollara çatarkən NEAR ICP təsisçisinin məxfilik tənqidi ilə üzləşir
Hesabata görə, NEAR-da kilidlənmiş ümumi dəyər 244 milyon dollar, ICP-də isə 12 milyon dollardır; bunun 171 milyon dolları Confidential Intents-in payına düşür.
ICP-nin təsisçisi Dom NEAR-ın məxfilik modelini tənqid edib və vetKeys ilə bağlı narahatlıqlarını dilə gətirib, lakin bu iddialar mübahisəlidir.
Oktyabr rallilərini davam etdirə bilməyən NEAR dəstək səviyyəsinə doğru geri çəkildi; 29%–30% dəstək, 45%–50% isə müqavimət səviyyəsi olaraq qalır.
NEAR blokçeynində kilidlənmiş ümumi dəyər 244 milyon dollar, ICP-də isə 12 milyon dollardır; məxfilik texnologiyası ilə bağlı müzakirələr də getdikcə intensivləşir. Our Crypto Talk bu fərqi ICP-nin təsisçisi Domun tənqidləri ilə yanaşı vurğulayıb. Dom NEAR-ın Confidential Intents həllini tənqid edib və vetKeys ilə bağlı narahatlıqlarını dilə gətirib. Bu arada, NEAR-ın qrafiki oktyabr zirvələrindən sonra baş verən korreksiyanın ardınca impulsun zəiflədiyini göstərir.
1
897
Məqalə
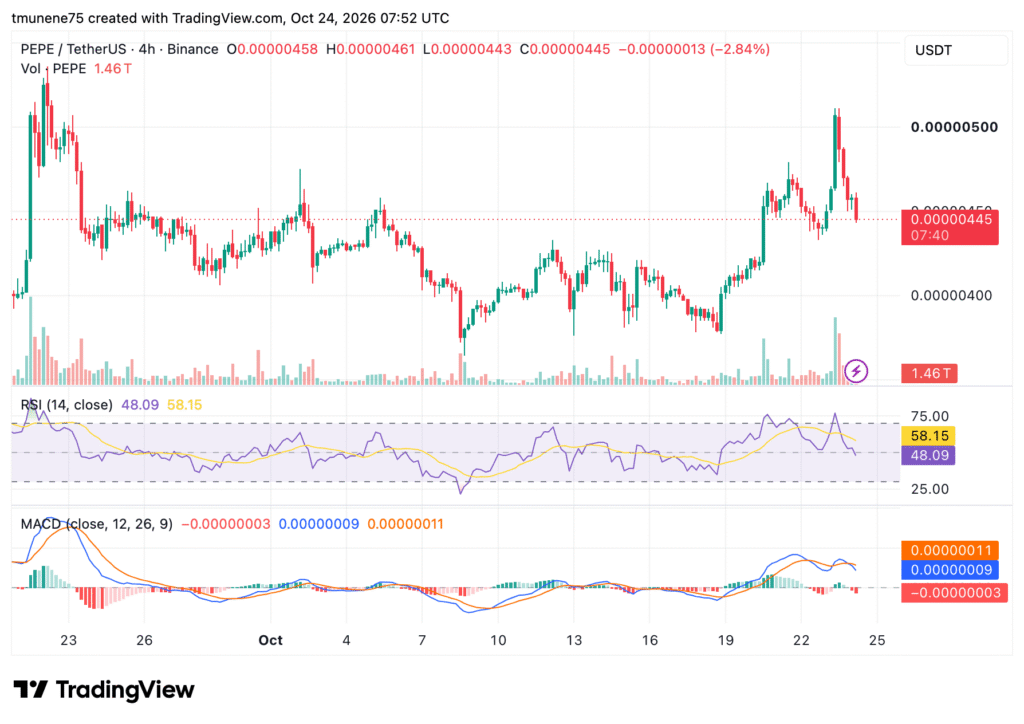
Birjalardakı axınlar dəyişdikcə PEPE-nin yüksəlişi $0.00000440 sınağı ilə üzləşirPEPE oktyabrın 17–22-si arasında təxminən 13% bahalaşdı, lakin birjalar 2.11 trilyon tokeni geri əldə edərək oktyabrın 16-da çıxarılan tokenlərin 40%-dən çoxunu geri qaytardı.
RSI 48.09-a düşüb MACD mənfi zonaya keçdikcə PEPE $0.00000510-dan $0.00000445-a gerilədi və bu, impulsun zəiflədiyini göstərdi.
Analitik Giannis Andreou $0.00000500 səviyyəsini qırılma nöqtəsi hesab edir; müqavimət qırılarsa və təkrar sınaq zamanı bu səviyyədən yuxarı qalarsa, qiymət $0.00000727-yə çata bilər.
PEPE oktyabrın 17-dən 22-dək təxminən 13% bahalaşdı, lakin birjalara yenidən token axını və texniki impulsun zəifləməsi indi bu yüksəlişi təhdid edir. Santiment Intelligence-ın məlumatına görə, birjalar oktyabrın 16-da çıxarılan 4.77 trilyon tokenin 40%-dən çoxunu geri əldə edib. Bu arada, analitik Giannis Andreou simmetrik üçbucaq formalaşmasını müəyyən edib; PEPE isə $0.00000510-dan yaxınlıqdakı dəstək səviyyəsinə doğru geriləyib.
Birjalardakı axınlar dəyişdikcə PEPE-nin yüksəlişi $0.00000440 sınağı ilə üzləşir
PEPE oktyabrın 17–22-si arasında təxminən 13% bahalaşdı, lakin birjalar 2.11 trilyon tokeni geri əldə edərək oktyabrın 16-da çıxarılan tokenlərin 40%-dən çoxunu geri qaytardı.
RSI 48.09-a düşüb MACD mənfi zonaya keçdikcə PEPE $0.00000510-dan $0.00000445-a gerilədi və bu, impulsun zəiflədiyini göstərdi.
Analitik Giannis Andreou $0.00000500 səviyyəsini qırılma nöqtəsi hesab edir; müqavimət qırılarsa və təkrar sınaq zamanı bu səviyyədən yuxarı qalarsa, qiymət $0.00000727-yə çata bilər.
PEPE oktyabrın 17-dən 22-dək təxminən 13% bahalaşdı, lakin birjalara yenidən token axını və texniki impulsun zəifləməsi indi bu yüksəlişi təhdid edir. Santiment Intelligence-ın məlumatına görə, birjalar oktyabrın 16-da çıxarılan 4.77 trilyon tokenin 40%-dən çoxunu geri əldə edib. Bu arada, analitik Giannis Andreou simmetrik üçbucaq formalaşmasını müəyyən edib; PEPE isə $0.00000510-dan yaxınlıqdakı dəstək səviyyəsinə doğru geriləyib.
294

Məqalə
Tərcüməyə bax
Uniswap Wallet Growth Hits Four-Year High as UNI Eyes $40Uniswap added 2,295 new UNI wallets in one day, its highest network growth since November 2022, according to Santiment.
Aggregator Hooks connect seven external liquidity sources across Ethereum, Base and Robinhood Chain, covering over 90% of DEX activity on those networks.
Analyst Giannis Andreou sees $40 as a potential UNI target if resistance levels from 6.50–7.20 through 25–30 are reclaimed.
Uniswap recorded 2,295 new UNI wallets in one day, its highest network growth since November 2022, according to Santiment Intelligence. The increase comes as Uniswap launches Aggregator Hooks across Ethereum mainnet, Base, and Robinhood Chain. Meanwhile, analyst Giannis Andreou outlined resistance levels that UNI must overcome for a potential recovery toward $40.
New Wallets Rise as Uniswap Expands Liquidity Routing
Santiment said network growth measures new addresses interacting with UNI for the first time. It identified $7 as the key downside level and $7.50 as the first meaningful recovery level to watch.
According to Santiment, holding $7 while wallet creation remains above its recent baseline could support another test of $8. However, losing $7 alongside declining wallet creation would suggest the increase reflected short-term activity rather than sustained adoption.
Uniswap also introduced Aggregator Hooks, which connect external liquidity sources to its v4 pools. The feature is available through the Uniswap Web App and API on Ethereum mainnet, Base, and Robinhood Chain.
Seven external sources were available at launch, covering more than 90% of decentralized exchange activity across those chains. Uniswap said its protocol has processed more than $4.5 trillion in swaps.
Aggregator Hooks Bring External Sources Into Uniswap v4
Each Aggregator Hook wraps an external liquidity source as a Uniswap v4 pool. Routers retrieve updated quotes every block, then select routes across Uniswap pools and connected external sources.
https://twitter.com/Uniswap/status/2113365305934131475?s=20
The resulting swap settles in one transaction without requiring additional approvals. External sources routed through Aggregator Hooks also pay protocol fees, which contribute to UNI burning.
Users can access the routing through the Uniswap Web App, while developers can integrate it through the API. The feature currently supports Ethereum mainnet, Base, and Robinhood Chain.
Analyst Maps UNI’s Potential Path Toward $40
Separately, Giannis Andreou said UNI has moved above a trendline connecting its 2021 and 2024 highs. He identified 6.50–7.20 as the range needed to maintain the recovery setup. Reclaiming 8–8.50 would bring 10–12 into focus, followed by 14–16 and 18–20.
https://twitter.com/gandreou007/status/2113337090503245964?s=20
A break above $20 could expose historical supply between $25 and $30, before a potential move toward 37–40. Andreou said the $40 scenario requires those resistance levels to become support. A weekly close below $6.50 followed by a failed reclaim would weaken the setup toward 5–5.50.
Uniswap Wallet Growth Hits Four-Year High as UNI Eyes $40
Uniswap added 2,295 new UNI wallets in one day, its highest network growth since November 2022, according to Santiment.
Aggregator Hooks connect seven external liquidity sources across Ethereum, Base and Robinhood Chain, covering over 90% of DEX activity on those networks.
Analyst Giannis Andreou sees $40 as a potential UNI target if resistance levels from 6.50–7.20 through 25–30 are reclaimed.
Uniswap recorded 2,295 new UNI wallets in one day, its highest network growth since November 2022, according to Santiment Intelligence. The increase comes as Uniswap launches Aggregator Hooks across Ethereum mainnet, Base, and Robinhood Chain. Meanwhile, analyst Giannis Andreou outlined resistance levels that UNI must overcome for a potential recovery toward $40.
New Wallets Rise as Uniswap Expands Liquidity Routing
Santiment said network growth measures new addresses interacting with UNI for the first time. It identified $7 as the key downside level and $7.50 as the first meaningful recovery level to watch.
According to Santiment, holding $7 while wallet creation remains above its recent baseline could support another test of $8. However, losing $7 alongside declining wallet creation would suggest the increase reflected short-term activity rather than sustained adoption.
Uniswap also introduced Aggregator Hooks, which connect external liquidity sources to its v4 pools. The feature is available through the Uniswap Web App and API on Ethereum mainnet, Base, and Robinhood Chain.
Seven external sources were available at launch, covering more than 90% of decentralized exchange activity across those chains. Uniswap said its protocol has processed more than $4.5 trillion in swaps.
Aggregator Hooks Bring External Sources Into Uniswap v4
Each Aggregator Hook wraps an external liquidity source as a Uniswap v4 pool. Routers retrieve updated quotes every block, then select routes across Uniswap pools and connected external sources.
https://twitter.com/Uniswap/status/2113365305934131475?s=20
The resulting swap settles in one transaction without requiring additional approvals. External sources routed through Aggregator Hooks also pay protocol fees, which contribute to UNI burning.
Users can access the routing through the Uniswap Web App, while developers can integrate it through the API. The feature currently supports Ethereum mainnet, Base, and Robinhood Chain.
Analyst Maps UNI’s Potential Path Toward $40
Separately, Giannis Andreou said UNI has moved above a trendline connecting its 2021 and 2024 highs. He identified 6.50–7.20 as the range needed to maintain the recovery setup. Reclaiming 8–8.50 would bring 10–12 into focus, followed by 14–16 and 18–20.
https://twitter.com/gandreou007/status/2113337090503245964?s=20
A break above $20 could expose historical supply between $25 and $30, before a potential move toward 37–40. Andreou said the $40 scenario requires those resistance levels to become support. A weekly close below $6.50 followed by a failed reclaim would weaken the setup toward 5–5.50.
253
Məqalə
Tərcüməyə bax
Bitcoin Moves $21B On-Chain as Analyst Flags $73K SupportBitcoin recorded over $21 billion in spent outputs linked to holdings above $1 million, with more than 230,000 BTC moving on-chain.
Ali Charts reports Bitcoin declines of 27%–72% across four previous U.S. midterm election cycles, though correlation does not prove causation.
Ali Charts identifies $73,000 as a key support level near short-term holders’ cost basis, with seller exhaustion and renewed demand worth watching.
Bitcoin recorded its largest on-chain movement of 2026, with more than $21 billion in spent outputs linked to holdings worth over $1 million, according to analyst Darkfost. Meanwhile, Ali Charts highlighted past Bitcoin declines around U.S. midterm elections, with the November 3 vote approaching. The analysts pointed to separate signals involving transfers, historical returns and potential downside levels.
Darkfost Tracks More Than 230,000 Bitcoin in Transfers
Darkfost reported that more than 230,000 BTC moved through spent unspent transaction outputs, or UTXOs, each worth over $1 million. Most of these outputs were between one and six months old, while another $4.6 billion came from long-term holders whose coins were aged between 12 months and three years.
However, Darkfost said the movement likely involved transfers between addresses because the coins did not appear to reach exchanges. The analyst noted that UTXOs spent and sent to exchanges showed no comparable spike. Depending on whether the transactions realize profits or losses, the movement could produce a rise in either metric.
Ali Charts Highlights Bitcoin’s Midterm Election Pattern
Ali Charts said Bitcoin declined during the four previous U.S. midterm election cycles, recording drops of 72% in 2010, 65% in 2014, 52% in 2018 and 27% in 2022. However, the analyst acknowledged that correlation does not establish election-related causation.
https://twitter.com/alicharts/status/2113545277747450014?s=20
Fourth-quarter returns also varied. Bitcoin gained 391% in 2010 but fell 16.70% in 2014, 42.16% in 2018 and 14.75% in 2022. Three of those four midterm years ended with negative fourth-quarter returns.
Analysts Focus on $73,000 as a Key Price Level
Ali Charts identified $73,000 as a level to watch if selling pressure increases after the November 3 election. That price approximates Bitcoin’s short-term holder cost basis, representing the average purchase price for relatively recent investors.
The analyst said Bitcoin has historically found support near this metric during established bull markets. Ali would watch for seller exhaustion and renewed demand before considering a long position.
Bitcoin Moves $21B On-Chain as Analyst Flags $73K Support
Bitcoin recorded over $21 billion in spent outputs linked to holdings above $1 million, with more than 230,000 BTC moving on-chain.
Ali Charts reports Bitcoin declines of 27%–72% across four previous U.S. midterm election cycles, though correlation does not prove causation.
Ali Charts identifies $73,000 as a key support level near short-term holders’ cost basis, with seller exhaustion and renewed demand worth watching.
Bitcoin recorded its largest on-chain movement of 2026, with more than $21 billion in spent outputs linked to holdings worth over $1 million, according to analyst Darkfost. Meanwhile, Ali Charts highlighted past Bitcoin declines around U.S. midterm elections, with the November 3 vote approaching. The analysts pointed to separate signals involving transfers, historical returns and potential downside levels.
Darkfost Tracks More Than 230,000 Bitcoin in Transfers
Darkfost reported that more than 230,000 BTC moved through spent unspent transaction outputs, or UTXOs, each worth over $1 million. Most of these outputs were between one and six months old, while another $4.6 billion came from long-term holders whose coins were aged between 12 months and three years.
However, Darkfost said the movement likely involved transfers between addresses because the coins did not appear to reach exchanges. The analyst noted that UTXOs spent and sent to exchanges showed no comparable spike. Depending on whether the transactions realize profits or losses, the movement could produce a rise in either metric.
Ali Charts Highlights Bitcoin’s Midterm Election Pattern
Ali Charts said Bitcoin declined during the four previous U.S. midterm election cycles, recording drops of 72% in 2010, 65% in 2014, 52% in 2018 and 27% in 2022. However, the analyst acknowledged that correlation does not establish election-related causation.
https://twitter.com/alicharts/status/2113545277747450014?s=20
Fourth-quarter returns also varied. Bitcoin gained 391% in 2010 but fell 16.70% in 2014, 42.16% in 2018 and 14.75% in 2022. Three of those four midterm years ended with negative fourth-quarter returns.
Analysts Focus on $73,000 as a Key Price Level
Ali Charts identified $73,000 as a level to watch if selling pressure increases after the November 3 election. That price approximates Bitcoin’s short-term holder cost basis, representing the average purchase price for relatively recent investors.
The analyst said Bitcoin has historically found support near this metric during established bull markets. Ali would watch for seller exhaustion and renewed demand before considering a long position.
284
Məqalə
SEC-in tokenlaşdırma qaydaları blokçeynlərə çıxışla bağlı suallar doğururSolana tərəfdarları validatorlara nəzarətin müəyyənləşdirilməsi üçün daha aydın meyarlar təklif edir, Hedera isə SEC-dən istisnanı açıq, lakin icazəli blokçeynlərə də şamil etməsini xahiş edir.
Cümə gününə olan məlumata görə, OKXICE-nin ilkin siyahısındakı 62 şirkətdən 22-si tokenlaşdırmaya etiraz etmişdi. Onların arasında Wells Fargo, Arm Holdings və Intuit də var.
SEC-in beşillik istisnası 17 sentyabr 2031-ci ilədək qüvvədədir. Daha geniş dəyişikliklər üçün Komissiyanın tədbir görməsi və rəsmi qaydaların hazırlanması tələb oluna bilər.
ABŞ Qiymətli Kağızlar və Birjalar Komissiyasının tokenlaşdırma ilə bağlı istisnası hansı blokçeynlərin tokenləşdirilmiş səhmlərin ticarətini dəstəkləyə biləcəyi barədə suallar doğurur. Kriptovalyuta qruplarının, maliyyə sənayesi nümayəndələrinin və hüquq ekspertlərinin şərhləri “açıq və icazəsiz” anlayışının tərifinə etiraz edir. Sentyabrda tətbiq edilən müvəqqəti çərçivə əsasında üç şirkət tokenləşdirilmiş qiymətli kağızlar üçün platformalar hazırlayarkən bu müzakirələr gedir.
SEC-in tokenlaşdırma qaydaları blokçeynlərə çıxışla bağlı suallar doğurur
Solana tərəfdarları validatorlara nəzarətin müəyyənləşdirilməsi üçün daha aydın meyarlar təklif edir, Hedera isə SEC-dən istisnanı açıq, lakin icazəli blokçeynlərə də şamil etməsini xahiş edir.
Cümə gününə olan məlumata görə, OKXICE-nin ilkin siyahısındakı 62 şirkətdən 22-si tokenlaşdırmaya etiraz etmişdi. Onların arasında Wells Fargo, Arm Holdings və Intuit də var.
SEC-in beşillik istisnası 17 sentyabr 2031-ci ilədək qüvvədədir. Daha geniş dəyişikliklər üçün Komissiyanın tədbir görməsi və rəsmi qaydaların hazırlanması tələb oluna bilər.
ABŞ Qiymətli Kağızlar və Birjalar Komissiyasının tokenlaşdırma ilə bağlı istisnası hansı blokçeynlərin tokenləşdirilmiş səhmlərin ticarətini dəstəkləyə biləcəyi barədə suallar doğurur. Kriptovalyuta qruplarının, maliyyə sənayesi nümayəndələrinin və hüquq ekspertlərinin şərhləri “açıq və icazəsiz” anlayışının tərifinə etiraz edir. Sentyabrda tətbiq edilən müvəqqəti çərçivə əsasında üç şirkət tokenləşdirilmiş qiymətli kağızlar üçün platformalar hazırlayarkən bu müzakirələr gedir.
487
Daha çox kontent araşdırmaq üçün daxil olun
Binance Square-də qlobal kriptovalyuta istifadəçilərinə qoşulun
⚡️ Kriptovalyuta haqqında ən son və faydalı məlumatları əldə edin.
💬 Dünyanın ən böyük kriptovalyuta birjası tərəfindən etibar edilir.
👍 Doğrulanmış yaradıcılardan gələn real məlumatları kəşf edin.
E-poçt/Telefon nömrəsi
Trenddə olan mövzular
BinancePick
2.8M baxış
Müzakirə edir: 148,446
#GəlirlərMövsümünə qoşulun: Binance Pick-də gəlirləri proqnozlaşdırın, fikirlərinizi Binance Square-də bölüşün!
Binance Square Official
·403 bəyənmə
·341.1k baxış
EarningsSeason
5.1M baxış
Müzakirə edir: 25,363
AnthropicTTMRevenueGrewAbout1200%
4,424 baxış
Müzakirə edir: 172