
ChFarooq11
10 منشورات

ChFarooq11
إبلاغ
حظر المُستخدم
2 تتابع
15 المتابعون
13 إعجاب
منشورات
·
--
$CYBER عملة CyberConnect (CYBER) – تحليل تفصيلي للسوق
CyberConnect (CYBER) عملة مشفرة مرتبطة بمنظومة لامركزية للتواصل الاجتماعي. وتركز تقنيتها على الهوية الرقمية، والروابط الاجتماعية، وتطبيقات Web3، والبيانات التي يملكها المستخدمون.
يرتبط رمز CYBER بالحوكمة وأنشطة الشبكة في المنظومة.
2. نظرة عامة على السوق حاليًا
وفقًا لبيانات السوق المتاحة في 6 نوفمبر 2026:
المؤشر القيمة المُعلنة
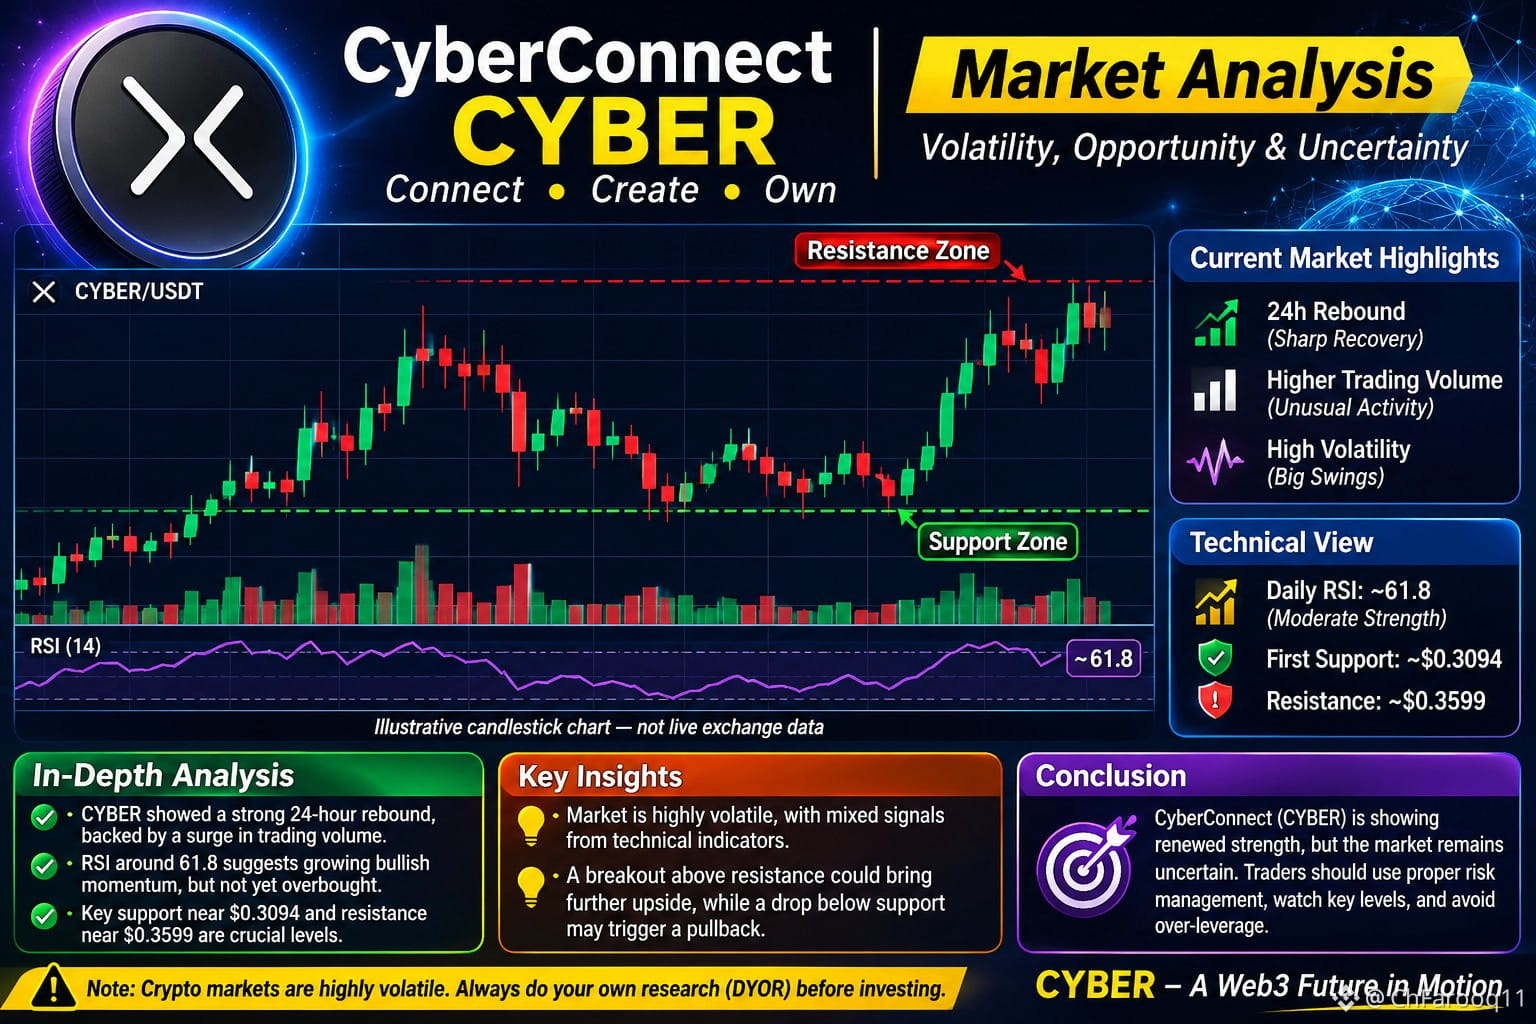
سعر CYBER نحو $0.34–$0.36
التغير خلال 24 ساعة إيجابي بقوة
حجم التداول خلال 24 ساعة مرتفع
مؤشر RSI اليومي 61.8
أول مستوى دعم $0.3094
أول مستوى مقاومة $0.3599
ذيل سفلي طويل: دخل المشترون إلى السوق بعد انخفاض الأسعار.
حجم تداول مرتفع: يشير إلى زيادة نشاط السوق.
إن الرسم البياني التوضيحي المُنشأ لعملة CYBER أعلاه لأغراض التوضيح، وليس مخططًا حيًا لبورصة.
4. التحليل الفني
أ. مستويات الدعم
$0.3094 – أول مستوى دعم مهم.
$0.2991 – مستوى الدعم الثاني.
$0.2795 – مستوى دعم إضافي.
ب. مستويات المقاومة
$0.3599 – أول مستوى مقاومة.
$0.3804 – مستوى المقاومة الثاني.
$0.4097 – مستوى المقاومة الثالث.
هذه المستويات نقاط مرجعية فنية مُعلنة، وليست أهدافًا سعرية مضمونة.
ج. تحليل مؤشر RSI
لا تتطابق المؤشرات الفنية من المصادر المختلفة تمامًا. ويبدو أن الزخم على المدى القصير أقوى من الاتجاه على المدى الطويل.
6. العوامل الأساسية
تشمل العوامل المهمة التي تؤثر في التوقعات طويلة الأجل لعملة CYBER ما يلي:
اعتماد تقنية CyberConnect.
نمو تطبيقات التواصل الاجتماعي Web3.
نشاط المطورين وتوسع المنظومة.
معروض العملة وعمليات فتح الرموز المستقبلية.
ظروف سوق العملات المشفرة عمومًا.
تشير بيانات CoinGecko إلى عملية فتح مجدولة لنحو 511,120 من رموز CYBER في 13 نوفمبر 2026.
{spot}(CYBERUSDT)
#cyber #BinanceReopensWithdrawalsForMoreAssets #AnthropicIPOValuationDoubts #SouthKoreaDelaysCryptoTaxationUntil2029
$CYBER عملة CyberConnect (CYBER) – تحليل تفصيلي للسوق
CyberConnect (CYBER) عملة مشفرة مرتبطة بمنظومة لامركزية للتواصل الاجتماعي. وتركز تقنيتها على الهوية الرقمية، والروابط الاجتماعية، وتطبيقات Web3، والبيانات التي يملكها المستخدمون.
يرتبط رمز CYBER بالحوكمة وأنشطة الشبكة في المنظومة.
2. نظرة عامة على السوق حاليًا
وفقًا لبيانات السوق المتاحة في 6 نوفمبر 2026:
المؤشر القيمة المُعلنة
سعر CYBER نحو $0.34–$0.36
التغير خلال 24 ساعة إيجابي بقوة
حجم التداول خلال 24 ساعة مرتفع
مؤشر RSI اليومي 61.8
أول مستوى دعم $0.3094
أول مستوى مقاومة $0.3599
ذيل سفلي طويل: دخل المشترون إلى السوق بعد انخفاض الأسعار.
حجم تداول مرتفع: يشير إلى زيادة نشاط السوق.
إن الرسم البياني التوضيحي المُنشأ لعملة CYBER أعلاه لأغراض التوضيح، وليس مخططًا حيًا لبورصة.
4. التحليل الفني
أ. مستويات الدعم
$0.3094 – أول مستوى دعم مهم.
$0.2991 – مستوى الدعم الثاني.
$0.2795 – مستوى دعم إضافي.
ب. مستويات المقاومة
$0.3599 – أول مستوى مقاومة.
$0.3804 – مستوى المقاومة الثاني.
$0.4097 – مستوى المقاومة الثالث.
هذه المستويات نقاط مرجعية فنية مُعلنة، وليست أهدافًا سعرية مضمونة.
ج. تحليل مؤشر RSI
لا تتطابق المؤشرات الفنية من المصادر المختلفة تمامًا. ويبدو أن الزخم على المدى القصير أقوى من الاتجاه على المدى الطويل.
6. العوامل الأساسية
تشمل العوامل المهمة التي تؤثر في التوقعات طويلة الأجل لعملة CYBER ما يلي:
اعتماد تقنية CyberConnect.
نمو تطبيقات التواصل الاجتماعي Web3.
نشاط المطورين وتوسع المنظومة.
معروض العملة وعمليات فتح الرموز المستقبلية.
ظروف سوق العملات المشفرة عمومًا.
تشير بيانات CoinGecko إلى عملية فتح مجدولة لنحو 511,120 من رموز CYBER في 13 نوفمبر 2026.
#cyber #BinanceReopensWithdrawalsForMoreAssets #AnthropicIPOValuationDoubts #SouthKoreaDelaysCryptoTaxationUntil2029
CyberConnect (CYBER) عملة مشفرة مرتبطة بمنظومة لامركزية للتواصل الاجتماعي. وتركز تقنيتها على الهوية الرقمية، والروابط الاجتماعية، وتطبيقات Web3، والبيانات التي يملكها المستخدمون.
يرتبط رمز CYBER بالحوكمة وأنشطة الشبكة في المنظومة.
2. نظرة عامة على السوق حاليًا
وفقًا لبيانات السوق المتاحة في 6 نوفمبر 2026:
المؤشر القيمة المُعلنة
سعر CYBER نحو $0.34–$0.36
التغير خلال 24 ساعة إيجابي بقوة
حجم التداول خلال 24 ساعة مرتفع
مؤشر RSI اليومي 61.8
أول مستوى دعم $0.3094
أول مستوى مقاومة $0.3599
ذيل سفلي طويل: دخل المشترون إلى السوق بعد انخفاض الأسعار.
حجم تداول مرتفع: يشير إلى زيادة نشاط السوق.
إن الرسم البياني التوضيحي المُنشأ لعملة CYBER أعلاه لأغراض التوضيح، وليس مخططًا حيًا لبورصة.
4. التحليل الفني
أ. مستويات الدعم
$0.3094 – أول مستوى دعم مهم.
$0.2991 – مستوى الدعم الثاني.
$0.2795 – مستوى دعم إضافي.
ب. مستويات المقاومة
$0.3599 – أول مستوى مقاومة.
$0.3804 – مستوى المقاومة الثاني.
$0.4097 – مستوى المقاومة الثالث.
هذه المستويات نقاط مرجعية فنية مُعلنة، وليست أهدافًا سعرية مضمونة.
ج. تحليل مؤشر RSI
لا تتطابق المؤشرات الفنية من المصادر المختلفة تمامًا. ويبدو أن الزخم على المدى القصير أقوى من الاتجاه على المدى الطويل.
6. العوامل الأساسية
تشمل العوامل المهمة التي تؤثر في التوقعات طويلة الأجل لعملة CYBER ما يلي:
اعتماد تقنية CyberConnect.
نمو تطبيقات التواصل الاجتماعي Web3.
نشاط المطورين وتوسع المنظومة.
معروض العملة وعمليات فتح الرموز المستقبلية.
ظروف سوق العملات المشفرة عمومًا.
تشير بيانات CoinGecko إلى عملية فتح مجدولة لنحو 511,120 من رموز CYBER في 13 نوفمبر 2026.
#cyber #BinanceReopensWithdrawalsForMoreAssets #AnthropicIPOValuationDoubts #SouthKoreaDelaysCryptoTaxationUntil2029
86
·
--
$APPB (رمز AppLovin Corp للأسهم المُرمّزة) هو أصل مُرمّز يهدف إلى توفير تعرّض اقتصادي لأسهم شركة AppLovin Corporation. ويختلف عن العملات المشفّرة التقليدية لأن قيمته مرتبطة بسهم أساسي.
نظرة عامة على السوق
وفقًا لأحدث لقطة متاحة من CoinMarketCap:
المؤشر | القيمة
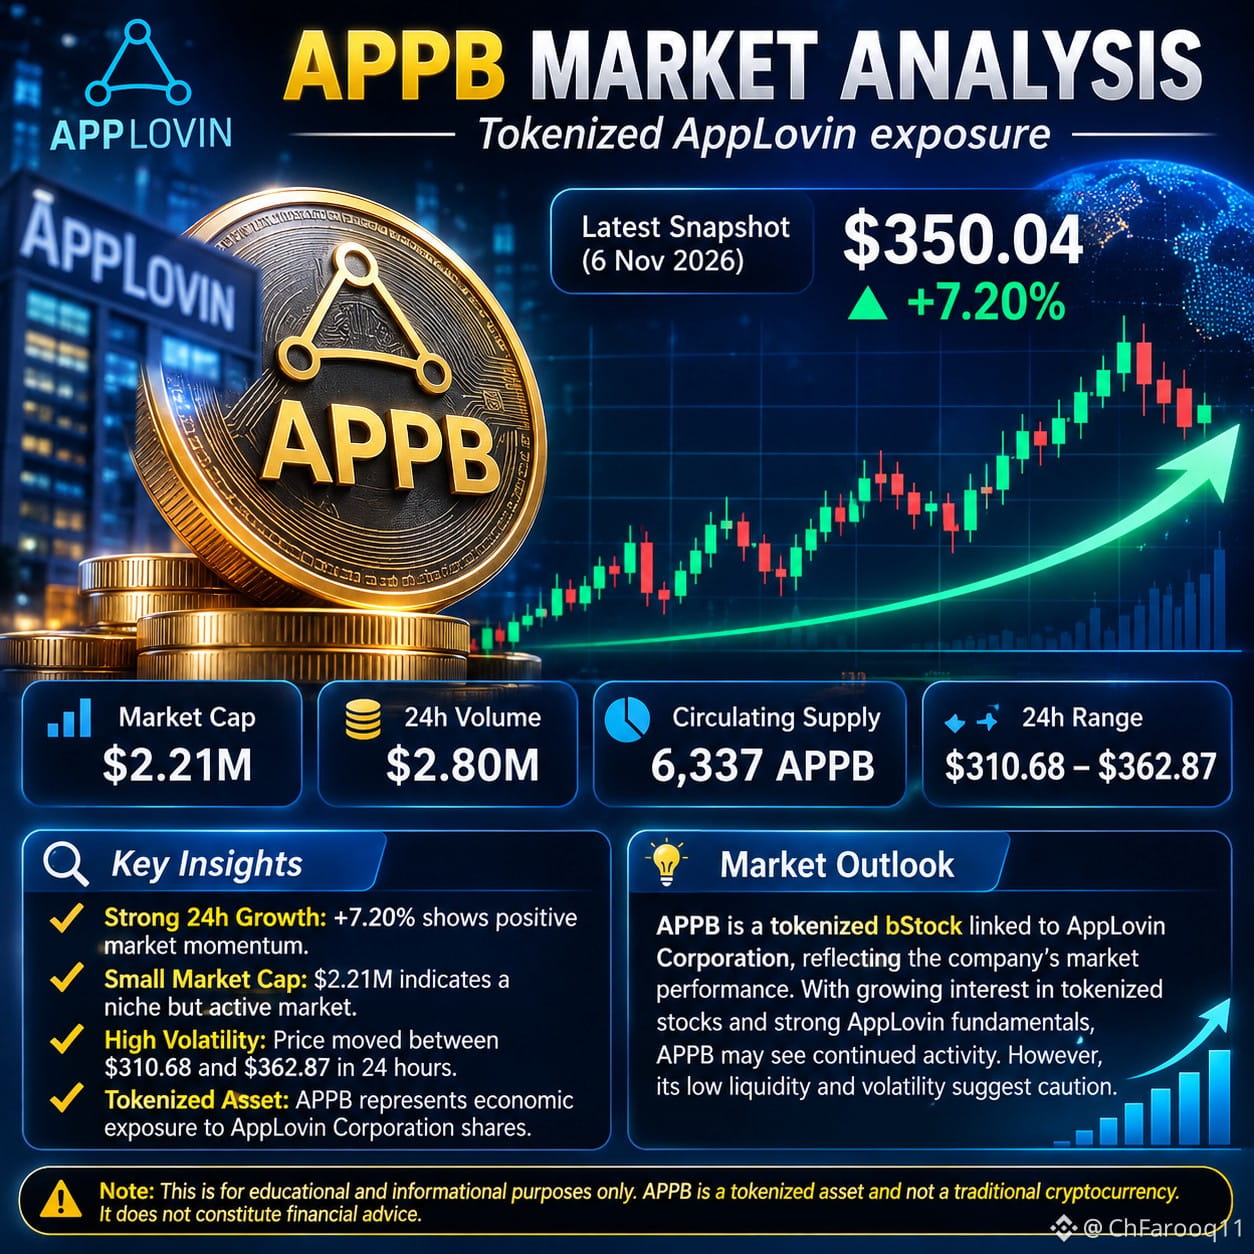
سعر APPB | $350.04
التغير خلال 24 ساعة | +7.20%
القيمة السوقية | $2.21 مليون
حجم التداول خلال 24 ساعة | $2.8 مليون
المعروض المتداول | 6,337 APPB
نطاق السعر خلال 24 ساعة | $310.68–$362.8
زخم إيجابي: تشير المكاسب المُعلنة خلال 24 ساعة إلى اهتمام قوي بالشراء مؤخرًا.
التقلّب: يشير نطاق التداول اليومي الواسع إلى تقلبات كبيرة في الأسعار.
المقاومة: يُعد المستوى المرتفع الأخير البالغ $362.87 مستوى مهمًا ينبغي مراقبته.
الدعم: يُمثّل مستوى $310.68 انخفاضًا حديثًا، وليس مستوى دعم مؤكدًا.
توقعات السوق
يعتمد أداء APPB على سعر سهم AppLovin الأساسي، ومعنويات السوق، والطلب على الأسهم المُرمّزة. وقد تزيد قيمته السوقية الصغيرة نسبيًا وسيولة تداوله من تقلبات الأسعار.
الخلاصة: أظهر APPB زخمًا إيجابيًا على المدى القصير، لكن حركة سعره لا تزال متقلبة. ولا تكفي اللقطة المتاحة وحدها لإثبات وجود اتجاه صعودي مستدام.
ملاحظة: هذه معلومات تثقيفية عن السوق وليست نصيحة مالية. قد تتغير الأسعار بسرعة.
{spot}(APPBUSDT)
#USStocksSlipandCryptoMarketUnderBroadPressure #USStocksSufferSteepestRoutSince2020 #StrategySTRCResumesIssuanceAfterOver170Days #Nasdaq100Tumbles6% #GreekParliamentPasses10%CryptoCapitalGainsTaxBill
$APPB (رمز AppLovin Corp للأسهم المُرمّزة) هو أصل مُرمّز يهدف إلى توفير تعرّض اقتصادي لأسهم شركة AppLovin Corporation. ويختلف عن العملات المشفّرة التقليدية لأن قيمته مرتبطة بسهم أساسي.
نظرة عامة على السوق
وفقًا لأحدث لقطة متاحة من CoinMarketCap:
المؤشر | القيمة
سعر APPB | $350.04
التغير خلال 24 ساعة | +7.20%
القيمة السوقية | $2.21 مليون
حجم التداول خلال 24 ساعة | $2.8 مليون
المعروض المتداول | 6,337 APPB
نطاق السعر خلال 24 ساعة | $310.68–$362.8
زخم إيجابي: تشير المكاسب المُعلنة خلال 24 ساعة إلى اهتمام قوي بالشراء مؤخرًا.
التقلّب: يشير نطاق التداول اليومي الواسع إلى تقلبات كبيرة في الأسعار.
المقاومة: يُعد المستوى المرتفع الأخير البالغ $362.87 مستوى مهمًا ينبغي مراقبته.
الدعم: يُمثّل مستوى $310.68 انخفاضًا حديثًا، وليس مستوى دعم مؤكدًا.
توقعات السوق
يعتمد أداء APPB على سعر سهم AppLovin الأساسي، ومعنويات السوق، والطلب على الأسهم المُرمّزة. وقد تزيد قيمته السوقية الصغيرة نسبيًا وسيولة تداوله من تقلبات الأسعار.
الخلاصة: أظهر APPB زخمًا إيجابيًا على المدى القصير، لكن حركة سعره لا تزال متقلبة. ولا تكفي اللقطة المتاحة وحدها لإثبات وجود اتجاه صعودي مستدام.
ملاحظة: هذه معلومات تثقيفية عن السوق وليست نصيحة مالية. قد تتغير الأسعار بسرعة.
#USStocksSlipandCryptoMarketUnderBroadPressure #USStocksSufferSteepestRoutSince2020 #StrategySTRCResumesIssuanceAfterOver170Days #Nasdaq100Tumbles6% #GreekParliamentPasses10%CryptoCapitalGainsTaxBill
نظرة عامة على السوق
وفقًا لأحدث لقطة متاحة من CoinMarketCap:
المؤشر | القيمة
سعر APPB | $350.04
التغير خلال 24 ساعة | +7.20%
القيمة السوقية | $2.21 مليون
حجم التداول خلال 24 ساعة | $2.8 مليون
المعروض المتداول | 6,337 APPB
نطاق السعر خلال 24 ساعة | $310.68–$362.8
زخم إيجابي: تشير المكاسب المُعلنة خلال 24 ساعة إلى اهتمام قوي بالشراء مؤخرًا.
التقلّب: يشير نطاق التداول اليومي الواسع إلى تقلبات كبيرة في الأسعار.
المقاومة: يُعد المستوى المرتفع الأخير البالغ $362.87 مستوى مهمًا ينبغي مراقبته.
الدعم: يُمثّل مستوى $310.68 انخفاضًا حديثًا، وليس مستوى دعم مؤكدًا.
توقعات السوق
يعتمد أداء APPB على سعر سهم AppLovin الأساسي، ومعنويات السوق، والطلب على الأسهم المُرمّزة. وقد تزيد قيمته السوقية الصغيرة نسبيًا وسيولة تداوله من تقلبات الأسعار.
الخلاصة: أظهر APPB زخمًا إيجابيًا على المدى القصير، لكن حركة سعره لا تزال متقلبة. ولا تكفي اللقطة المتاحة وحدها لإثبات وجود اتجاه صعودي مستدام.
ملاحظة: هذه معلومات تثقيفية عن السوق وليست نصيحة مالية. قد تتغير الأسعار بسرعة.
#USStocksSlipandCryptoMarketUnderBroadPressure #USStocksSufferSteepestRoutSince2020 #StrategySTRCResumesIssuanceAfterOver170Days #Nasdaq100Tumbles6% #GreekParliamentPasses10%CryptoCapitalGainsTaxBill
56
·
--
$ETH
هي إحدى أبرز العملات المشفرة في العالم. إنها منصة بلوك تشين لامركزية تدعم العقود الذكية والتطبيقات اللامركزية (DApps) والتمويل الرقمي.
نظرة عامة على السوق حاليًا
اعتبارًا من 6 نوفمبر 2026، يُتداول إيثيريوم عند نحو $2,236–$2,240، مع انخفاض يُقدّر بنحو 7.8% خلال الأربع والعشرين ساعة الماضية.
التحليل الفني
اتجاه السوق: هبوطي على المدى القصير.
مستوى الدعم: نحو $2,200–$2,220.
مستوى المقاومة: نحو $2,279–$2,330.
الزخم: لا يزال ضغط البيع مرتفعًا.
توقعات السوق: يحتاج إيثيريوم إلى استعادة مستويات المقاومة المهمة لإظهار مؤشرات على التعافي.
الخلاصة
يتمتع إيثيريوم بأهمية تقنية كبيرة على المدى الطويل بفضل منظومة البلوك تشين والعقود الذكية وتطبيقات التمويل اللامركزي (DeFi). ومع ذلك، تُظهر ظروف السوق الحالية ضعفًا وتقلبًا مرتفعًا. وسيعتمد أداؤه المستقبلي على طلب السوق ومعنويات المستثمرين وتطور الشبكة والظروف الاقتصادية العالمية.
هام: هذا تحليل تثقيفي للسوق، وليس نصيحة مالية. يمكن أن تتغير أسعار العملات المشفرة بسرعة.
{spot}(ETHUSDT)
#AnthropicIPOValuationDoubts #USStocksSlipandCryptoMarketUnderBroadPressure #BinanceReopensWithdrawalsForMoreAssets #USStocksSufferSteepestRoutSince2020 #StrategySTRCResumesIssuanceAfterOver170Days
$ETH
هي إحدى أبرز العملات المشفرة في العالم. إنها منصة بلوك تشين لامركزية تدعم العقود الذكية والتطبيقات اللامركزية (DApps) والتمويل الرقمي.
نظرة عامة على السوق حاليًا
اعتبارًا من 6 نوفمبر 2026، يُتداول إيثيريوم عند نحو $2,236–$2,240، مع انخفاض يُقدّر بنحو 7.8% خلال الأربع والعشرين ساعة الماضية.
التحليل الفني
اتجاه السوق: هبوطي على المدى القصير.
مستوى الدعم: نحو $2,200–$2,220.
مستوى المقاومة: نحو $2,279–$2,330.
الزخم: لا يزال ضغط البيع مرتفعًا.
توقعات السوق: يحتاج إيثيريوم إلى استعادة مستويات المقاومة المهمة لإظهار مؤشرات على التعافي.
الخلاصة
يتمتع إيثيريوم بأهمية تقنية كبيرة على المدى الطويل بفضل منظومة البلوك تشين والعقود الذكية وتطبيقات التمويل اللامركزي (DeFi). ومع ذلك، تُظهر ظروف السوق الحالية ضعفًا وتقلبًا مرتفعًا. وسيعتمد أداؤه المستقبلي على طلب السوق ومعنويات المستثمرين وتطور الشبكة والظروف الاقتصادية العالمية.
هام: هذا تحليل تثقيفي للسوق، وليس نصيحة مالية. يمكن أن تتغير أسعار العملات المشفرة بسرعة.
#AnthropicIPOValuationDoubts #USStocksSlipandCryptoMarketUnderBroadPressure #BinanceReopensWithdrawalsForMoreAssets #USStocksSufferSteepestRoutSince2020 #StrategySTRCResumesIssuanceAfterOver170Days
هي إحدى أبرز العملات المشفرة في العالم. إنها منصة بلوك تشين لامركزية تدعم العقود الذكية والتطبيقات اللامركزية (DApps) والتمويل الرقمي.
نظرة عامة على السوق حاليًا
اعتبارًا من 6 نوفمبر 2026، يُتداول إيثيريوم عند نحو $2,236–$2,240، مع انخفاض يُقدّر بنحو 7.8% خلال الأربع والعشرين ساعة الماضية.
التحليل الفني
اتجاه السوق: هبوطي على المدى القصير.
مستوى الدعم: نحو $2,200–$2,220.
مستوى المقاومة: نحو $2,279–$2,330.
الزخم: لا يزال ضغط البيع مرتفعًا.
توقعات السوق: يحتاج إيثيريوم إلى استعادة مستويات المقاومة المهمة لإظهار مؤشرات على التعافي.
الخلاصة
يتمتع إيثيريوم بأهمية تقنية كبيرة على المدى الطويل بفضل منظومة البلوك تشين والعقود الذكية وتطبيقات التمويل اللامركزي (DeFi). ومع ذلك، تُظهر ظروف السوق الحالية ضعفًا وتقلبًا مرتفعًا. وسيعتمد أداؤه المستقبلي على طلب السوق ومعنويات المستثمرين وتطور الشبكة والظروف الاقتصادية العالمية.
هام: هذا تحليل تثقيفي للسوق، وليس نصيحة مالية. يمكن أن تتغير أسعار العملات المشفرة بسرعة.
#AnthropicIPOValuationDoubts #USStocksSlipandCryptoMarketUnderBroadPressure #BinanceReopensWithdrawalsForMoreAssets #USStocksSufferSteepestRoutSince2020 #StrategySTRCResumesIssuanceAfterOver170Days

81
·
--
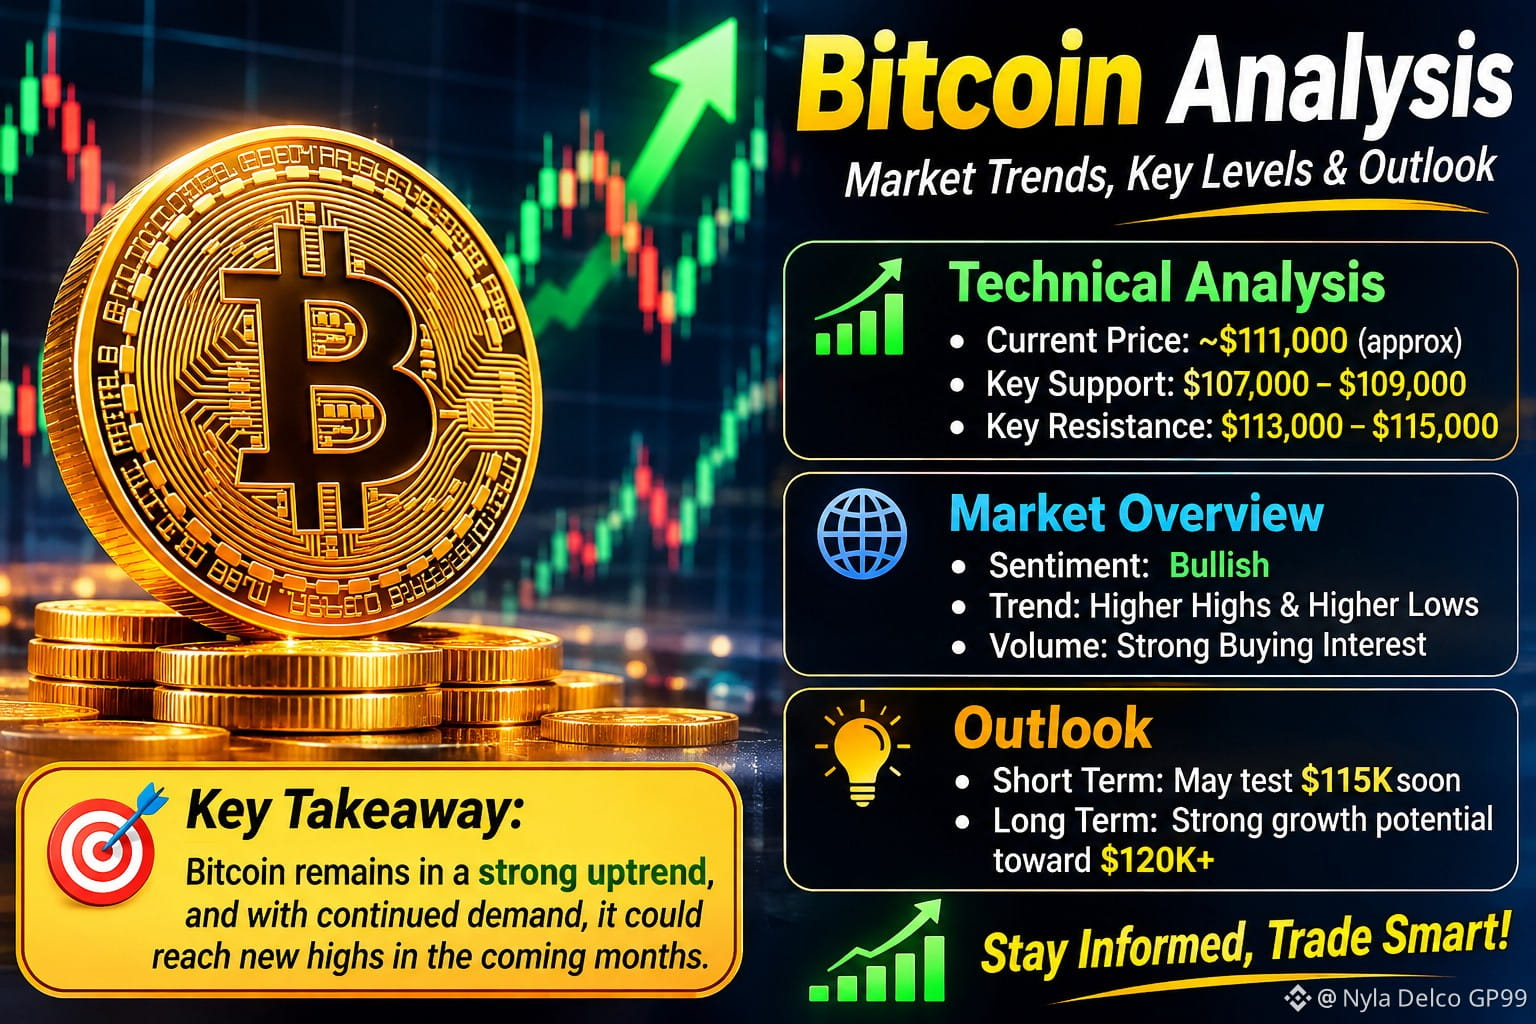
$BTC هي العملة المشفرة الرائدة في العالم. ويتأثر سعرها بطلب السوق، ومعنويات المستثمرين، والظروف الاقتصادية العالمية، ونشاط التداول.
النقاط الرئيسية لتحليل بيتكوين:
اتجاه السوق: يمكن أن ترتفع أسعار بيتكوين أو تنخفض تبعًا لظروف السوق.
التحليل الفني: يدرس المتداولون مستويات الدعم والمقاومة والرسوم البيانية وحجم التداول.
تقلبات السوق: تتميز بيتكوين بتقلبات عالية، لذا قد تتغير الأسعار بسرعة.
التوقعات المستقبلية: تتمتع بيتكوين بإمكانات نمو على المدى الطويل، لكن أسعارها المستقبلية غير مؤكدة.
الخلاصة: بيتكوين أصل رقمي مهم ينطوي على فرص ومخاطر. احرص دائمًا على إجراء بحث دقيق قبل اتخاذ القرارات المالية.
{spot}(BTCUSDT)
#BinanceReopensWithdrawalsForMoreAssets #AnthropicIPOValuationDoubts #USStocksSlipandCryptoMarketUnderBroadPressure #USStocksSufferSteepestRoutSince2020 #USStocksSufferSteepestRoutSince2020
$BTC هي العملة المشفرة الرائدة في العالم. ويتأثر سعرها بطلب السوق، ومعنويات المستثمرين، والظروف الاقتصادية العالمية، ونشاط التداول.
النقاط الرئيسية لتحليل بيتكوين:
اتجاه السوق: يمكن أن ترتفع أسعار بيتكوين أو تنخفض تبعًا لظروف السوق.
التحليل الفني: يدرس المتداولون مستويات الدعم والمقاومة والرسوم البيانية وحجم التداول.
تقلبات السوق: تتميز بيتكوين بتقلبات عالية، لذا قد تتغير الأسعار بسرعة.
التوقعات المستقبلية: تتمتع بيتكوين بإمكانات نمو على المدى الطويل، لكن أسعارها المستقبلية غير مؤكدة.
الخلاصة: بيتكوين أصل رقمي مهم ينطوي على فرص ومخاطر. احرص دائمًا على إجراء بحث دقيق قبل اتخاذ القرارات المالية.
#BinanceReopensWithdrawalsForMoreAssets #AnthropicIPOValuationDoubts #USStocksSlipandCryptoMarketUnderBroadPressure #USStocksSufferSteepestRoutSince2020 #USStocksSufferSteepestRoutSince2020
النقاط الرئيسية لتحليل بيتكوين:
اتجاه السوق: يمكن أن ترتفع أسعار بيتكوين أو تنخفض تبعًا لظروف السوق.
التحليل الفني: يدرس المتداولون مستويات الدعم والمقاومة والرسوم البيانية وحجم التداول.
تقلبات السوق: تتميز بيتكوين بتقلبات عالية، لذا قد تتغير الأسعار بسرعة.
التوقعات المستقبلية: تتمتع بيتكوين بإمكانات نمو على المدى الطويل، لكن أسعارها المستقبلية غير مؤكدة.
الخلاصة: بيتكوين أصل رقمي مهم ينطوي على فرص ومخاطر. احرص دائمًا على إجراء بحث دقيق قبل اتخاذ القرارات المالية.
#BinanceReopensWithdrawalsForMoreAssets #AnthropicIPOValuationDoubts #USStocksSlipandCryptoMarketUnderBroadPressure #USStocksSufferSteepestRoutSince2020 #USStocksSufferSteepestRoutSince2020
95
·
--
عرض الترجمة
BlackRock’s iShares bitcoin fund sees record exodus as crypto heads for worst month since 2022
Key Points
The iShares Bitcoin Trust ETF has recorded $2.2 billion in outflows this month, as of Monday, FactSet data shows.
That’s nearly eight times the $291 million in losses suffered by the investment vehicle last October, or its second-worst month on record since its debut in early 2024.
The outflows come as bitcoin is down more than 20% over the past month.
traders are now pricing in more than 80% odds that the Federal Reserve will slash rates at its December meeting, such a cut remains far from sure bet.
Amid all the uncertainty, bitcoin is bleeding. And, investors in spot bitcoin ETFs, particularly newer holders, are feeling pressure to sell their shares — a reality that could extend the asset’s downside in the near term, Frank Chaparro, head of content and special projects at crypto-focused trading firm GSR, told CNBC.
“With the macro environment becoming less certain, investors tend to de-risk across assets, which often means trimming exposure to crypto and other risk-sensitive stocks,” Chaparro said. “And for newer entrants who came in through the funds, any downturn can be unsettling – they can sell just as quickly as they bought.”
But while it’s true that spot bitcoin ETFs have brought in hoards of new retail investors who may be flighty during volatile times, the funds have also attracted a range of long-term investors such as institutions who can hold through the downturn, according to Joshua Levine, chairman at bitcoin treasury firm OranjeBTC, told CNBC.
That institutional base could “dampen some of the extreme downside, but also smooth upside, reducing bitcoin’s volatility as the asset class matures,” Levine said.
BlackRock’s iShares bitcoin fund sees record exodus as crypto heads for worst month since 2022
Key Points
The iShares Bitcoin Trust ETF has recorded $2.2 billion in outflows this month, as of Monday, FactSet data shows.
That’s nearly eight times the $291 million in losses suffered by the investment vehicle last October, or its second-worst month on record since its debut in early 2024.
The outflows come as bitcoin is down more than 20% over the past month.
traders are now pricing in more than 80% odds that the Federal Reserve will slash rates at its December meeting, such a cut remains far from sure bet.
Amid all the uncertainty, bitcoin is bleeding. And, investors in spot bitcoin ETFs, particularly newer holders, are feeling pressure to sell their shares — a reality that could extend the asset’s downside in the near term, Frank Chaparro, head of content and special projects at crypto-focused trading firm GSR, told CNBC.
“With the macro environment becoming less certain, investors tend to de-risk across assets, which often means trimming exposure to crypto and other risk-sensitive stocks,” Chaparro said. “And for newer entrants who came in through the funds, any downturn can be unsettling – they can sell just as quickly as they bought.”
But while it’s true that spot bitcoin ETFs have brought in hoards of new retail investors who may be flighty during volatile times, the funds have also attracted a range of long-term investors such as institutions who can hold through the downturn, according to Joshua Levine, chairman at bitcoin treasury firm OranjeBTC, told CNBC.
That institutional base could “dampen some of the extreme downside, but also smooth upside, reducing bitcoin’s volatility as the asset class matures,” Levine said.
The iShares Bitcoin Trust ETF has recorded $2.2 billion in outflows this month, as of Monday, FactSet data shows.
That’s nearly eight times the $291 million in losses suffered by the investment vehicle last October, or its second-worst month on record since its debut in early 2024.
The outflows come as bitcoin is down more than 20% over the past month.
traders are now pricing in more than 80% odds that the Federal Reserve will slash rates at its December meeting, such a cut remains far from sure bet.
Amid all the uncertainty, bitcoin is bleeding. And, investors in spot bitcoin ETFs, particularly newer holders, are feeling pressure to sell their shares — a reality that could extend the asset’s downside in the near term, Frank Chaparro, head of content and special projects at crypto-focused trading firm GSR, told CNBC.
“With the macro environment becoming less certain, investors tend to de-risk across assets, which often means trimming exposure to crypto and other risk-sensitive stocks,” Chaparro said. “And for newer entrants who came in through the funds, any downturn can be unsettling – they can sell just as quickly as they bought.”
But while it’s true that spot bitcoin ETFs have brought in hoards of new retail investors who may be flighty during volatile times, the funds have also attracted a range of long-term investors such as institutions who can hold through the downturn, according to Joshua Levine, chairman at bitcoin treasury firm OranjeBTC, told CNBC.
That institutional base could “dampen some of the extreme downside, but also smooth upside, reducing bitcoin’s volatility as the asset class matures,” Levine said.
1
·
--
عرض الترجمة
Pi Network’s Chart Resembles Ethereum’sPi Network’s Chart Resembles Ethereum’s Early Days — Is History Repeating?
In the cryptocurrency market, history doesn’t always repeat—but it often rhymes. Pi Network (PI), after six years of development, officially launched its mainnet on February 20, 2024. Since then, the project has been closely watched by the crypto community, not just for its unique mobile-first mining model, but also for its intriguing price movement.
Following its debut, PI saw a strong surge, briefly touching $3 before facing a correction that brought it back to the current trading range of around $1. While price volatility is common in early-stage listings, what’s capturing attention now is something far more interesting—a possible repetition of a historical pattern seen in Ethereum’s (ETH) early days.
PI Mirrors Ethereum’s Early Listing Phase
Our recent comparative chart analysis between Ethereum’s early listing period and Pi Network’s current listing period price behavior shows striking similarities. Both assets display a falling wedge pattern, a well-known bullish reversal formation in technical analysis.
ETH-PI Chart Comparison/Coinsprobe (Source: Tradingview)
Looking back at Ethereum in 2015–2016, the coin entered exchanges at a price close to $1 and moved into a low-volatility phase, clearly marked by a falling wedge structure. After several weeks of consolidation, ETH broke out of this wedge, and a move above its 15-day moving average (15D MA) triggered a sharp bullish rally. This breakout didn’t just signal momentum—it delivered results. ETH surged over 1,400%, climbing from around $0.85 to over $14 within a couple of months.
Fast forward to 2025, Pi Network appears to be painting a similar picture. On the right side of the chart, PI is consolidating in a falling wedge pattern, with its current price hovering around $1—the same level ETH was trading before its breakout. The 15D MA is also hovering just above the price, much like ETH’s setup before its surge.
If Pi follows the same path as Ethereum, it doesn’t take a technical analyst to imagine what could come next.
Is History Repeating?
Of course, it’s important to approach chart similarities with caution. Ethereum’s rise was powered by groundbreaking smart contract technology and early developer adoption. Pi Network, while growing rapidly in user numbers, is still in the process of defining its core utilities and building tangible use cases in the ecosystem.
However, markets often move in patterns, reflecting collective psychology more than just fundamentals. And if the current chart structure is any indication, Pi Network could be quietly preparing for a similar breakout phase.
The momentum may depend on several factors—market sentiment, utility rollout, exchange integrations, and broader crypto trends. But from a pure technical perspective, all eyes are now on whether Pi can break above the wedge and its 15D MA, just as Ethereum once did.
Disclaimer: This article is for informational purposes only and does not constitute financial advice. Always conduct your own research before making any investment decisions.
Pi Network’s Chart Resembles Ethereum’s
Pi Network’s Chart Resembles Ethereum’s Early Days — Is History Repeating?
In the cryptocurrency market, history doesn’t always repeat—but it often rhymes. Pi Network (PI), after six years of development, officially launched its mainnet on February 20, 2024. Since then, the project has been closely watched by the crypto community, not just for its unique mobile-first mining model, but also for its intriguing price movement.
Following its debut, PI saw a strong surge, briefly touching $3 before facing a correction that brought it back to the current trading range of around $1. While price volatility is common in early-stage listings, what’s capturing attention now is something far more interesting—a possible repetition of a historical pattern seen in Ethereum’s (ETH) early days.
PI Mirrors Ethereum’s Early Listing Phase
Our recent comparative chart analysis between Ethereum’s early listing period and Pi Network’s current listing period price behavior shows striking similarities. Both assets display a falling wedge pattern, a well-known bullish reversal formation in technical analysis.
ETH-PI Chart Comparison/Coinsprobe (Source: Tradingview)
Looking back at Ethereum in 2015–2016, the coin entered exchanges at a price close to $1 and moved into a low-volatility phase, clearly marked by a falling wedge structure. After several weeks of consolidation, ETH broke out of this wedge, and a move above its 15-day moving average (15D MA) triggered a sharp bullish rally. This breakout didn’t just signal momentum—it delivered results. ETH surged over 1,400%, climbing from around $0.85 to over $14 within a couple of months.
Fast forward to 2025, Pi Network appears to be painting a similar picture. On the right side of the chart, PI is consolidating in a falling wedge pattern, with its current price hovering around $1—the same level ETH was trading before its breakout. The 15D MA is also hovering just above the price, much like ETH’s setup before its surge.
If Pi follows the same path as Ethereum, it doesn’t take a technical analyst to imagine what could come next.
Is History Repeating?
Of course, it’s important to approach chart similarities with caution. Ethereum’s rise was powered by groundbreaking smart contract technology and early developer adoption. Pi Network, while growing rapidly in user numbers, is still in the process of defining its core utilities and building tangible use cases in the ecosystem.
However, markets often move in patterns, reflecting collective psychology more than just fundamentals. And if the current chart structure is any indication, Pi Network could be quietly preparing for a similar breakout phase.
The momentum may depend on several factors—market sentiment, utility rollout, exchange integrations, and broader crypto trends. But from a pure technical perspective, all eyes are now on whether Pi can break above the wedge and its 15D MA, just as Ethereum once did.
Disclaimer: This article is for informational purposes only and does not constitute financial advice. Always conduct your own research before making any investment decisions.
In the cryptocurrency market, history doesn’t always repeat—but it often rhymes. Pi Network (PI), after six years of development, officially launched its mainnet on February 20, 2024. Since then, the project has been closely watched by the crypto community, not just for its unique mobile-first mining model, but also for its intriguing price movement.
Following its debut, PI saw a strong surge, briefly touching $3 before facing a correction that brought it back to the current trading range of around $1. While price volatility is common in early-stage listings, what’s capturing attention now is something far more interesting—a possible repetition of a historical pattern seen in Ethereum’s (ETH) early days.
PI Mirrors Ethereum’s Early Listing Phase
Our recent comparative chart analysis between Ethereum’s early listing period and Pi Network’s current listing period price behavior shows striking similarities. Both assets display a falling wedge pattern, a well-known bullish reversal formation in technical analysis.
ETH-PI Chart Comparison/Coinsprobe (Source: Tradingview)
Looking back at Ethereum in 2015–2016, the coin entered exchanges at a price close to $1 and moved into a low-volatility phase, clearly marked by a falling wedge structure. After several weeks of consolidation, ETH broke out of this wedge, and a move above its 15-day moving average (15D MA) triggered a sharp bullish rally. This breakout didn’t just signal momentum—it delivered results. ETH surged over 1,400%, climbing from around $0.85 to over $14 within a couple of months.
Fast forward to 2025, Pi Network appears to be painting a similar picture. On the right side of the chart, PI is consolidating in a falling wedge pattern, with its current price hovering around $1—the same level ETH was trading before its breakout. The 15D MA is also hovering just above the price, much like ETH’s setup before its surge.
If Pi follows the same path as Ethereum, it doesn’t take a technical analyst to imagine what could come next.
Is History Repeating?
Of course, it’s important to approach chart similarities with caution. Ethereum’s rise was powered by groundbreaking smart contract technology and early developer adoption. Pi Network, while growing rapidly in user numbers, is still in the process of defining its core utilities and building tangible use cases in the ecosystem.
However, markets often move in patterns, reflecting collective psychology more than just fundamentals. And if the current chart structure is any indication, Pi Network could be quietly preparing for a similar breakout phase.
The momentum may depend on several factors—market sentiment, utility rollout, exchange integrations, and broader crypto trends. But from a pure technical perspective, all eyes are now on whether Pi can break above the wedge and its 15D MA, just as Ethereum once did.
Disclaimer: This article is for informational purposes only and does not constitute financial advice. Always conduct your own research before making any investment decisions.
61
·
--
عرض الترجمة
#RamadanGiveaway
The holy month of Ramadan is a time of reflection, gratitude, and generosity. To celebrate this blessed season, we’re excited to announce our #RamadanGiveaway! Share your favorite Ramadan traditions, memories, or acts of kindness for a chance to win amazing prizes. Whether it’s preparing iftar with loved ones, reading Quran, or helping those in need, let’s spread the spirit of Ramadan together. Follow us, tag friends, and use #RamadanGiveaway to enter. Winners will be announced at the end of the month. May this Ramadan bring peace, joy, and countless blessings to all. Good luck! 🌙✨ #Blessings #Community #Giveback
#RamadanGiveaway
The holy month of Ramadan is a time of reflection, gratitude, and generosity. To celebrate this blessed season, we’re excited to announce our #RamadanGiveaway! Share your favorite Ramadan traditions, memories, or acts of kindness for a chance to win amazing prizes. Whether it’s preparing iftar with loved ones, reading Quran, or helping those in need, let’s spread the spirit of Ramadan together. Follow us, tag friends, and use #RamadanGiveaway to enter. Winners will be announced at the end of the month. May this Ramadan bring peace, joy, and countless blessings to all. Good luck! 🌙✨ #Blessings #Community #Giveback
The holy month of Ramadan is a time of reflection, gratitude, and generosity. To celebrate this blessed season, we’re excited to announce our #RamadanGiveaway! Share your favorite Ramadan traditions, memories, or acts of kindness for a chance to win amazing prizes. Whether it’s preparing iftar with loved ones, reading Quran, or helping those in need, let’s spread the spirit of Ramadan together. Follow us, tag friends, and use #RamadanGiveaway to enter. Winners will be announced at the end of the month. May this Ramadan bring peace, joy, and countless blessings to all. Good luck! 🌙✨ #Blessings #Community #Giveback
59
·
--
عرض الترجمة
The power of the community is stronger than ever! 🚀 Binance is giving users the chance to decide which project gets listed next, and your vote can make all the difference. Supporting your favorite token means increased visibility, liquidity, and massive growth potential. A Binance listing can take a project to the next level, attracting new investors and boosting adoption. Now is the time to come together, spread the word, and rally behind the project you believe in. Don’t miss this opportunity to shape the future of crypto—every vote counts! Cast your vote today! 🔥 #VoteToListOnBinance
The power of the community is stronger than ever! 🚀 Binance is giving users the chance to decide which project gets listed next, and your vote can make all the difference. Supporting your favorite token means increased visibility, liquidity, and massive growth potential. A Binance listing can take a project to the next level, attracting new investors and boosting adoption. Now is the time to come together, spread the word, and rally behind the project you believe in. Don’t miss this opportunity to shape the future of crypto—every vote counts! Cast your vote today! 🔥 #VoteToListOnBinance
92
·
--
عرض الترجمة
#pi pi coin prediction 2025 & 2026
March 2025: PI Prediction
Analysts expect PI's price to rise in March, with a projected change of 112.06% compared to current rates. The asset may reach a high of $ 3.92 and a low of $ 1.163461, averaging around $ 2.34. This prediction comes after a poor market performance in the last 30 days – during which time lost -21.43% – indicating a possible reversal of the trend. The potential ROI stands at 255.72%, suggesting a profitable opportunity for long traders.
In 2026, Pi Network is forecasted to trade in a price channel between $ 1.098607 and $ 3.20. On average, PI is expected to change hands at $ 2.26 during the year. The most bullish month for PI could be January, when the currency is anticipated to trade 190.04% higher than today.
#pi pi coin prediction 2025 & 2026
March 2025: PI Prediction
Analysts expect PI's price to rise in March, with a projected change of 112.06% compared to current rates. The asset may reach a high of $ 3.92 and a low of $ 1.163461, averaging around $ 2.34. This prediction comes after a poor market performance in the last 30 days – during which time lost -21.43% – indicating a possible reversal of the trend. The potential ROI stands at 255.72%, suggesting a profitable opportunity for long traders.
In 2026, Pi Network is forecasted to trade in a price channel between $ 1.098607 and $ 3.20. On average, PI is expected to change hands at $ 2.26 during the year. The most bullish month for PI could be January, when the currency is anticipated to trade 190.04% higher than today.
March 2025: PI Prediction
Analysts expect PI's price to rise in March, with a projected change of 112.06% compared to current rates. The asset may reach a high of $ 3.92 and a low of $ 1.163461, averaging around $ 2.34. This prediction comes after a poor market performance in the last 30 days – during which time lost -21.43% – indicating a possible reversal of the trend. The potential ROI stands at 255.72%, suggesting a profitable opportunity for long traders.
In 2026, Pi Network is forecasted to trade in a price channel between $ 1.098607 and $ 3.20. On average, PI is expected to change hands at $ 2.26 during the year. The most bullish month for PI could be January, when the currency is anticipated to trade 190.04% higher than today.
13
145
سجّل الدخول لاستكشاف المزيد من المُحتوى
انضم إلى مُستخدمي العملات الرقمية حول العالم على Binance Square
⚡️ احصل على أحدث المعلومات المفيدة عن العملات الرقمية.
💬 موثوقة من قبل أكبر منصّة لتداول العملات الرقمية في العالم.
👍 اكتشف الرؤى الحقيقية من صنّاع المُحتوى الموثوقين.
البريد الإلكتروني / رقم الهاتف
المواضيع الرائجة
BinanceReopensWithdrawalsForMoreAssets
1.1M مشاهدات
5,937 يقومون بالنقاش
تحديث التعافي رقم 9: إعادة فتح السحب لمزيد من الأصول (2026-11-06)
Binance Announcement
·199 إعجاب
·785k مشاهدات
$2TWipedOutHedgeFundsFaceLiquidation
1,620 مشاهدات
35 يقومون بالنقاش
AnthropicIPOValuationDoubts
19,167 مشاهدات
450 يقومون بالنقاش