

Anonymous User-d9aa9
31 منشورات

Anonymous User-d9aa9
إبلاغ
حظر المُستخدم
مُتداول عرضي
2 سنوات
149 تتابع
120 المتابعون
94 إعجاب
منشورات
PINNED
عرض الترجمة
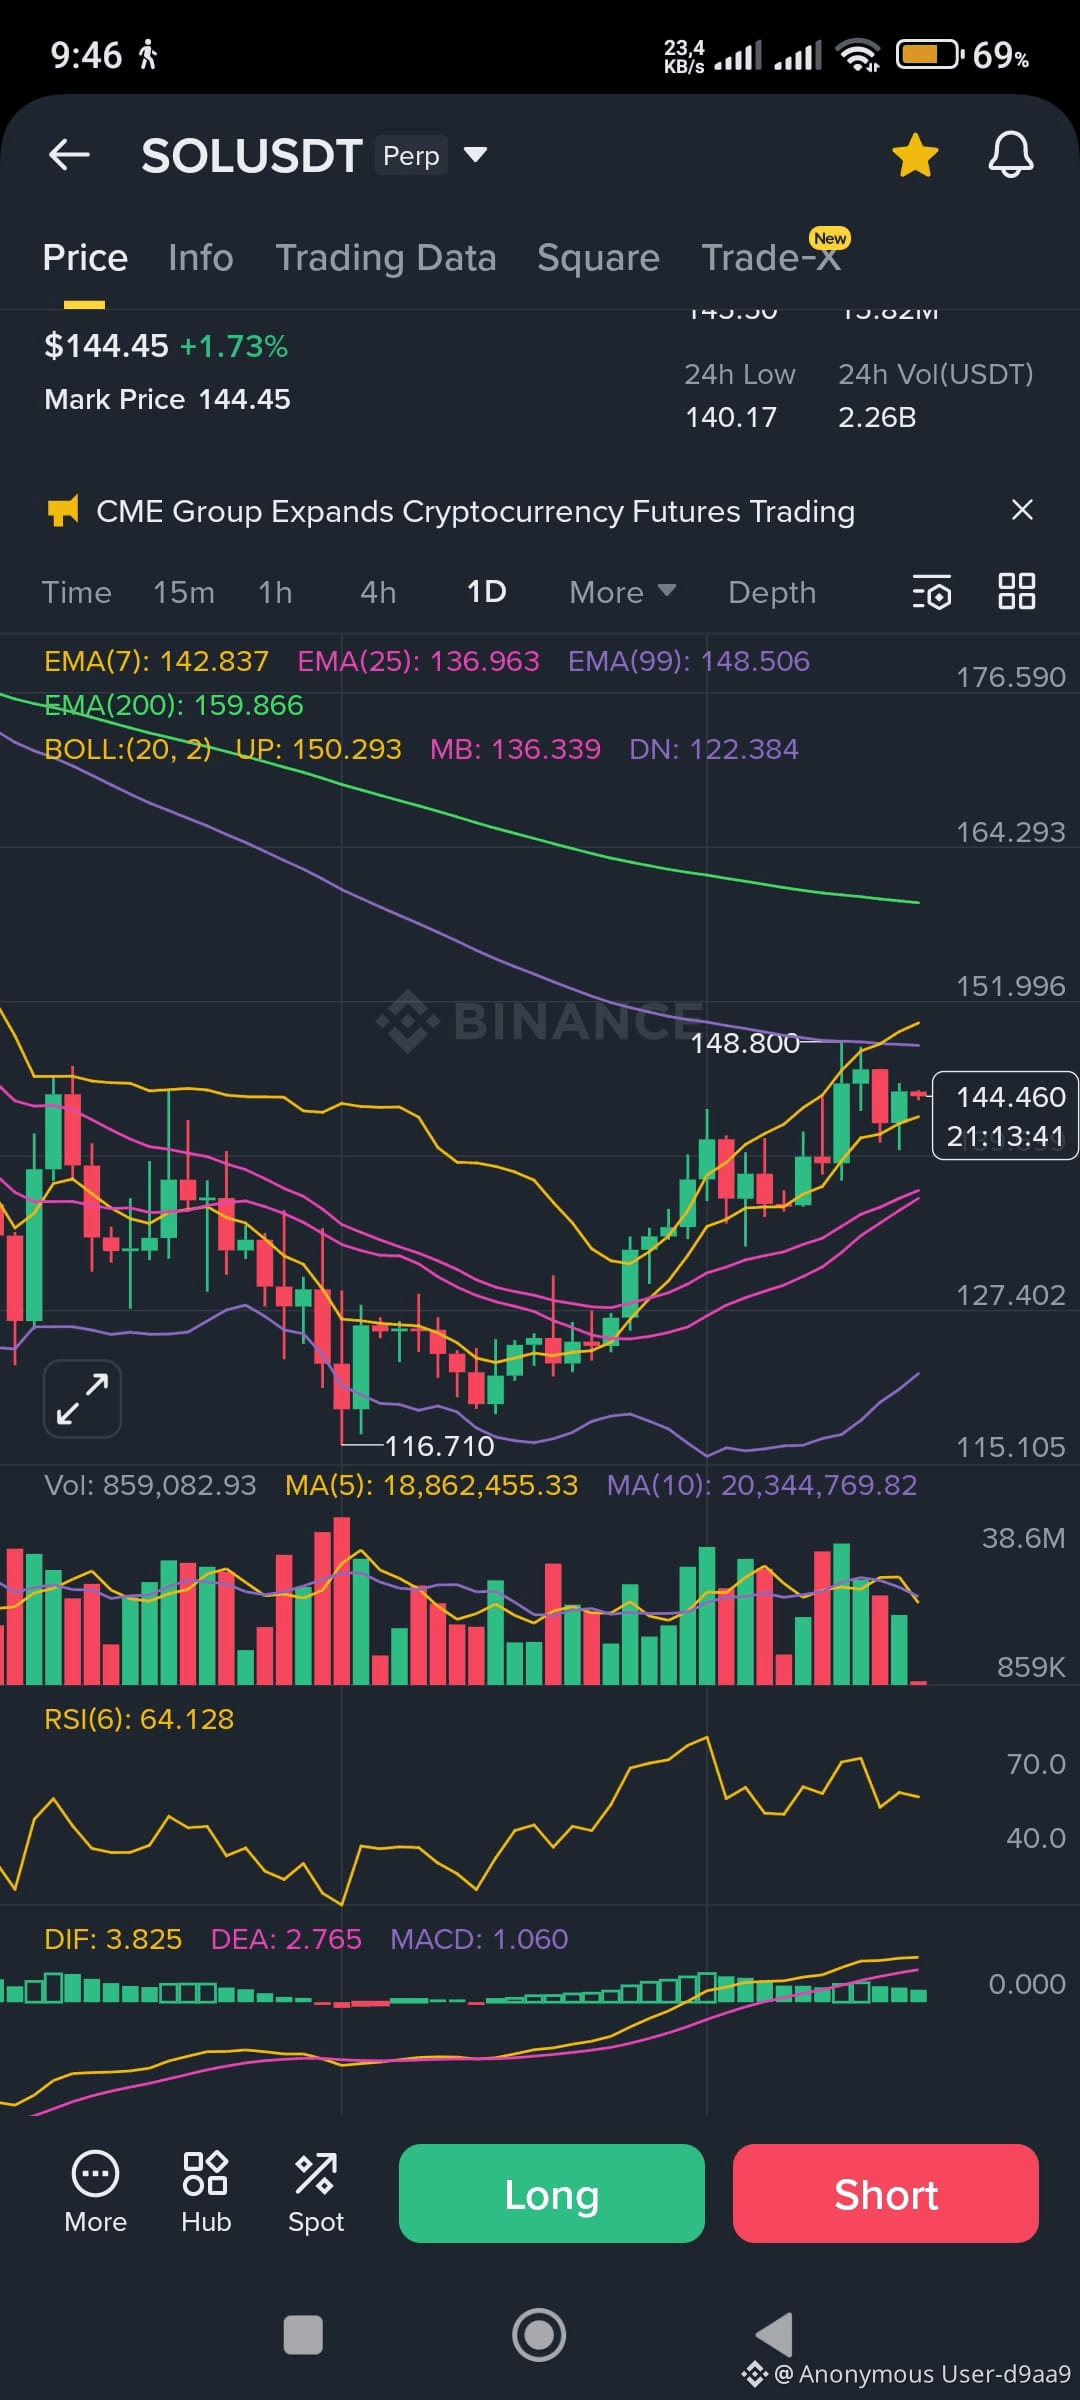
Has the market bottomed yet? Should it be closed?😂
Thị trường tạo đáy xong chưa ae? có nên chốt không? 😂 $BTC $ETH $SOL #USJobsData
Has the market bottomed yet? Should it be closed?😂
Thị trường tạo đáy xong chưa ae? có nên chốt không? 😂 $BTC $ETH $SOL #USJobsData
Thị trường tạo đáy xong chưa ae? có nên chốt không? 😂 $BTC $ETH $SOL #USJobsData
1
7
146
PINNED
عرض الترجمة
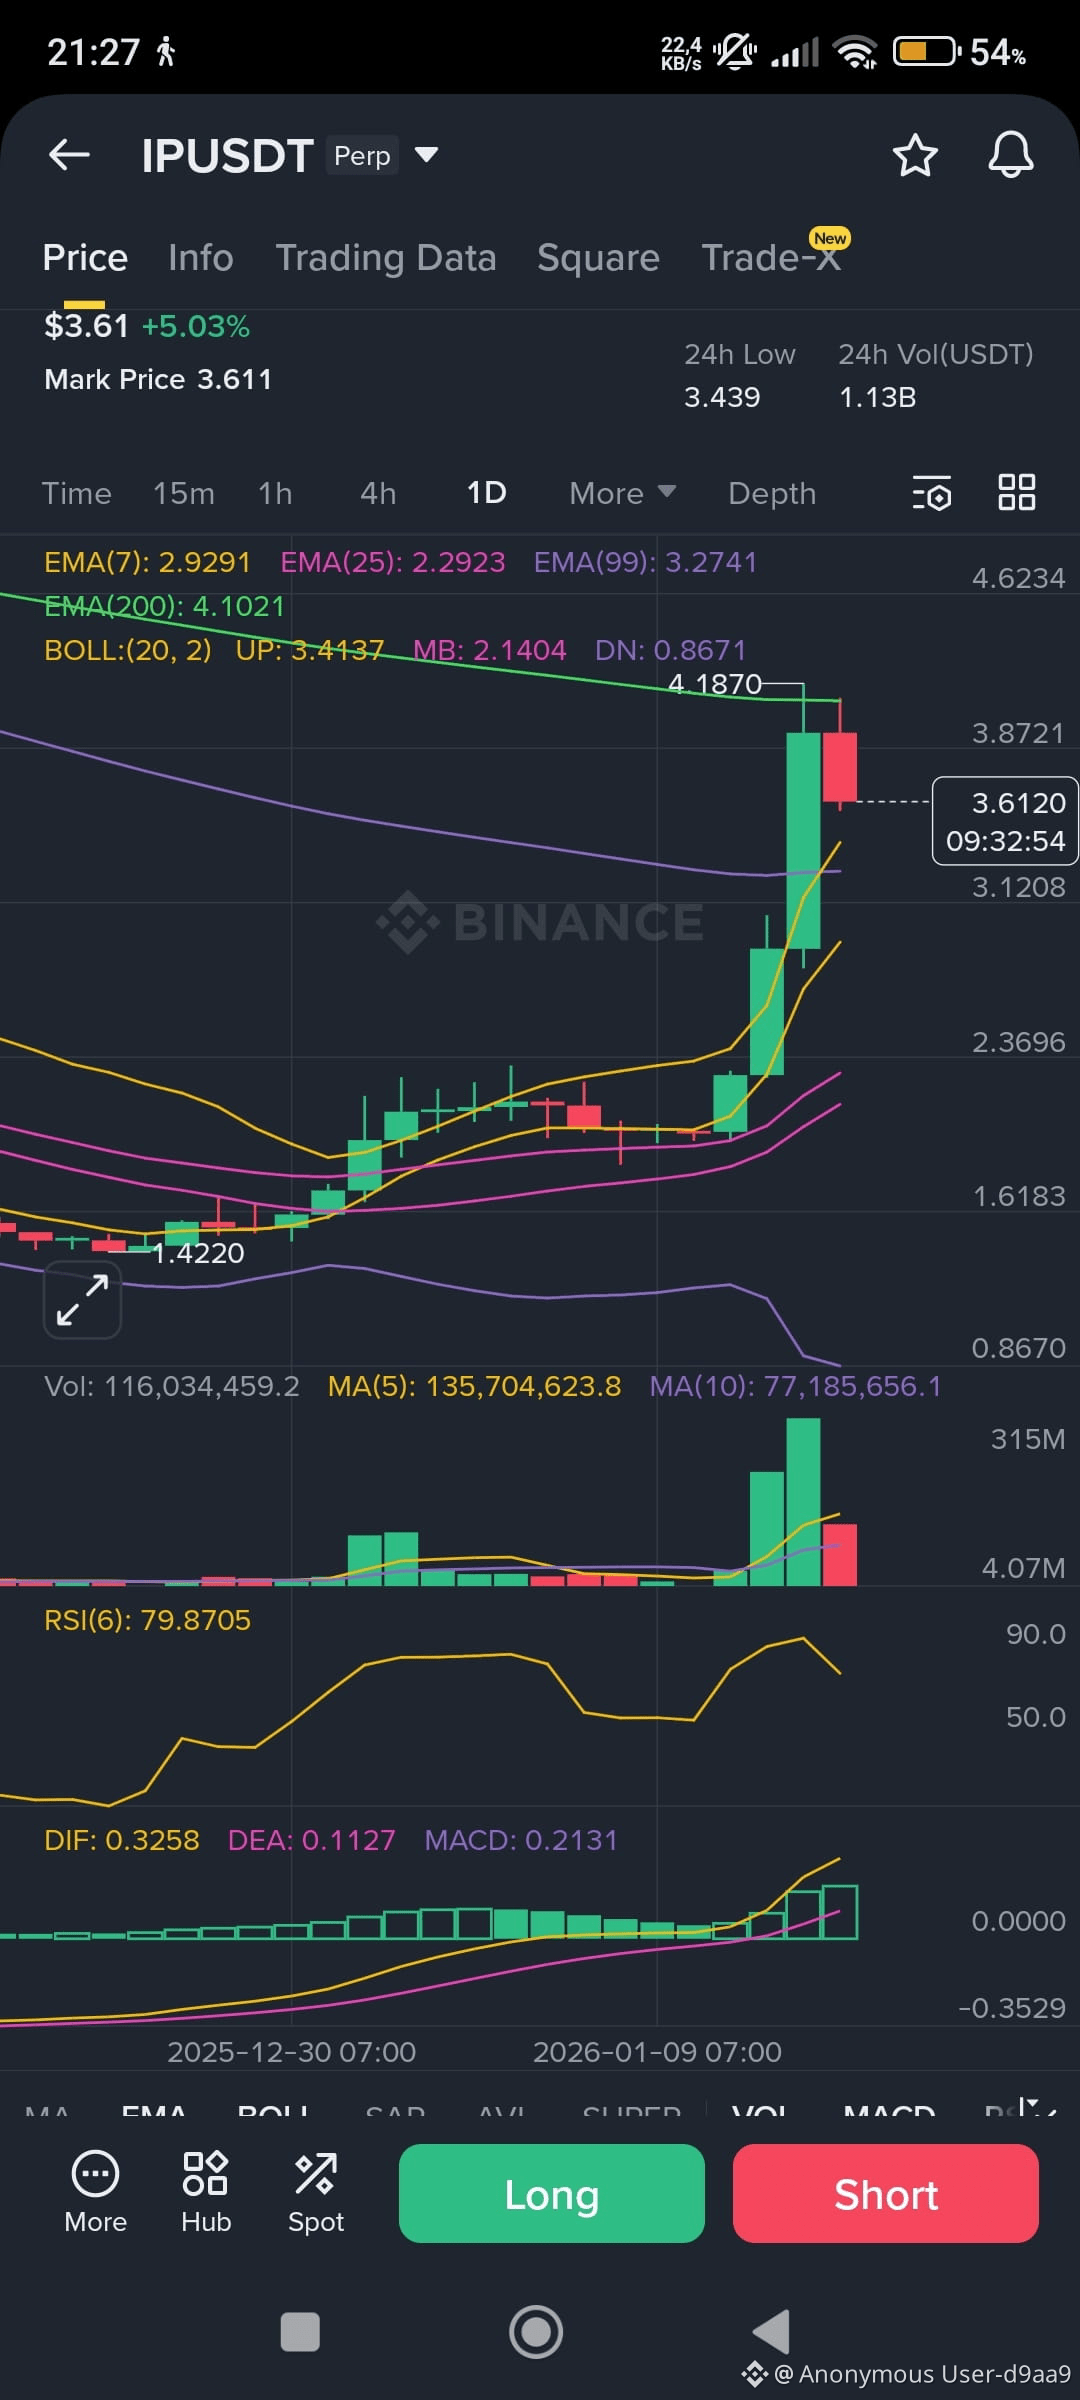
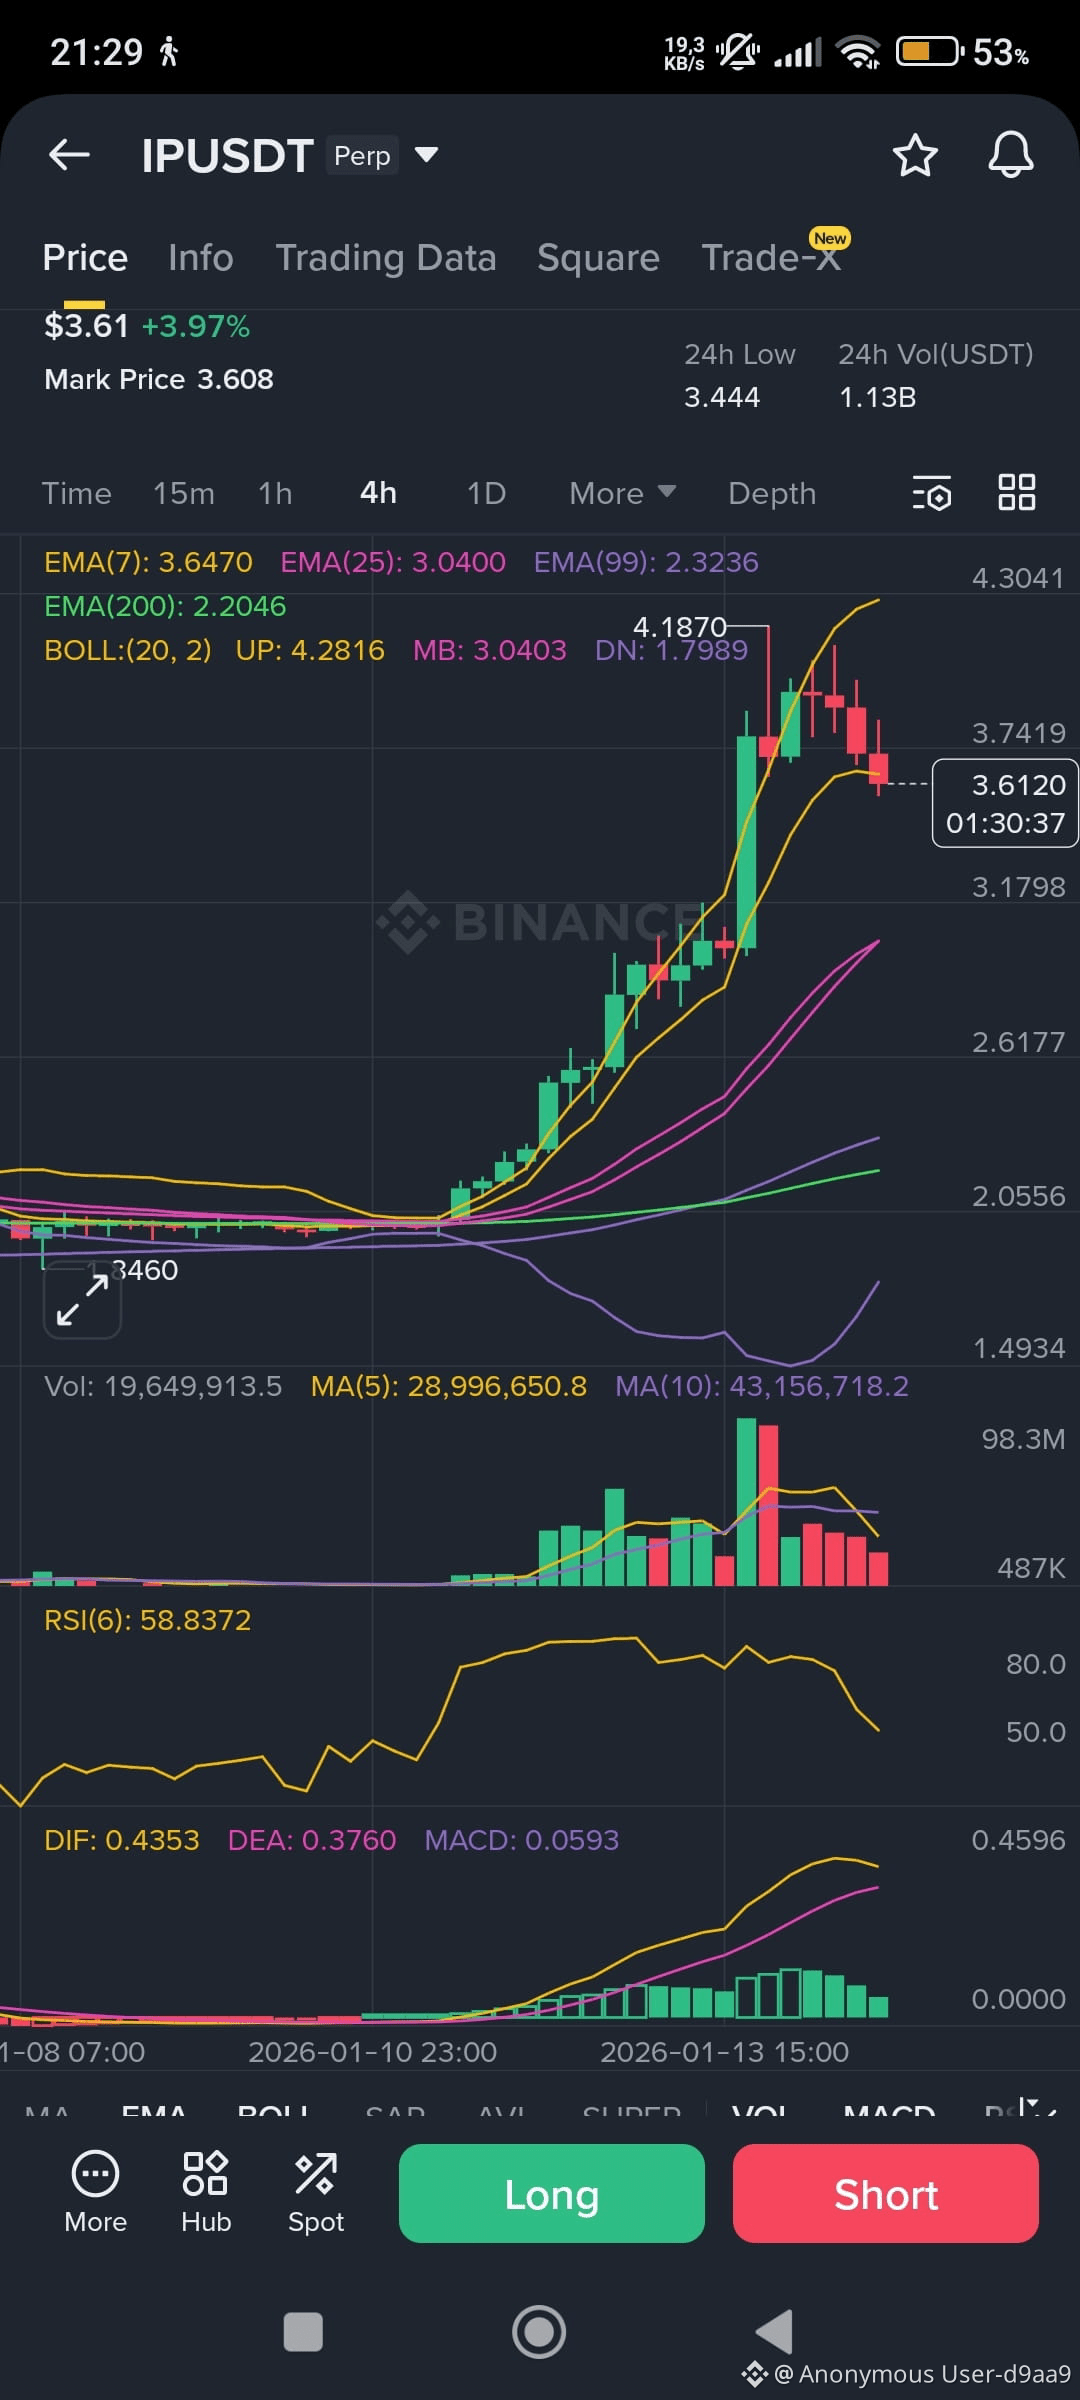
📉 Short $IP – Short-Term Correction Signal
- Current Price: $3.61 (+3.97%)
- Mark Price: $3.608
- 24h Trading Volume: 1.13B USDT
- EMA(7): 3.6470 | EMA(25): 3.0400
- RSI(6): 58.83 → slightly declining from high levels
- MACD: DIF 0.4353 < DEA 0.3760 → weakening momentum
- Bollinger Bands: Price approaching upper band (UP: 4.2816) → likely correction toward MB: 3.0403
- Timestamp: Jan 14, 2026 – 21:30 ICT
🔻 Analysis:
After a strong rally, $IP shows signs of slowing down. RSI is starting to drop, and MACD is narrowing, indicating weakening buying pressure. Price is currently above EMA(7) but may retest the support zone around EMA(25) near 3.04. Bollinger Bands are expanding → high volatility expected.
🎯 Suggested Strategy:
- Short Entry Zone: 3.62–3.66
- DCA Range: 3.68–3.72
- Stop-loss: 3.78
- Targets: 3.40 → 3.20 → 3.00
👉 Tap the chart below to open a Futures position on Binance.
#IPUSDT #short #bearish #technicalanalysis #Binance $IP
{future}(IPUSDT)
📉 Short $IP – Short-Term Correction Signal
- Current Price: $3.61 (+3.97%)
- Mark Price: $3.608
- 24h Trading Volume: 1.13B USDT
- EMA(7): 3.6470 | EMA(25): 3.0400
- RSI(6): 58.83 → slightly declining from high levels
- MACD: DIF 0.4353 < DEA 0.3760 → weakening momentum
- Bollinger Bands: Price approaching upper band (UP: 4.2816) → likely correction toward MB: 3.0403
- Timestamp: Jan 14, 2026 – 21:30 ICT
🔻 Analysis:
After a strong rally, $IP shows signs of slowing down. RSI is starting to drop, and MACD is narrowing, indicating weakening buying pressure. Price is currently above EMA(7) but may retest the support zone around EMA(25) near 3.04. Bollinger Bands are expanding → high volatility expected.
🎯 Suggested Strategy:
- Short Entry Zone: 3.62–3.66
- DCA Range: 3.68–3.72
- Stop-loss: 3.78
- Targets: 3.40 → 3.20 → 3.00
👉 Tap the chart below to open a Futures position on Binance.
#IPUSDT #short #bearish #technicalanalysis #Binance $IP
3
251
·
--
صاعد
عرض الترجمة
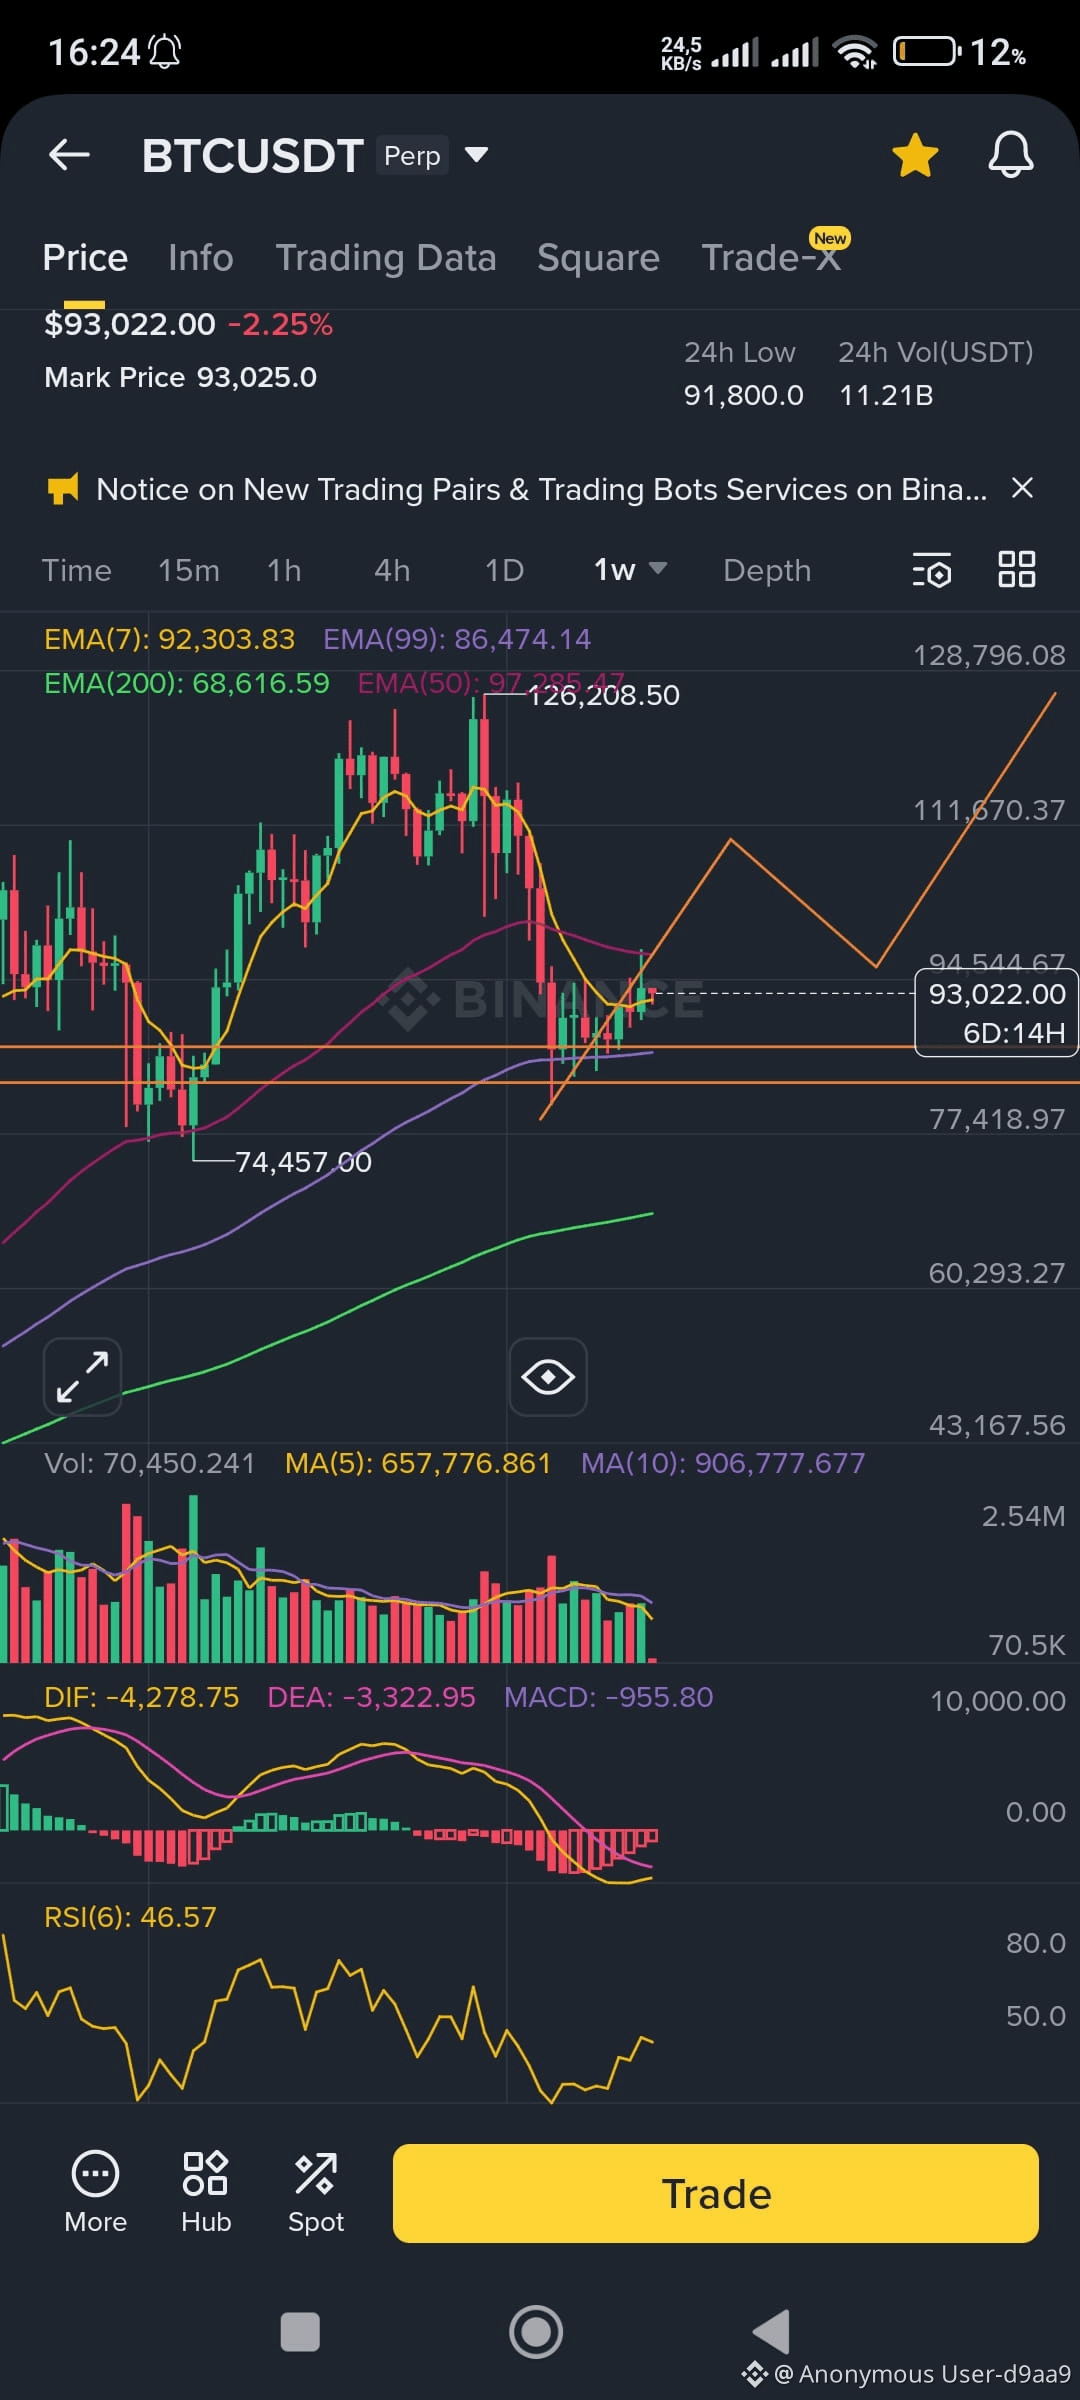
📈 $BTC – Weekly Structure Signals Long-Term Upside
- Current Price: $93,022.00 (−2.25%)
- Mark Price: $93,025.0
- 24h Volume: 11.21B USDT
- EMA(7): 92,303.83 | EMA(50): 97,285.47 | EMA(99): 86,474.14 | EMA(200): 68,616.59
- RSI(6): 46.57 → neutral zone, room for upside
- MACD: DIF −4,278.75 < DEA −3,322.95 → bearish crossover but flattening
- Key Levels: Support at 77,418–74,457 | Resistance at 94,544–111,670
- Timestamp: Jan 19, 2026 – 16:28 ICT
🔺 Analysis:
Despite a short-term dip, $BTC remains structurally bullish on the weekly chart. Price is holding above EMA(99) and approaching EMA(50), with long-term support well above EMA(200). RSI is neutral, suggesting potential for a fresh leg up. MACD is still negative but showing signs of bottoming. If price reclaims 94,500, momentum could shift toward the 111K zone.
🎯 Suggested Strategy:
- Buy Zone: 91,800–93,200
- Stop-loss: 89,500
- Targets: 97,500 → 104,000 → 111,000
#BTCUSDT #long #bullish #Bitcoin #weeklychart #TechnicalAnalysis $BTC
{future}(BTCUSDT)
📈 $BTC – Weekly Structure Signals Long-Term Upside
- Current Price: $93,022.00 (−2.25%)
- Mark Price: $93,025.0
- 24h Volume: 11.21B USDT
- EMA(7): 92,303.83 | EMA(50): 97,285.47 | EMA(99): 86,474.14 | EMA(200): 68,616.59
- RSI(6): 46.57 → neutral zone, room for upside
- MACD: DIF −4,278.75 < DEA −3,322.95 → bearish crossover but flattening
- Key Levels: Support at 77,418–74,457 | Resistance at 94,544–111,670
- Timestamp: Jan 19, 2026 – 16:28 ICT
🔺 Analysis:
Despite a short-term dip, $BTC remains structurally bullish on the weekly chart. Price is holding above EMA(99) and approaching EMA(50), with long-term support well above EMA(200). RSI is neutral, suggesting potential for a fresh leg up. MACD is still negative but showing signs of bottoming. If price reclaims 94,500, momentum could shift toward the 111K zone.
🎯 Suggested Strategy:
- Buy Zone: 91,800–93,200
- Stop-loss: 89,500
- Targets: 97,500 → 104,000 → 111,000
#BTCUSDT #long #bullish #Bitcoin #weeklychart #TechnicalAnalysis $BTC
1
49
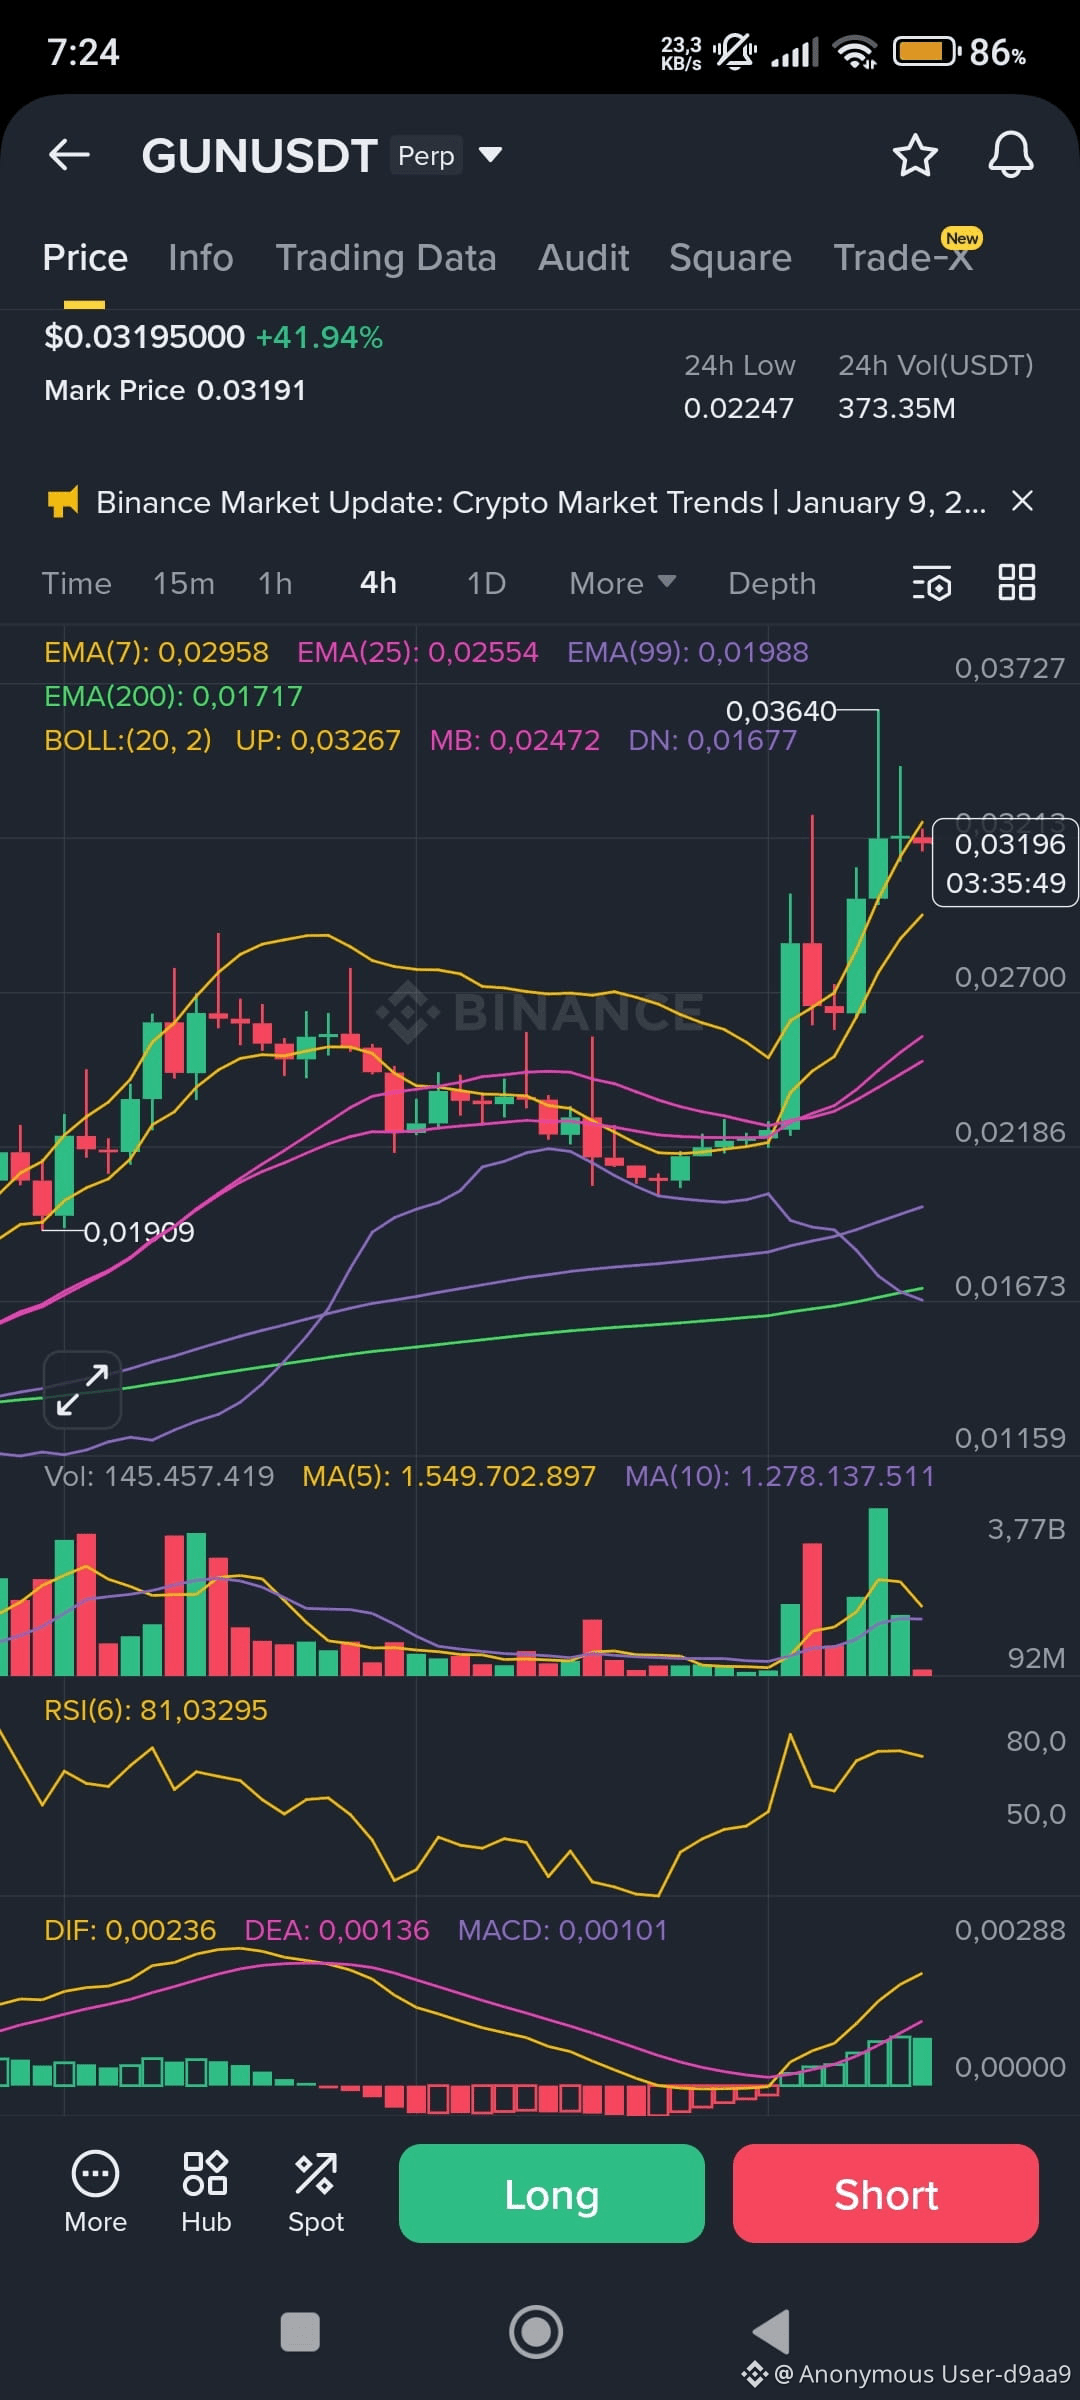
📉 $GUN – ارتفاع مفرط في الموجة، تصحيح قادم
- السعر الحالي: $0.03195 (+41.94%)
- السعر المؤشر: $0.03191
- حجم التداول خلال 24 ساعة: 373.35M USDT
- متوسط أسي(7): 0.02958 | متوسط أسي(25): 0.02554 | متوسط أسي(99): 0.01988 | متوسط أسي(200): 0.01717
- RSI(6): 81.03 → في منطقة المبالغة في الشراء
- MACD: DIF 0.00236 > DEA 0.00136 → صاعد لكنه يتجه نحو التسطح
- نطاق بولينجر: السعر قريب من الحد العلوي (UP: 0.03267) → ارتفاع في التقلبات، احتمال رفض
- التوقيت: 15 يناير 2026 – 07:24 ICT
🔻 التحليل:
ارتفع $GUN بأكثر من 40% في فترة قصيرة، مما دفع RSI فوق 80 والسعر إلى منطقة الحد العلوي لنطاق بولينجر. وعلى الرغم من استمرار الزخم الإيجابي، تظهر علامات على الإرهاق. مخطط MACD يضيق، والسعر يقترب من المقاومة قصيرة الأجل. قد يؤدي الرفض بالقرب من 0.0325 إلى انخفاض مفاجئ نحو متوسط أسي(25) أو الخط الأوسط.
🎯 الاستراتيجية المقترحة:
- منطقة الدخول للبيع: 0.0322–0.0327
- نطاق DCA: 0.0330–0.0335
- وقف الخسارة: 0.0342
- الأهداف: 0.0300 → 0.0280 → 0.0255
👉 اضغط على الرسم البياني أدناه لفتح مركز مستقبلي على بانينس.
#GUNUSDT #short #bearish #technicalanalysis #crypto $GUN
{future}(GUNUSDT)
📉 $GUN – ارتفاع مفرط في الموجة، تصحيح قادم
- السعر الحالي: $0.03195 (+41.94%)
- السعر المؤشر: $0.03191
- حجم التداول خلال 24 ساعة: 373.35M USDT
- متوسط أسي(7): 0.02958 | متوسط أسي(25): 0.02554 | متوسط أسي(99): 0.01988 | متوسط أسي(200): 0.01717
- RSI(6): 81.03 → في منطقة المبالغة في الشراء
- MACD: DIF 0.00236 > DEA 0.00136 → صاعد لكنه يتجه نحو التسطح
- نطاق بولينجر: السعر قريب من الحد العلوي (UP: 0.03267) → ارتفاع في التقلبات، احتمال رفض
- التوقيت: 15 يناير 2026 – 07:24 ICT
🔻 التحليل:
ارتفع $GUN بأكثر من 40% في فترة قصيرة، مما دفع RSI فوق 80 والسعر إلى منطقة الحد العلوي لنطاق بولينجر. وعلى الرغم من استمرار الزخم الإيجابي، تظهر علامات على الإرهاق. مخطط MACD يضيق، والسعر يقترب من المقاومة قصيرة الأجل. قد يؤدي الرفض بالقرب من 0.0325 إلى انخفاض مفاجئ نحو متوسط أسي(25) أو الخط الأوسط.
🎯 الاستراتيجية المقترحة:
- منطقة الدخول للبيع: 0.0322–0.0327
- نطاق DCA: 0.0330–0.0335
- وقف الخسارة: 0.0342
- الأهداف: 0.0300 → 0.0280 → 0.0255
👉 اضغط على الرسم البياني أدناه لفتح مركز مستقبلي على بانينس.
#GUNUSDT #short #bearish #technicalanalysis #crypto $GUN
2
128
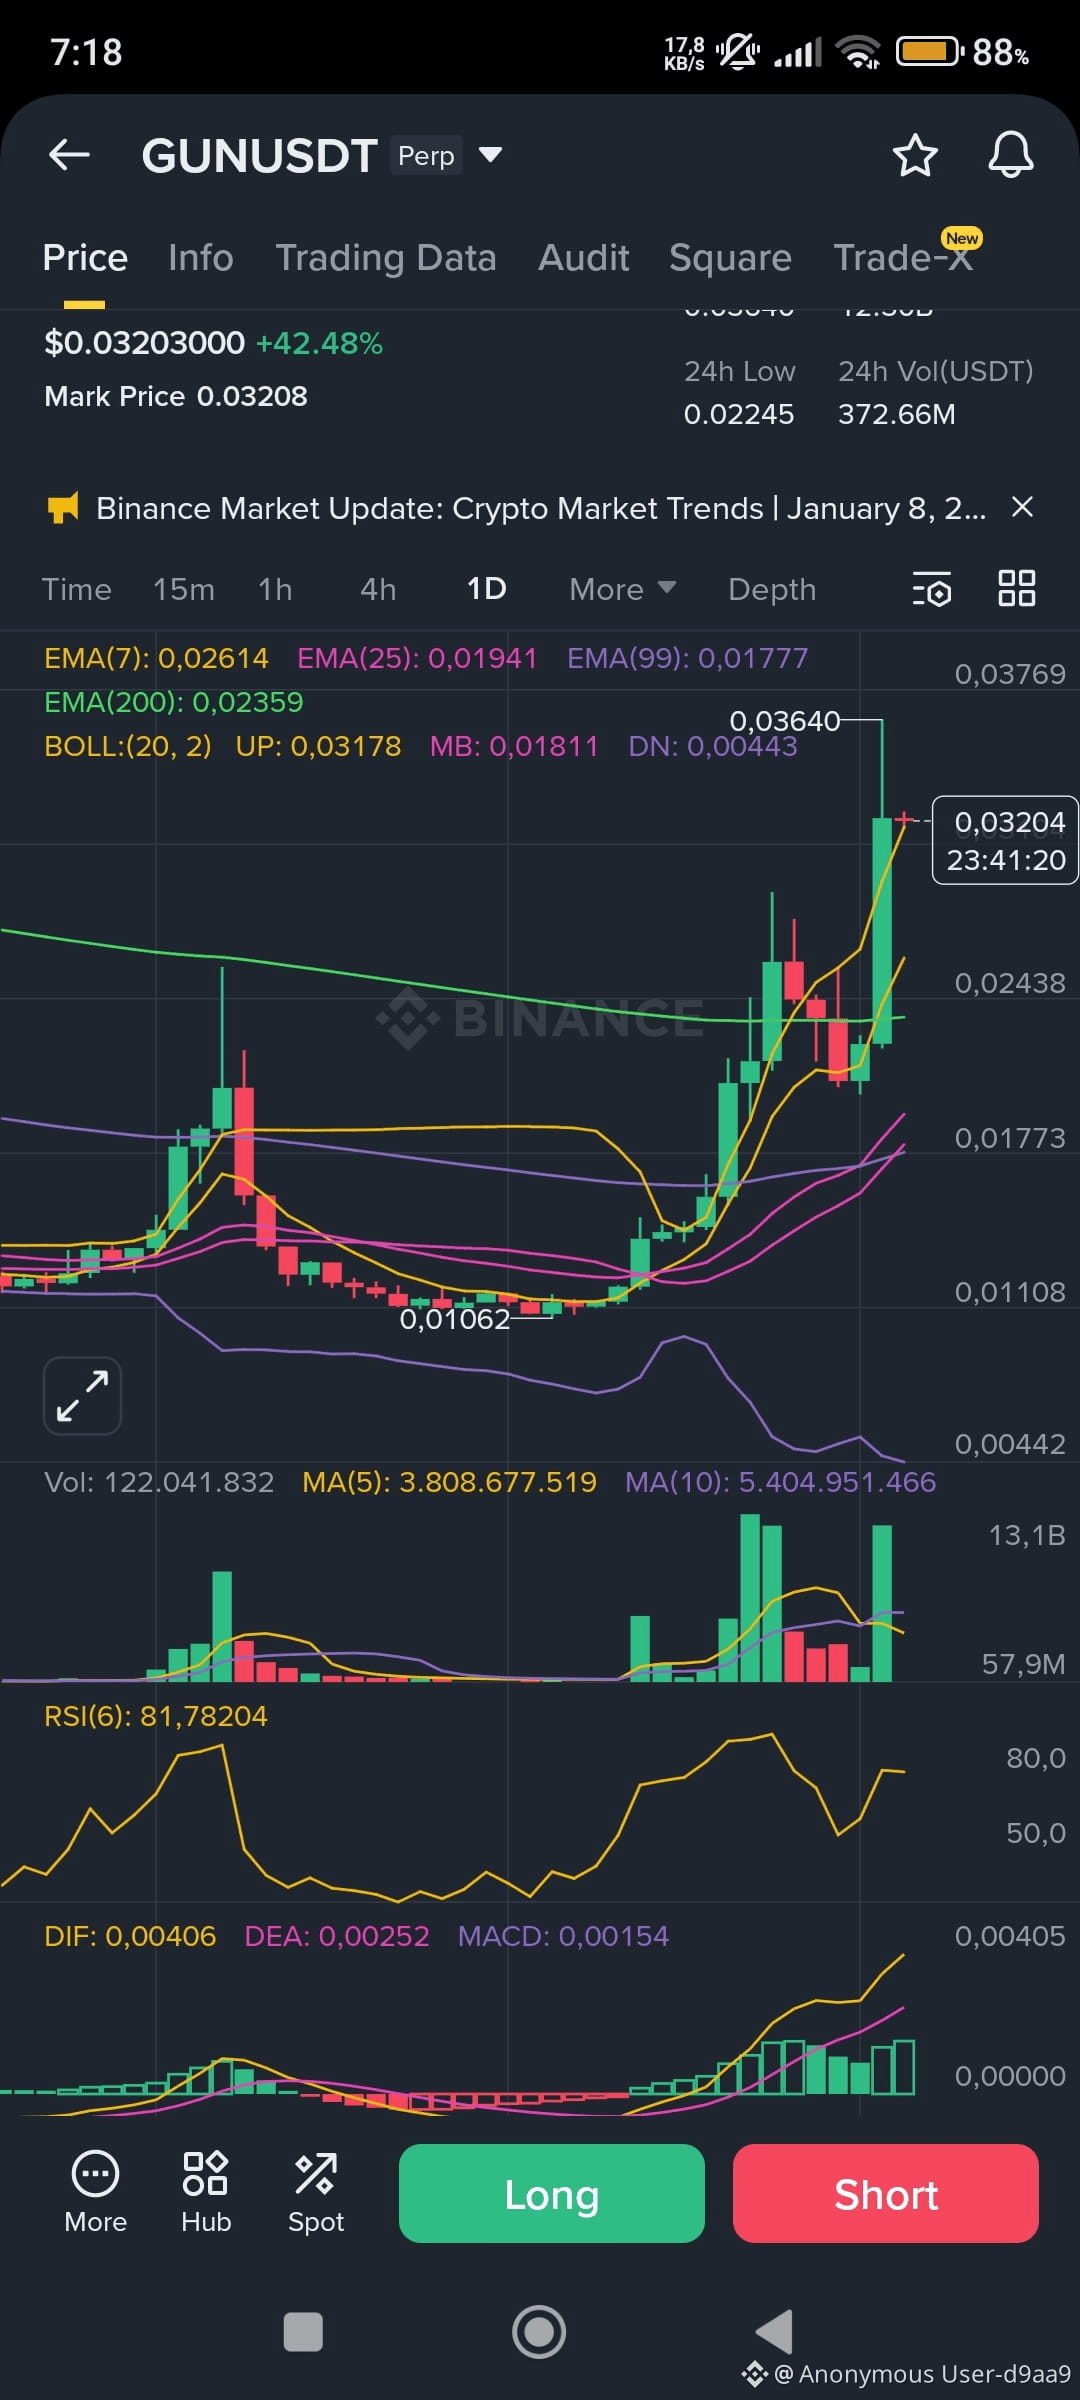
📈 $GUN – انفجار مع زخم قوي
- السعر الحالي: $0.03203 (+42.48%)
- السعر المؤشر: $0.03208
- حجم التداول خلال 24 ساعة: 372.66M USDT
- متوسط متحرك أسي (7): 0.02614 | متوسط متحرك أسي (25): 0.01941 | متوسط متحرك أسي (99): 0.01777 | متوسط متحرك أسي (200): 0.02359
- RSI(6): 81.78 → منطقة فائض شراء، لكن الزخم ما زال قوياً
- MACD: DIF 0.00406 > DEA 0.00252 → تأكيد استمرار الاتجاه الصاعد
- نطاق بولينجر: السعر فوق الحد الأعلى (UP: 0.03178) → تمدد التقلب قيد التنفيذ
- الوقت: 15 يناير 2026 – 07:22 ICT
🔺 التحليل:
انفجر $GUN فوق مستويات المقاومة الرئيسية بزيادة يومية هائلة قدرها 42%. السعر أعلى بكثير من جميع المتوسطات المتحركة الرئيسية، مما يؤكد اتجاهًا صاعدًا قويًا. يقع RSI في المنطقة المفرطة شراء، لكن MACD لا يظهر أي علامات على الانفصال حتى الآن. انفجار السعر فوق حدود نطاق بولينجر العلوي يشير إلى استمرار الحركة، خاصة مع ارتفاع الحجم فوق 370M USDT.
🎯 الاستراتيجية المقترحة:
- منطقة الشراء: 0.0310–0.0325
- وقف الخسارة: 0.0292
- الأهداف: 0.0350 → 0.0380 → 0.0420
👉 اضغط على الرسم البياني أدناه لفتح مركز مستقبلي على بانينس.
#gunusdt #bullish #long #breakout #technicalanalysis #crypto $GUN
{future}(GUNUSDT)
📈 $GUN – انفجار مع زخم قوي
- السعر الحالي: $0.03203 (+42.48%)
- السعر المؤشر: $0.03208
- حجم التداول خلال 24 ساعة: 372.66M USDT
- متوسط متحرك أسي (7): 0.02614 | متوسط متحرك أسي (25): 0.01941 | متوسط متحرك أسي (99): 0.01777 | متوسط متحرك أسي (200): 0.02359
- RSI(6): 81.78 → منطقة فائض شراء، لكن الزخم ما زال قوياً
- MACD: DIF 0.00406 > DEA 0.00252 → تأكيد استمرار الاتجاه الصاعد
- نطاق بولينجر: السعر فوق الحد الأعلى (UP: 0.03178) → تمدد التقلب قيد التنفيذ
- الوقت: 15 يناير 2026 – 07:22 ICT
🔺 التحليل:
انفجر $GUN فوق مستويات المقاومة الرئيسية بزيادة يومية هائلة قدرها 42%. السعر أعلى بكثير من جميع المتوسطات المتحركة الرئيسية، مما يؤكد اتجاهًا صاعدًا قويًا. يقع RSI في المنطقة المفرطة شراء، لكن MACD لا يظهر أي علامات على الانفصال حتى الآن. انفجار السعر فوق حدود نطاق بولينجر العلوي يشير إلى استمرار الحركة، خاصة مع ارتفاع الحجم فوق 370M USDT.
🎯 الاستراتيجية المقترحة:
- منطقة الشراء: 0.0310–0.0325
- وقف الخسارة: 0.0292
- الأهداف: 0.0350 → 0.0380 → 0.0420
👉 اضغط على الرسم البياني أدناه لفتح مركز مستقبلي على بانينس.
#gunusdt #bullish #long #breakout #technicalanalysis #crypto $GUN
2
119
عرض الترجمة
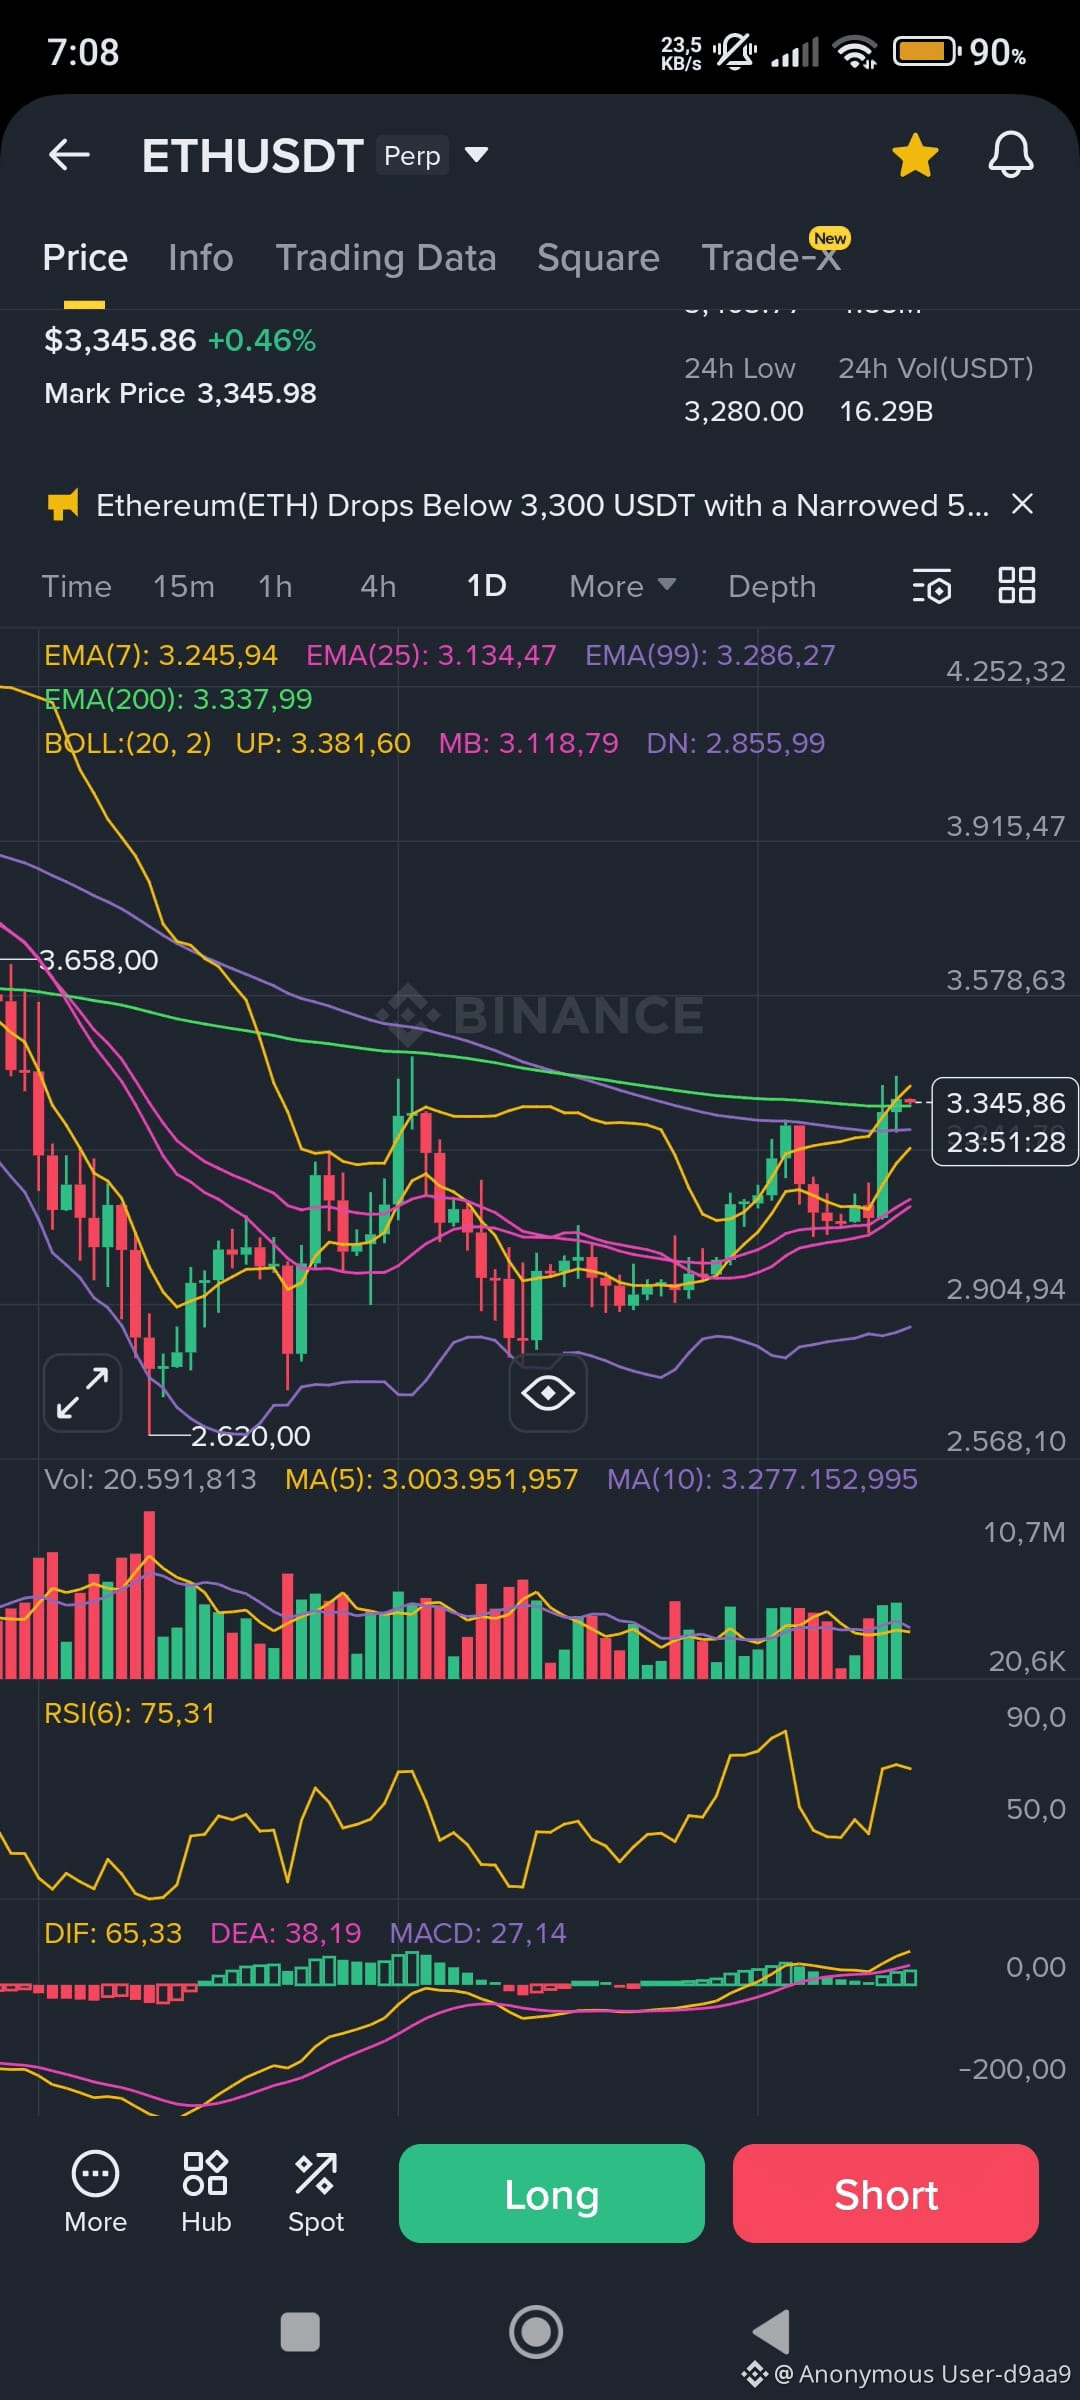
📉 $ETH – Overbought Zone, Reversal Risk Ahead
- Current Price: $3,345.86 (+0.46%)
- Mark Price: $3,345.98
- 24h Volume: 16.29B USDT
- EMA(7): 3,245.94 | EMA(25): 3,134.47 | EMA(99): 3,286.27 | EMA(200): 3,337.99
- RSI(6): 75.31 → firmly in overbought territory
- MACD: DIF 65.33 > DEA 38.19 → bullish but flattening
- Bollinger Bands: Price near upper band (UP: 3,381.60) → volatility spike, potential rejection
- Timestamp: Jan 15, 2026 – 07:09 ICT
🔻 Analysis:
$ETH is showing signs of exhaustion after a steady climb. RSI above 75 suggests overbought conditions, and price is hovering near the upper Bollinger Band and EMA(200), a strong resistance zone. MACD histogram is narrowing, indicating weakening momentum. A short-term pullback toward EMA(99) or MB could be imminent if bulls fail to push through $3,380.
🎯 Suggested Strategy:
- Short Entry Zone: 3,350–3,380
- DCA Range: 3,385–3,410
- Stop-loss: 3,435
- Targets: 3,280 → 3,200 → 3,120
👉 Tap the chart below to open a Futures position on Binance.
#ETHUSDT #short #BearishTrend #Ethereum #TechnicalAnalysis #crypto
{future}(BTCUSDT)
{future}(ETHUSDT)
{future}(BNBUSDT)
📉 $ETH – Overbought Zone, Reversal Risk Ahead
- Current Price: $3,345.86 (+0.46%)
- Mark Price: $3,345.98
- 24h Volume: 16.29B USDT
- EMA(7): 3,245.94 | EMA(25): 3,134.47 | EMA(99): 3,286.27 | EMA(200): 3,337.99
- RSI(6): 75.31 → firmly in overbought territory
- MACD: DIF 65.33 > DEA 38.19 → bullish but flattening
- Bollinger Bands: Price near upper band (UP: 3,381.60) → volatility spike, potential rejection
- Timestamp: Jan 15, 2026 – 07:09 ICT
🔻 Analysis:
$ETH is showing signs of exhaustion after a steady climb. RSI above 75 suggests overbought conditions, and price is hovering near the upper Bollinger Band and EMA(200), a strong resistance zone. MACD histogram is narrowing, indicating weakening momentum. A short-term pullback toward EMA(99) or MB could be imminent if bulls fail to push through $3,380.
🎯 Suggested Strategy:
- Short Entry Zone: 3,350–3,380
- DCA Range: 3,385–3,410
- Stop-loss: 3,435
- Targets: 3,280 → 3,200 → 3,120
👉 Tap the chart below to open a Futures position on Binance.
#ETHUSDT #short #BearishTrend #Ethereum #TechnicalAnalysis #crypto
2
141
عرض الترجمة
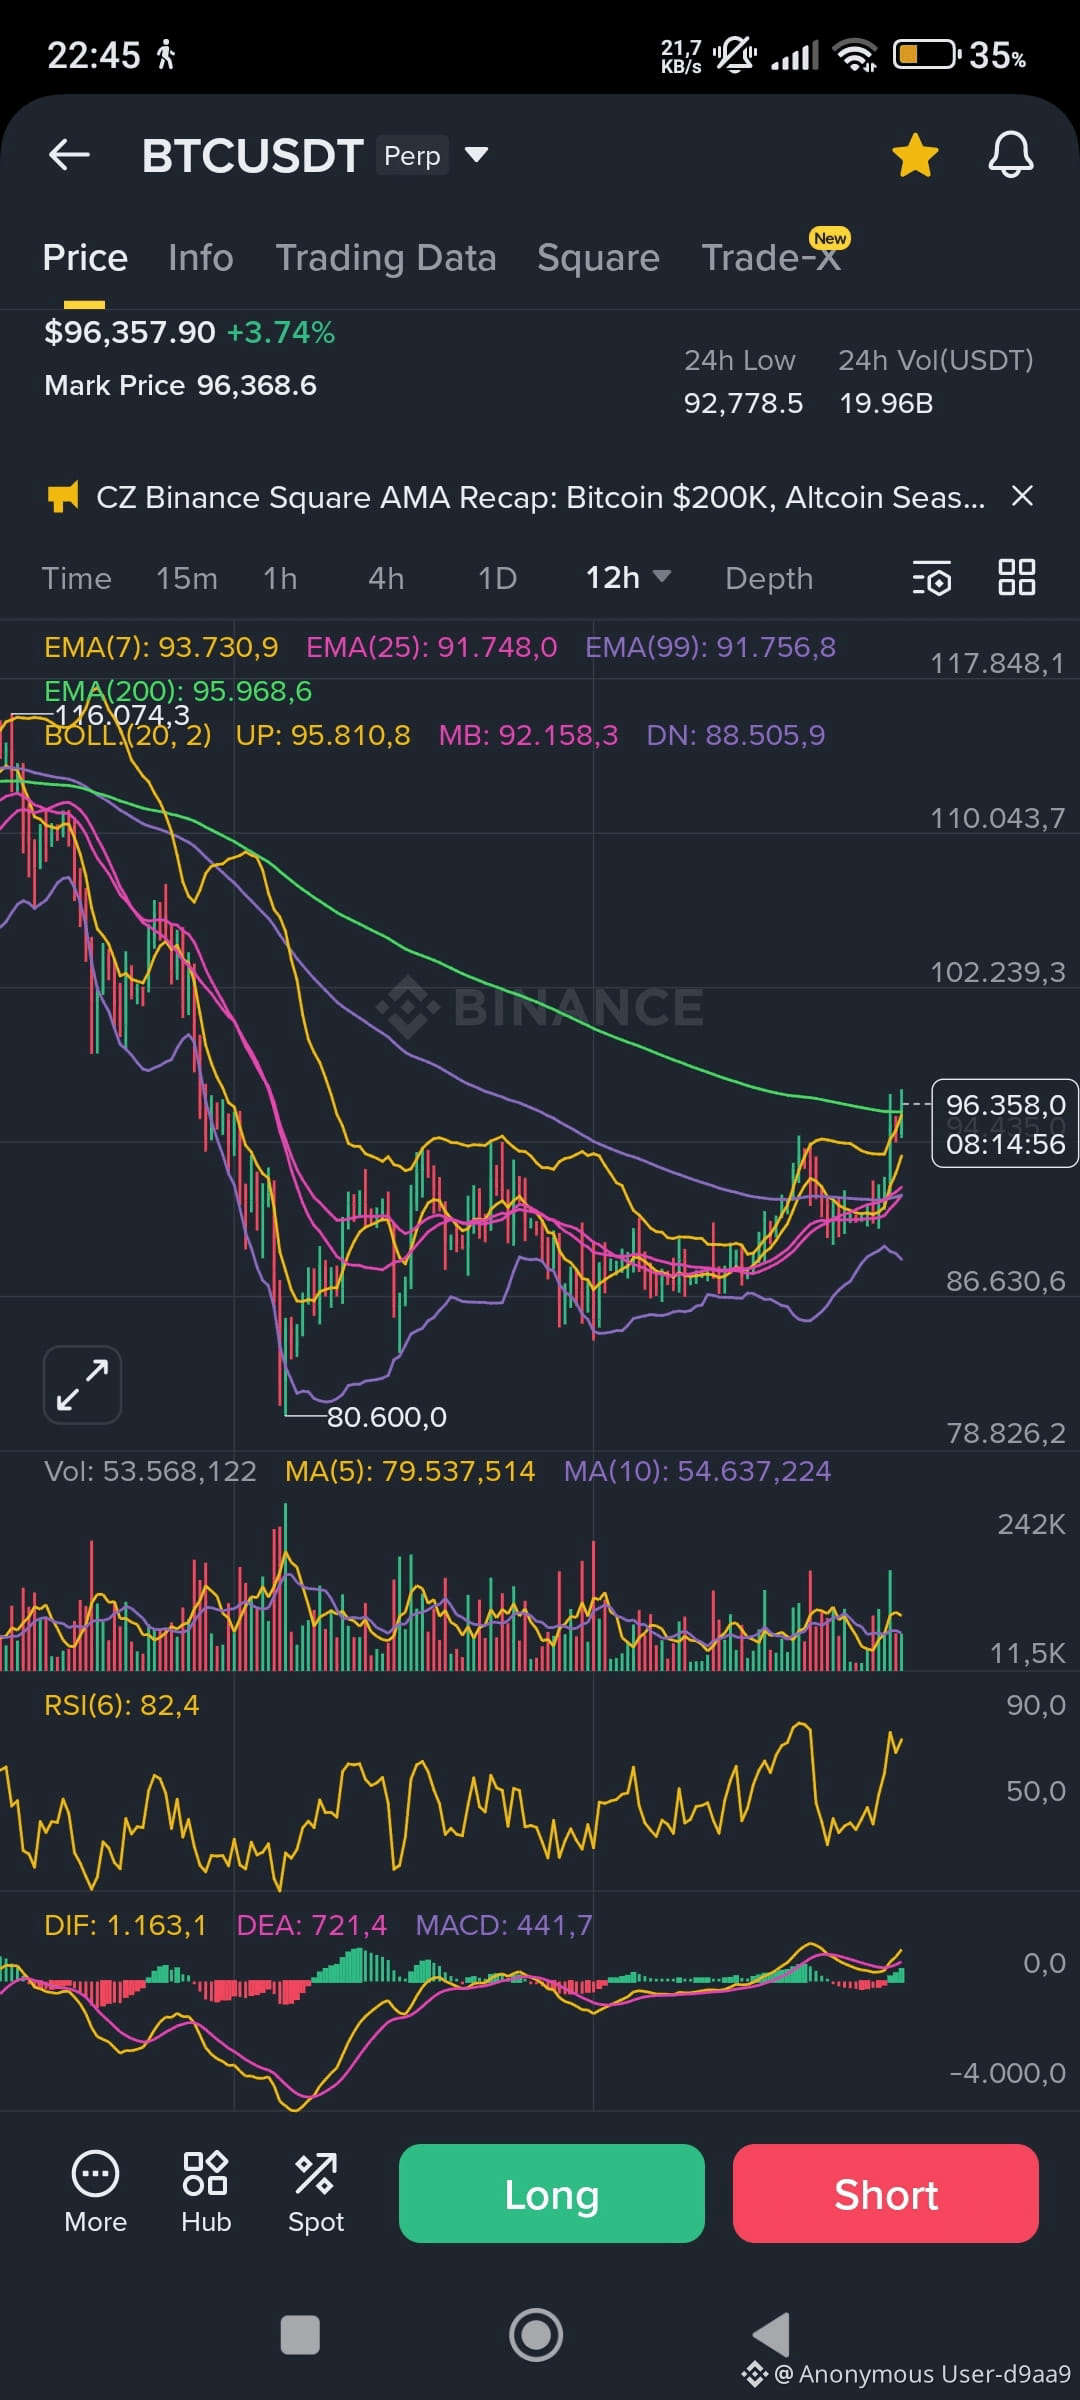
📉 $BTC – Overheated Rally, Pullback Likely
- Current Price: $96,357.90 (+3.74%)
- Mark Price: $96,368.6
- 24h Volume: 19.96B USDT
- EMA(7): 93,730.9 | EMA(25): 91,748.0 | EMA(99): 91,756.8 | EMA(200): 95,968.6
- RSI(6): 82.4 → deep in overbought territory
- MACD: DIF 1,163.1 > DEA 721.4 → bullish but flattening
- Bollinger Bands: Price above upper band (UP: 95,810.8) → volatility spike, possible reversal
- Timestamp: Jan 14, 2026 – 22:46 ICT
🔻 Analysis:
$BTC has rallied aggressively, pushing RSI above 80 and price beyond the upper Bollinger Band. While momentum remains positive, signs of exhaustion are emerging. MACD histogram is narrowing, and price is nearing EMA(200), a potential resistance zone. A short-term correction or consolidation is likely before any sustained move toward $100K.
🎯 Suggested Strategy:
- Short Entry Zone: 96,500–97,200
- DCA Range: 97,300–97,800
- Stop-loss: 98,500
- Targets: 94,800 → 93,000 → 91,200
#BTCUSDT #short #bearish #Bitcoin #technicalanalysis #crypto #BTC100kNext? $BTC
{future}(BTCUSDT)
📉 $BTC – Overheated Rally, Pullback Likely
- Current Price: $96,357.90 (+3.74%)
- Mark Price: $96,368.6
- 24h Volume: 19.96B USDT
- EMA(7): 93,730.9 | EMA(25): 91,748.0 | EMA(99): 91,756.8 | EMA(200): 95,968.6
- RSI(6): 82.4 → deep in overbought territory
- MACD: DIF 1,163.1 > DEA 721.4 → bullish but flattening
- Bollinger Bands: Price above upper band (UP: 95,810.8) → volatility spike, possible reversal
- Timestamp: Jan 14, 2026 – 22:46 ICT
🔻 Analysis:
$BTC has rallied aggressively, pushing RSI above 80 and price beyond the upper Bollinger Band. While momentum remains positive, signs of exhaustion are emerging. MACD histogram is narrowing, and price is nearing EMA(200), a potential resistance zone. A short-term correction or consolidation is likely before any sustained move toward $100K.
🎯 Suggested Strategy:
- Short Entry Zone: 96,500–97,200
- DCA Range: 97,300–97,800
- Stop-loss: 98,500
- Targets: 94,800 → 93,000 → 91,200
#BTCUSDT #short #bearish #Bitcoin #technicalanalysis #crypto #BTC100kNext? $BTC
1
62
عرض الترجمة
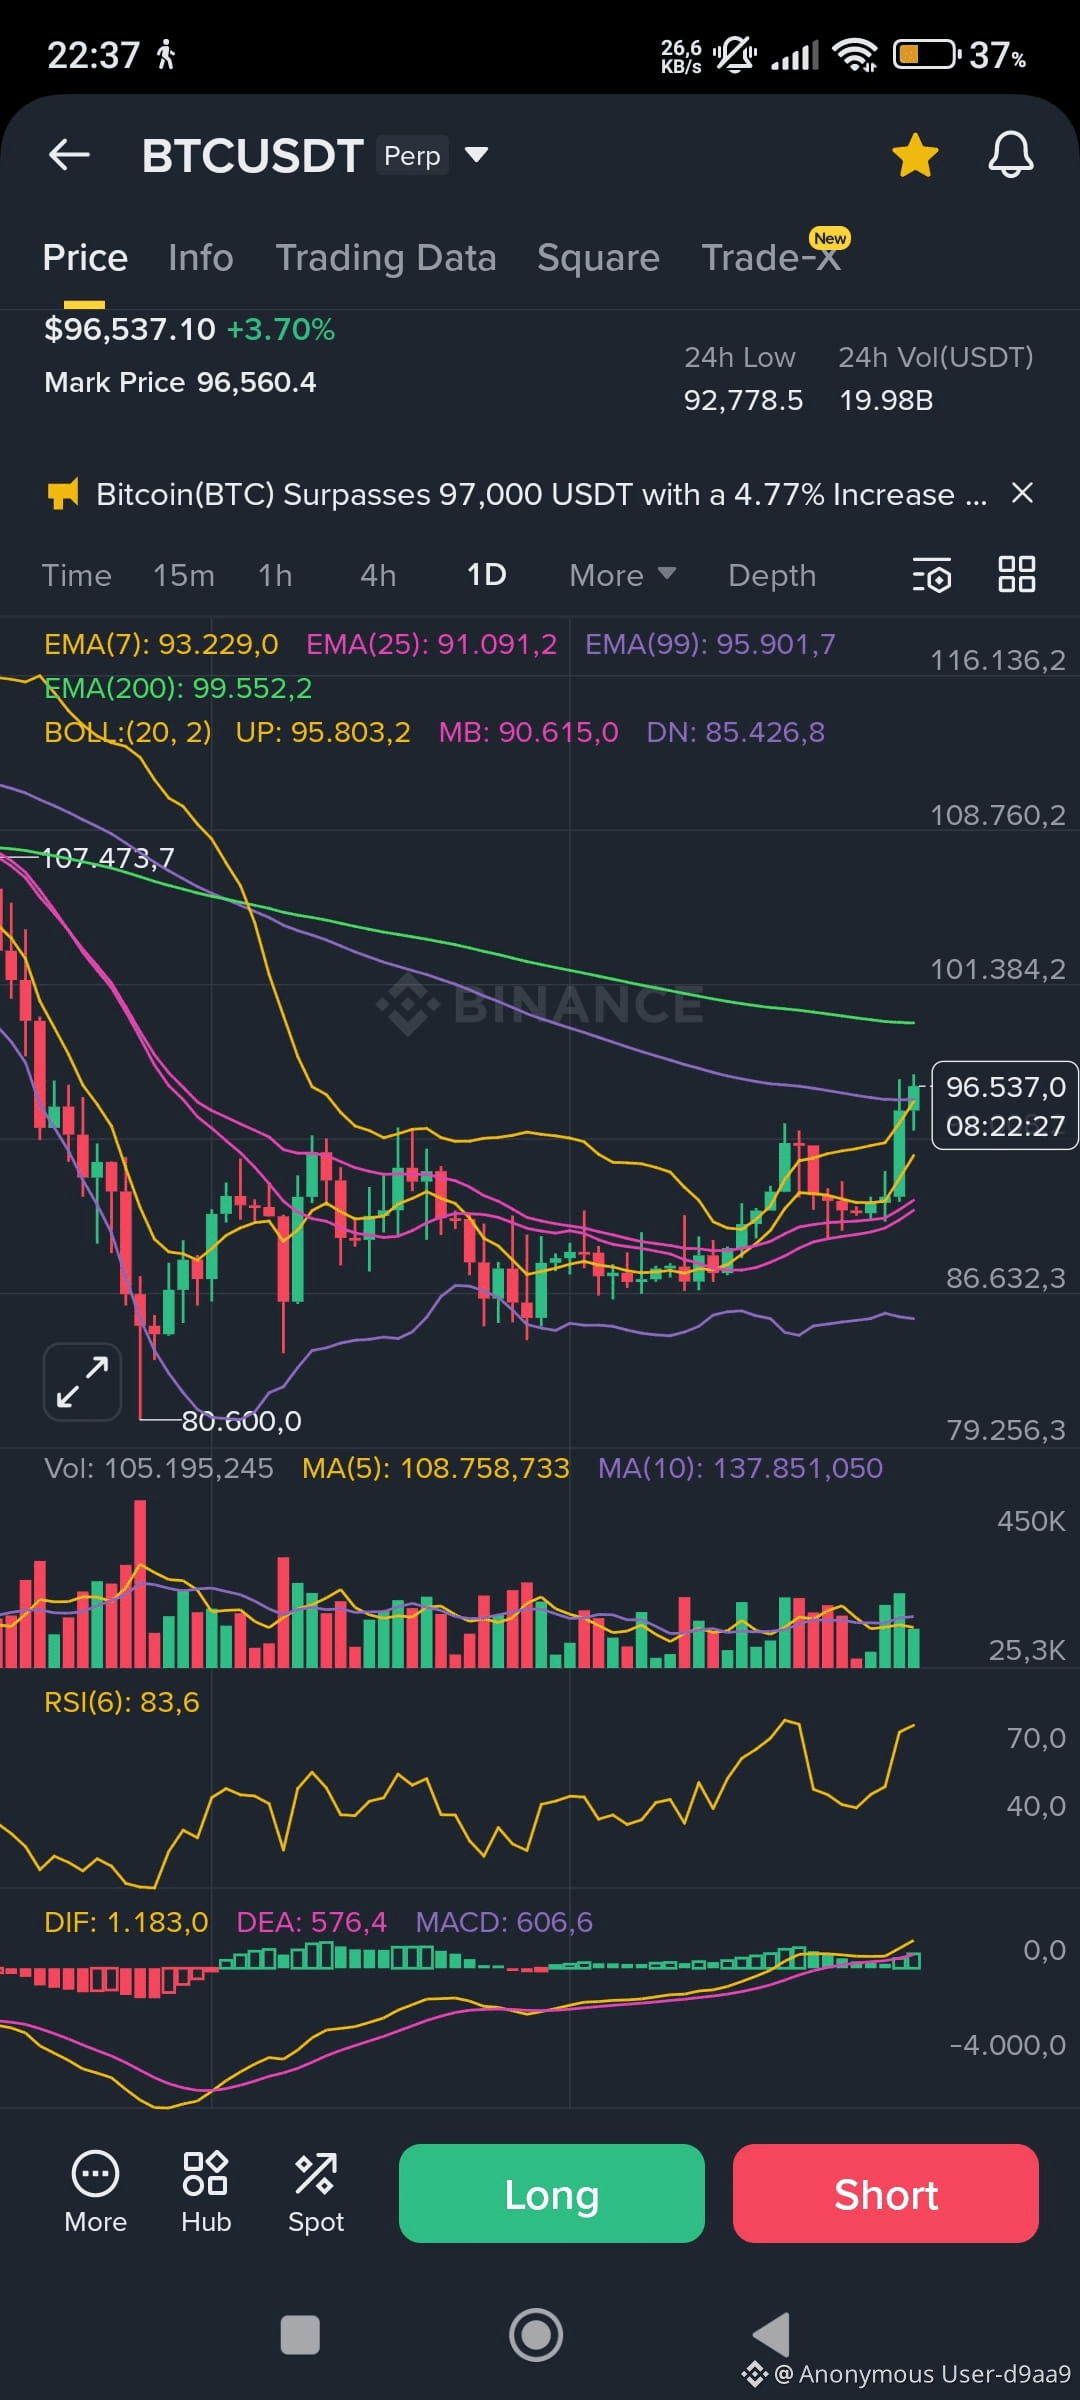
📈 $BTC – Momentum Builds Toward $100K
- Current Price: $96,537.10 (+3.70%)
- Mark Price: $96,560.4
- 24h Volume: 19.98B USDT
- EMA(7): 93,229.0 | EMA(25): 91,091.2 | EMA(99): 95,901.7 | EMA(200): 99,552.2
- RSI(6): 83.6 → overbought zone, but trend remains strong
- MACD: DIF 1,183.0 > DEA 576.4 → bullish momentum accelerating
- Bollinger Bands: Price above upper band (UP: 95,803.2) → breakout confirmed
- Timestamp: Jan 14, 2026 – 22:38 ICT
🔺 Analysis:
$BTC is pushing toward the psychological $100K level after breaking above key resistance zones. RSI is deep in overbought territory, but MACD shows strong divergence and volume is surging. Price is holding above EMA(99), and the Bollinger Band breakout suggests continuation. If momentum sustains, BTC could test the 99,552–100,000 zone soon.
🎯 Suggested Strategy:
- Buy Zone: 95,800–96,600
- Stop-loss: 94,200
- Targets: 98,800 → 100,500 → 103,000
#BTCUSDT #bullish #LONG✅ #bitcoin #technicalanalysis #crypto $BTC
{future}(BTCUSDT)
📈 $BTC – Momentum Builds Toward $100K
- Current Price: $96,537.10 (+3.70%)
- Mark Price: $96,560.4
- 24h Volume: 19.98B USDT
- EMA(7): 93,229.0 | EMA(25): 91,091.2 | EMA(99): 95,901.7 | EMA(200): 99,552.2
- RSI(6): 83.6 → overbought zone, but trend remains strong
- MACD: DIF 1,183.0 > DEA 576.4 → bullish momentum accelerating
- Bollinger Bands: Price above upper band (UP: 95,803.2) → breakout confirmed
- Timestamp: Jan 14, 2026 – 22:38 ICT
🔺 Analysis:
$BTC is pushing toward the psychological $100K level after breaking above key resistance zones. RSI is deep in overbought territory, but MACD shows strong divergence and volume is surging. Price is holding above EMA(99), and the Bollinger Band breakout suggests continuation. If momentum sustains, BTC could test the 99,552–100,000 zone soon.
🎯 Suggested Strategy:
- Buy Zone: 95,800–96,600
- Stop-loss: 94,200
- Targets: 98,800 → 100,500 → 103,000
#BTCUSDT #bullish #LONG✅ #bitcoin #technicalanalysis #crypto $BTC
1
16
عرض الترجمة
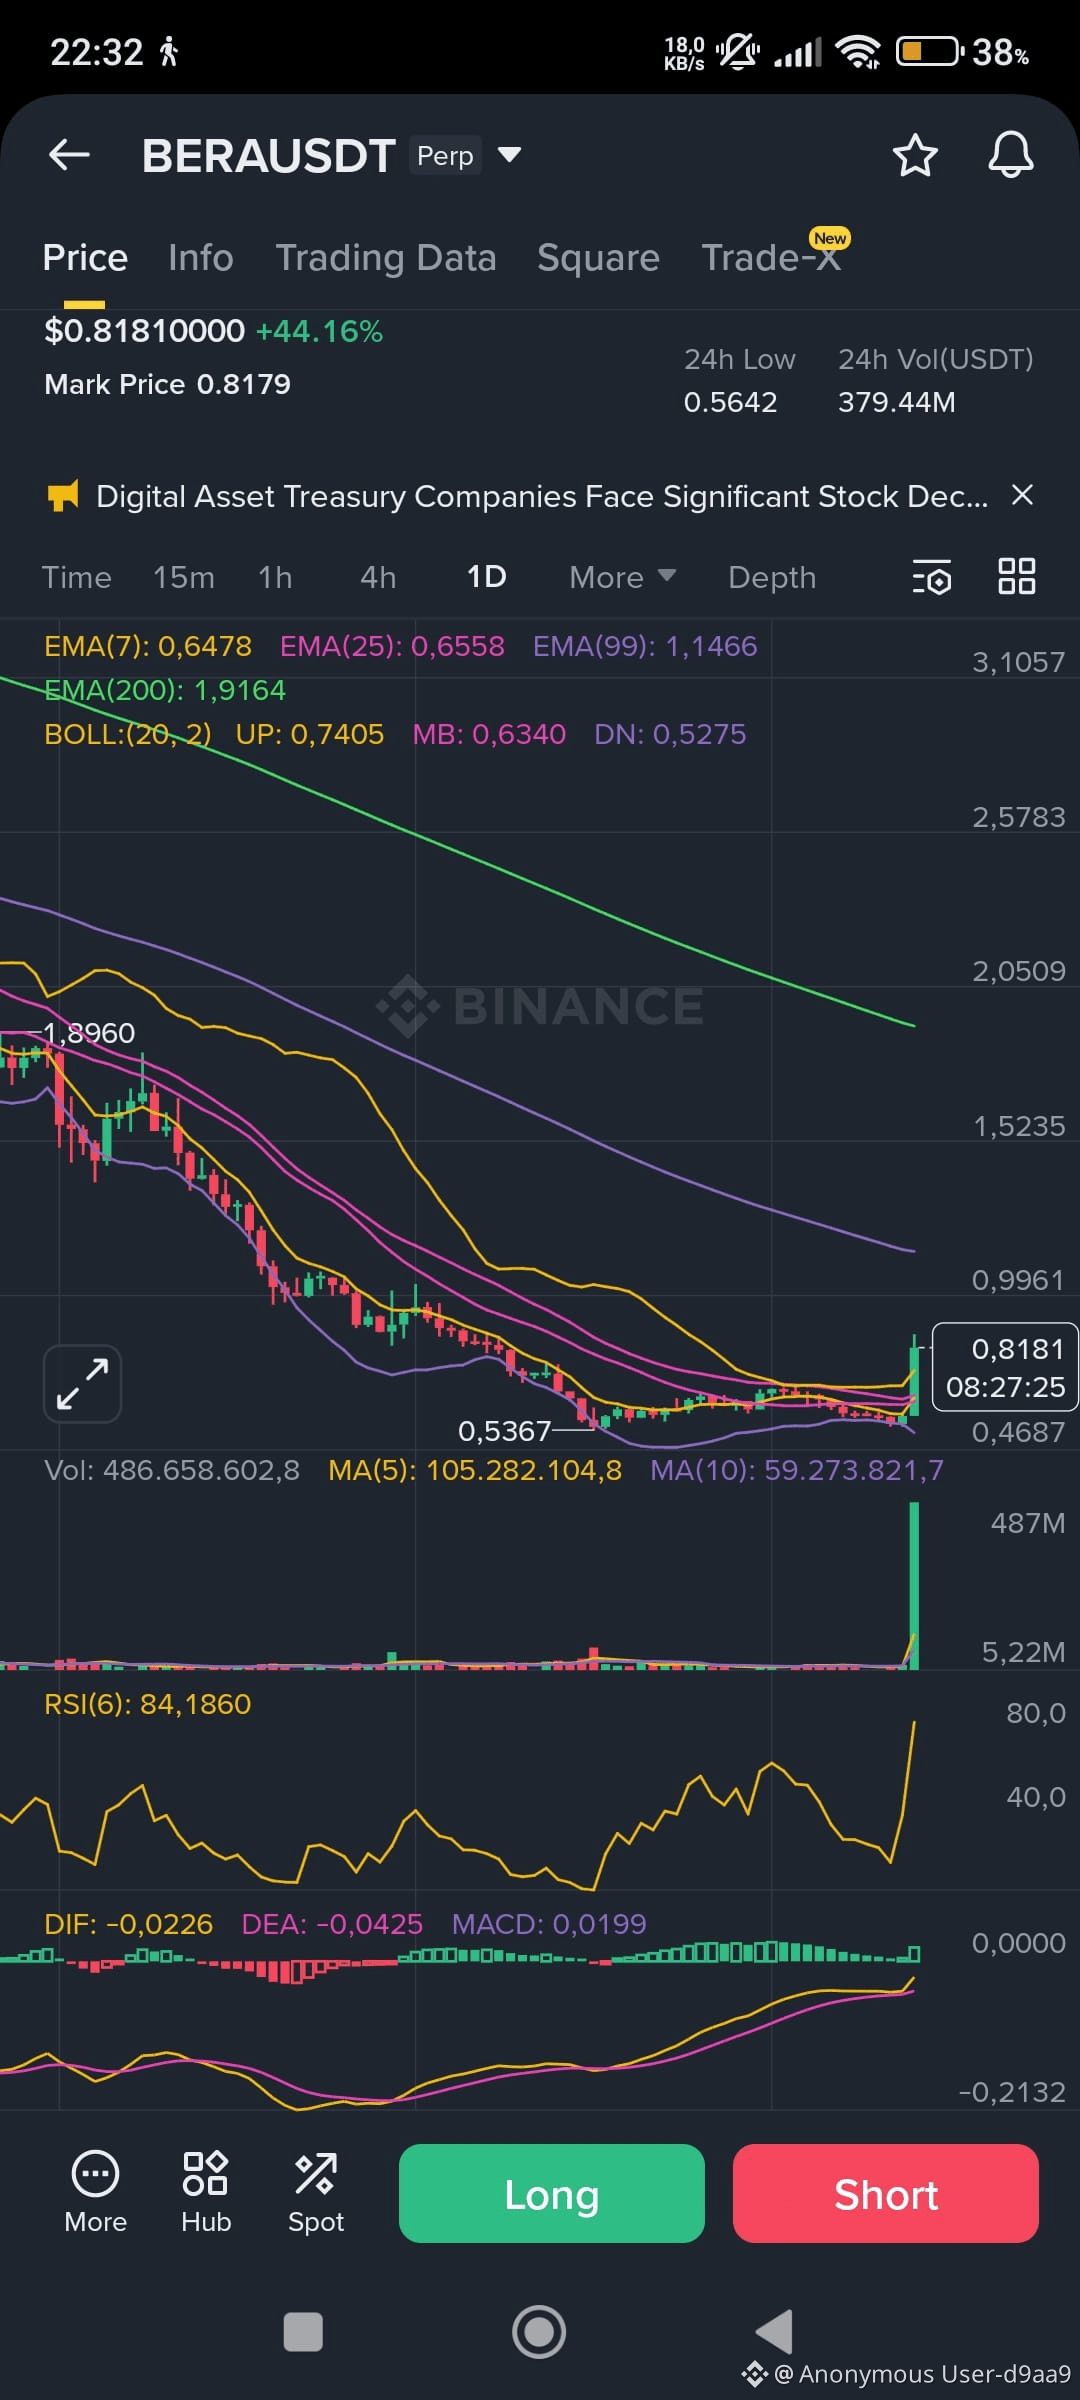
📈 $BERA – Bullish Breakout with Strong Volume
- Current Price: $0.8181 (+44.16%)
- Mark Price: $0.8179
- 24h Volume: 379.44M USDT
- EMA(7): 0.6478 | EMA(25): 0.6558 | EMA(99): 1.1466 | EMA(200): 1.9164
- RSI(6): 84.19 → overbought zone, but momentum remains strong
- MACD: DIF -0.0226 > DEA -0.0425 → bullish crossover confirmed
- Bollinger Bands: Price has broken above upper band (UP: 0.7405) → volatility expansion in play
- Timestamp: Jan 14, 2026 – 22:33 ICT
🔺 Analysis:
$BERA has surged over 44% in a single day, breaking above short-term EMAs and pushing into the upper Bollinger Band zone. RSI is deep in overbought territory, signaling strong momentum but also caution for short-term exhaustion. MACD has flipped bullish, and volume has spiked significantly, supporting the breakout. If price holds above 0.80, further upside is likely.
🎯 Suggested Strategy:
- Buy Zone: 0.800–0.820
- Stop-loss: 0.765
- Targets: 0.880 → 0.950 → 1.050
👉 Tap the chart below to open a Futures position on Binance.
#BERAUSDT #bullish #long #breakout #technicalanalysis #crypto $BERA
{future}(BERAUSDT)
📈 $BERA – Bullish Breakout with Strong Volume
- Current Price: $0.8181 (+44.16%)
- Mark Price: $0.8179
- 24h Volume: 379.44M USDT
- EMA(7): 0.6478 | EMA(25): 0.6558 | EMA(99): 1.1466 | EMA(200): 1.9164
- RSI(6): 84.19 → overbought zone, but momentum remains strong
- MACD: DIF -0.0226 > DEA -0.0425 → bullish crossover confirmed
- Bollinger Bands: Price has broken above upper band (UP: 0.7405) → volatility expansion in play
- Timestamp: Jan 14, 2026 – 22:33 ICT
🔺 Analysis:
$BERA has surged over 44% in a single day, breaking above short-term EMAs and pushing into the upper Bollinger Band zone. RSI is deep in overbought territory, signaling strong momentum but also caution for short-term exhaustion. MACD has flipped bullish, and volume has spiked significantly, supporting the breakout. If price holds above 0.80, further upside is likely.
🎯 Suggested Strategy:
- Buy Zone: 0.800–0.820
- Stop-loss: 0.765
- Targets: 0.880 → 0.950 → 1.050
👉 Tap the chart below to open a Futures position on Binance.
#BERAUSDT #bullish #long #breakout #technicalanalysis #crypto $BERA
1
45
عرض الترجمة
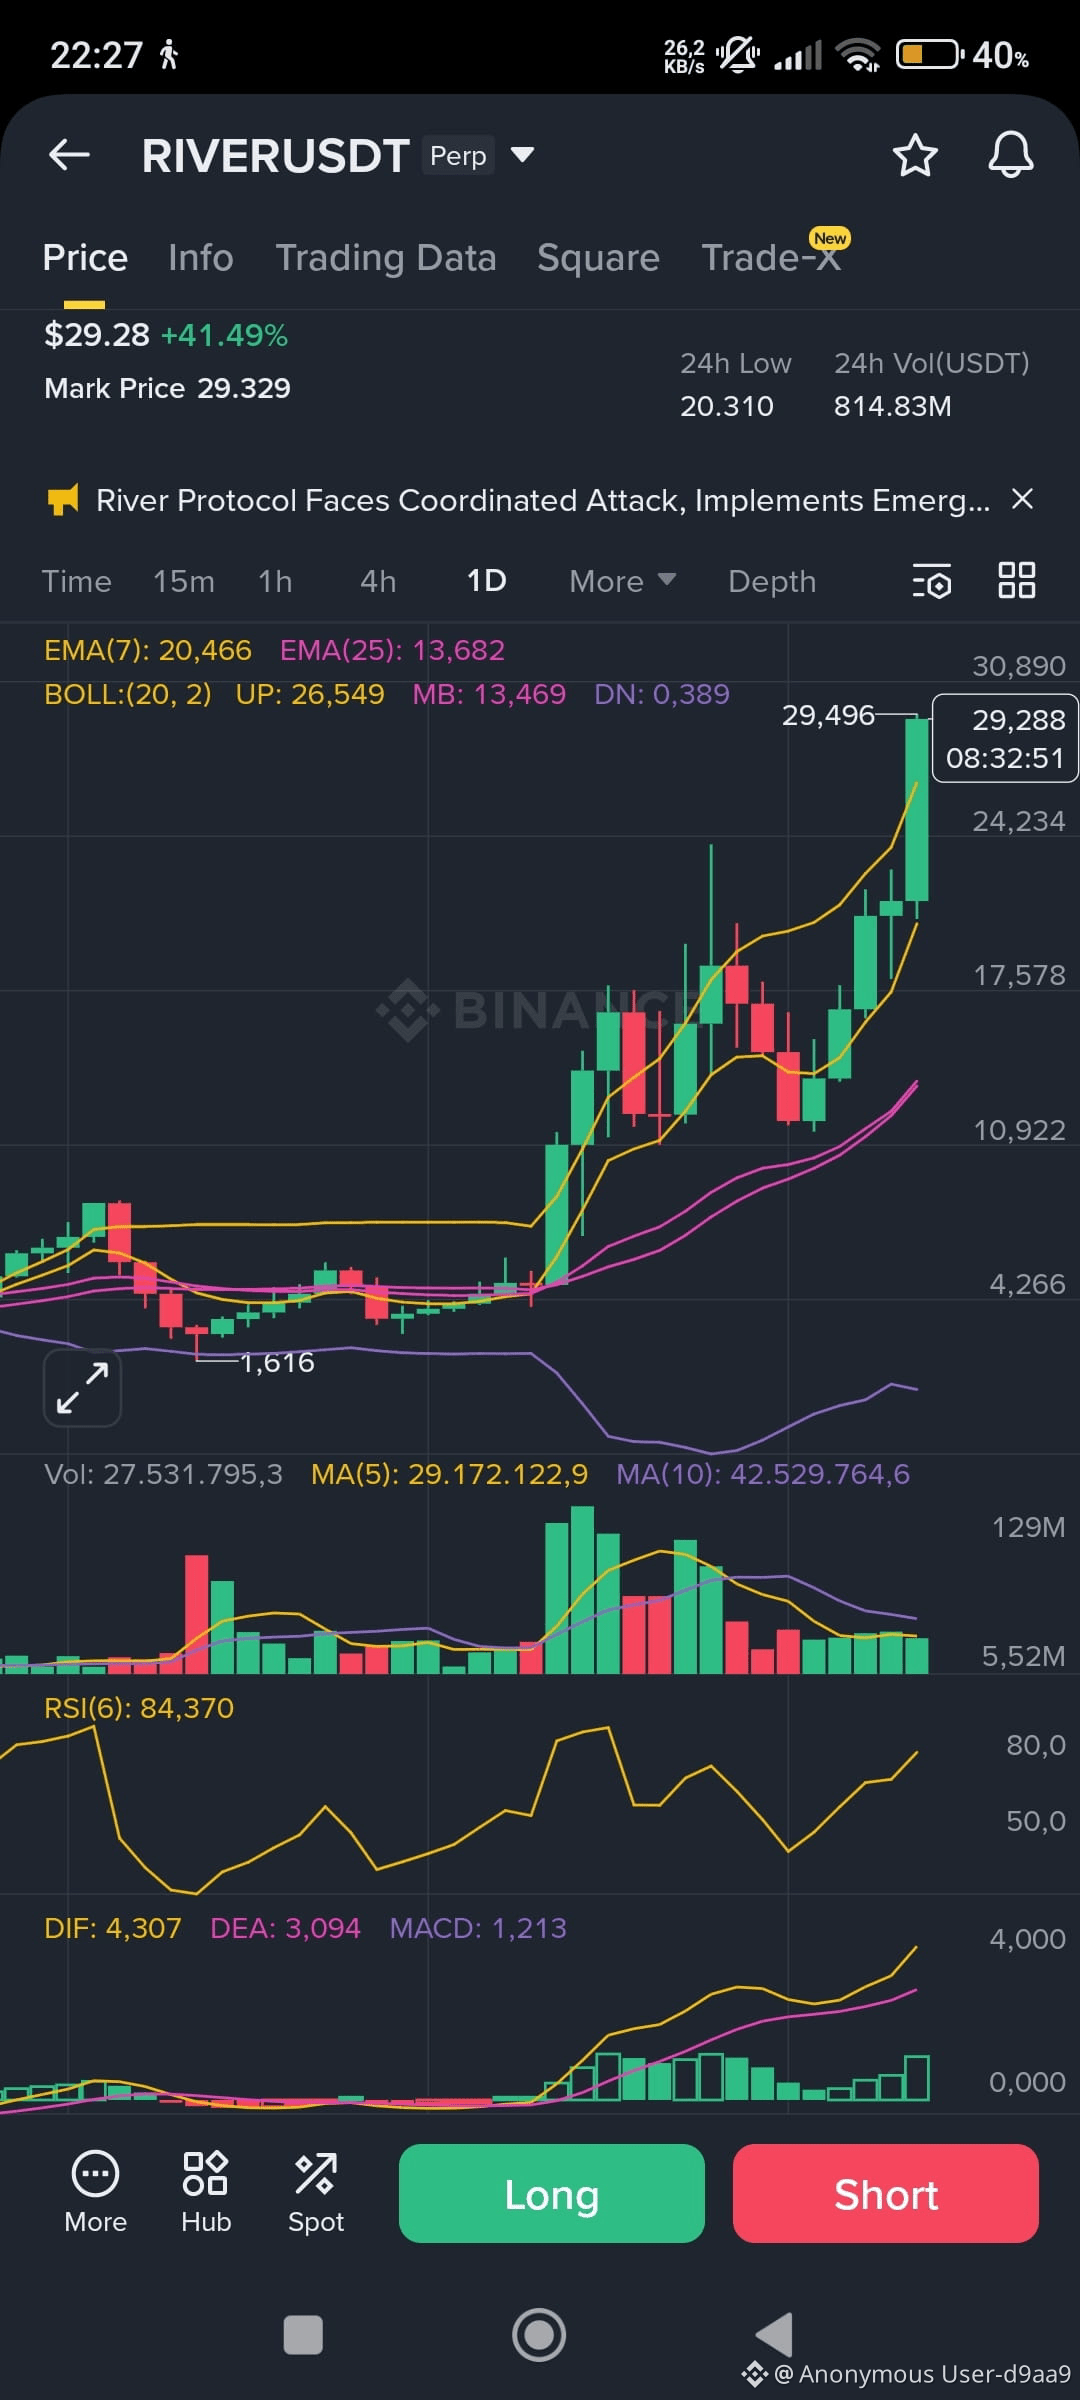
📈 $RIVER – Strong Breakout with Momentum
- Current Price: $29.28 (+41.49%)
- Mark Price: $29.329
- 24h Volume: 814.83M USDT
- EMA(7): 20.466 | EMA(25): 13.682
- RSI(6): 84.37 → deeply overbought, but momentum remains strong
- MACD: DIF 4.307 > DEA 3.094 → bullish continuation confirmed
- Bollinger Bands: Price has broken above upper band (UP: 26.549) → volatility expansion underway
- Timestamp: Jan 14, 2026 – 22:28 ICT
🔺 Analysis:
$RIVER has exploded past key resistance levels with a massive 41% daily gain. Price is well above EMA(7) and EMA(25), confirming a strong bullish trend. RSI is in overbought territory, but MACD shows no signs of divergence yet. The breakout above the Bollinger Band upper limit suggests a continuation move, especially with volume surging above 800M USDT.
🎯 Suggested Strategy:
- Buy Zone: 28.50–29.30
- Stop-loss: 27.40
- Targets: 31.50 → 34.00 → 37.00
👉 Tap the chart below to open a Futures position on Binance.
#RIVERUSDT #bullish #long #breakout #technicalanalysis #crypto $RIVER
{future}(RIVERUSDT)
📈 $RIVER – Strong Breakout with Momentum
- Current Price: $29.28 (+41.49%)
- Mark Price: $29.329
- 24h Volume: 814.83M USDT
- EMA(7): 20.466 | EMA(25): 13.682
- RSI(6): 84.37 → deeply overbought, but momentum remains strong
- MACD: DIF 4.307 > DEA 3.094 → bullish continuation confirmed
- Bollinger Bands: Price has broken above upper band (UP: 26.549) → volatility expansion underway
- Timestamp: Jan 14, 2026 – 22:28 ICT
🔺 Analysis:
$RIVER has exploded past key resistance levels with a massive 41% daily gain. Price is well above EMA(7) and EMA(25), confirming a strong bullish trend. RSI is in overbought territory, but MACD shows no signs of divergence yet. The breakout above the Bollinger Band upper limit suggests a continuation move, especially with volume surging above 800M USDT.
🎯 Suggested Strategy:
- Buy Zone: 28.50–29.30
- Stop-loss: 27.40
- Targets: 31.50 → 34.00 → 37.00
👉 Tap the chart below to open a Futures position on Binance.
#RIVERUSDT #bullish #long #breakout #technicalanalysis #crypto $RIVER
1
323
عرض الترجمة
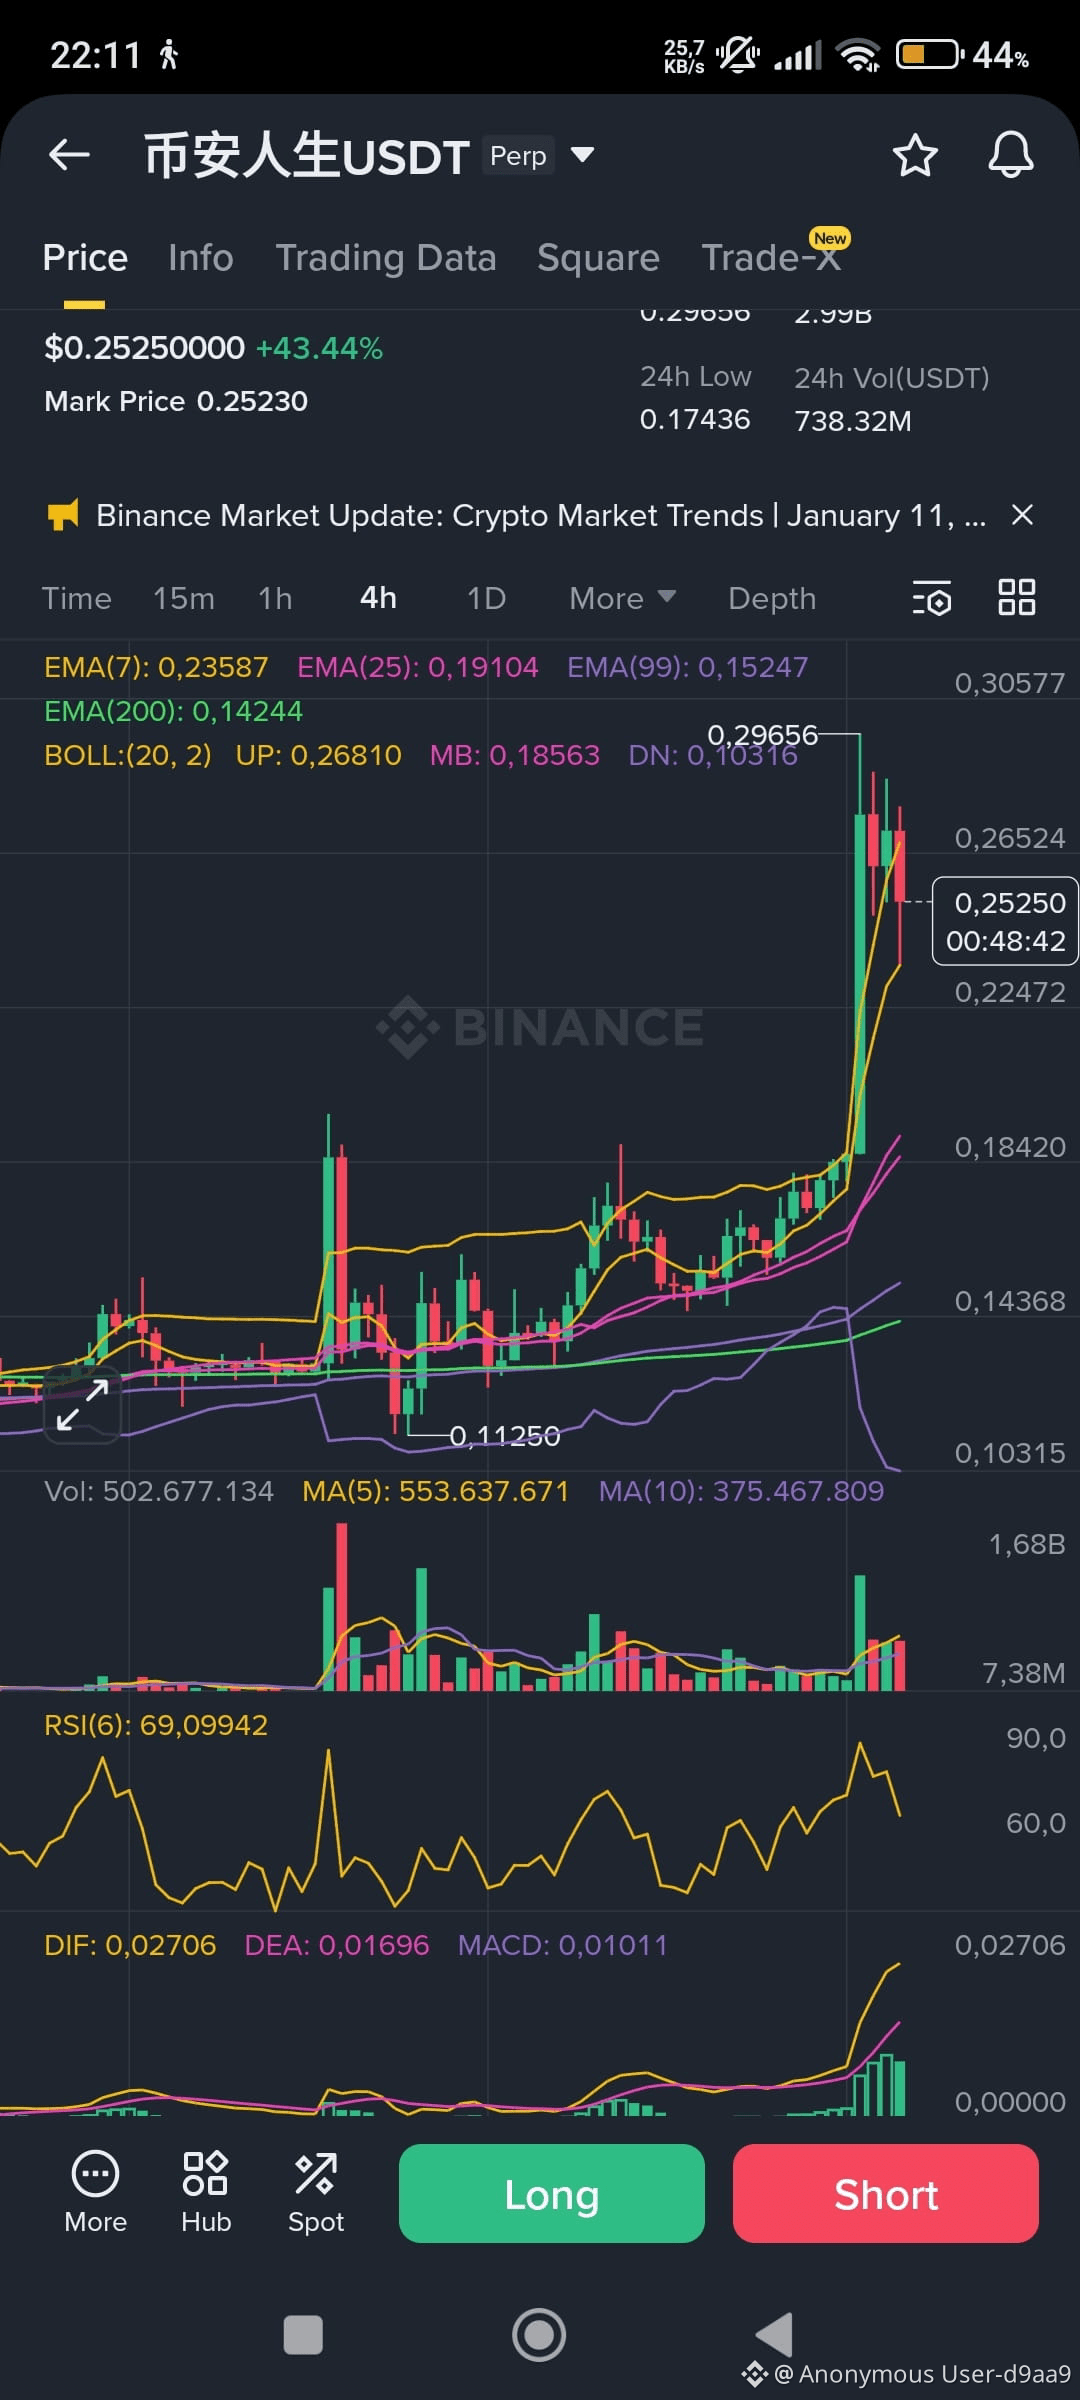
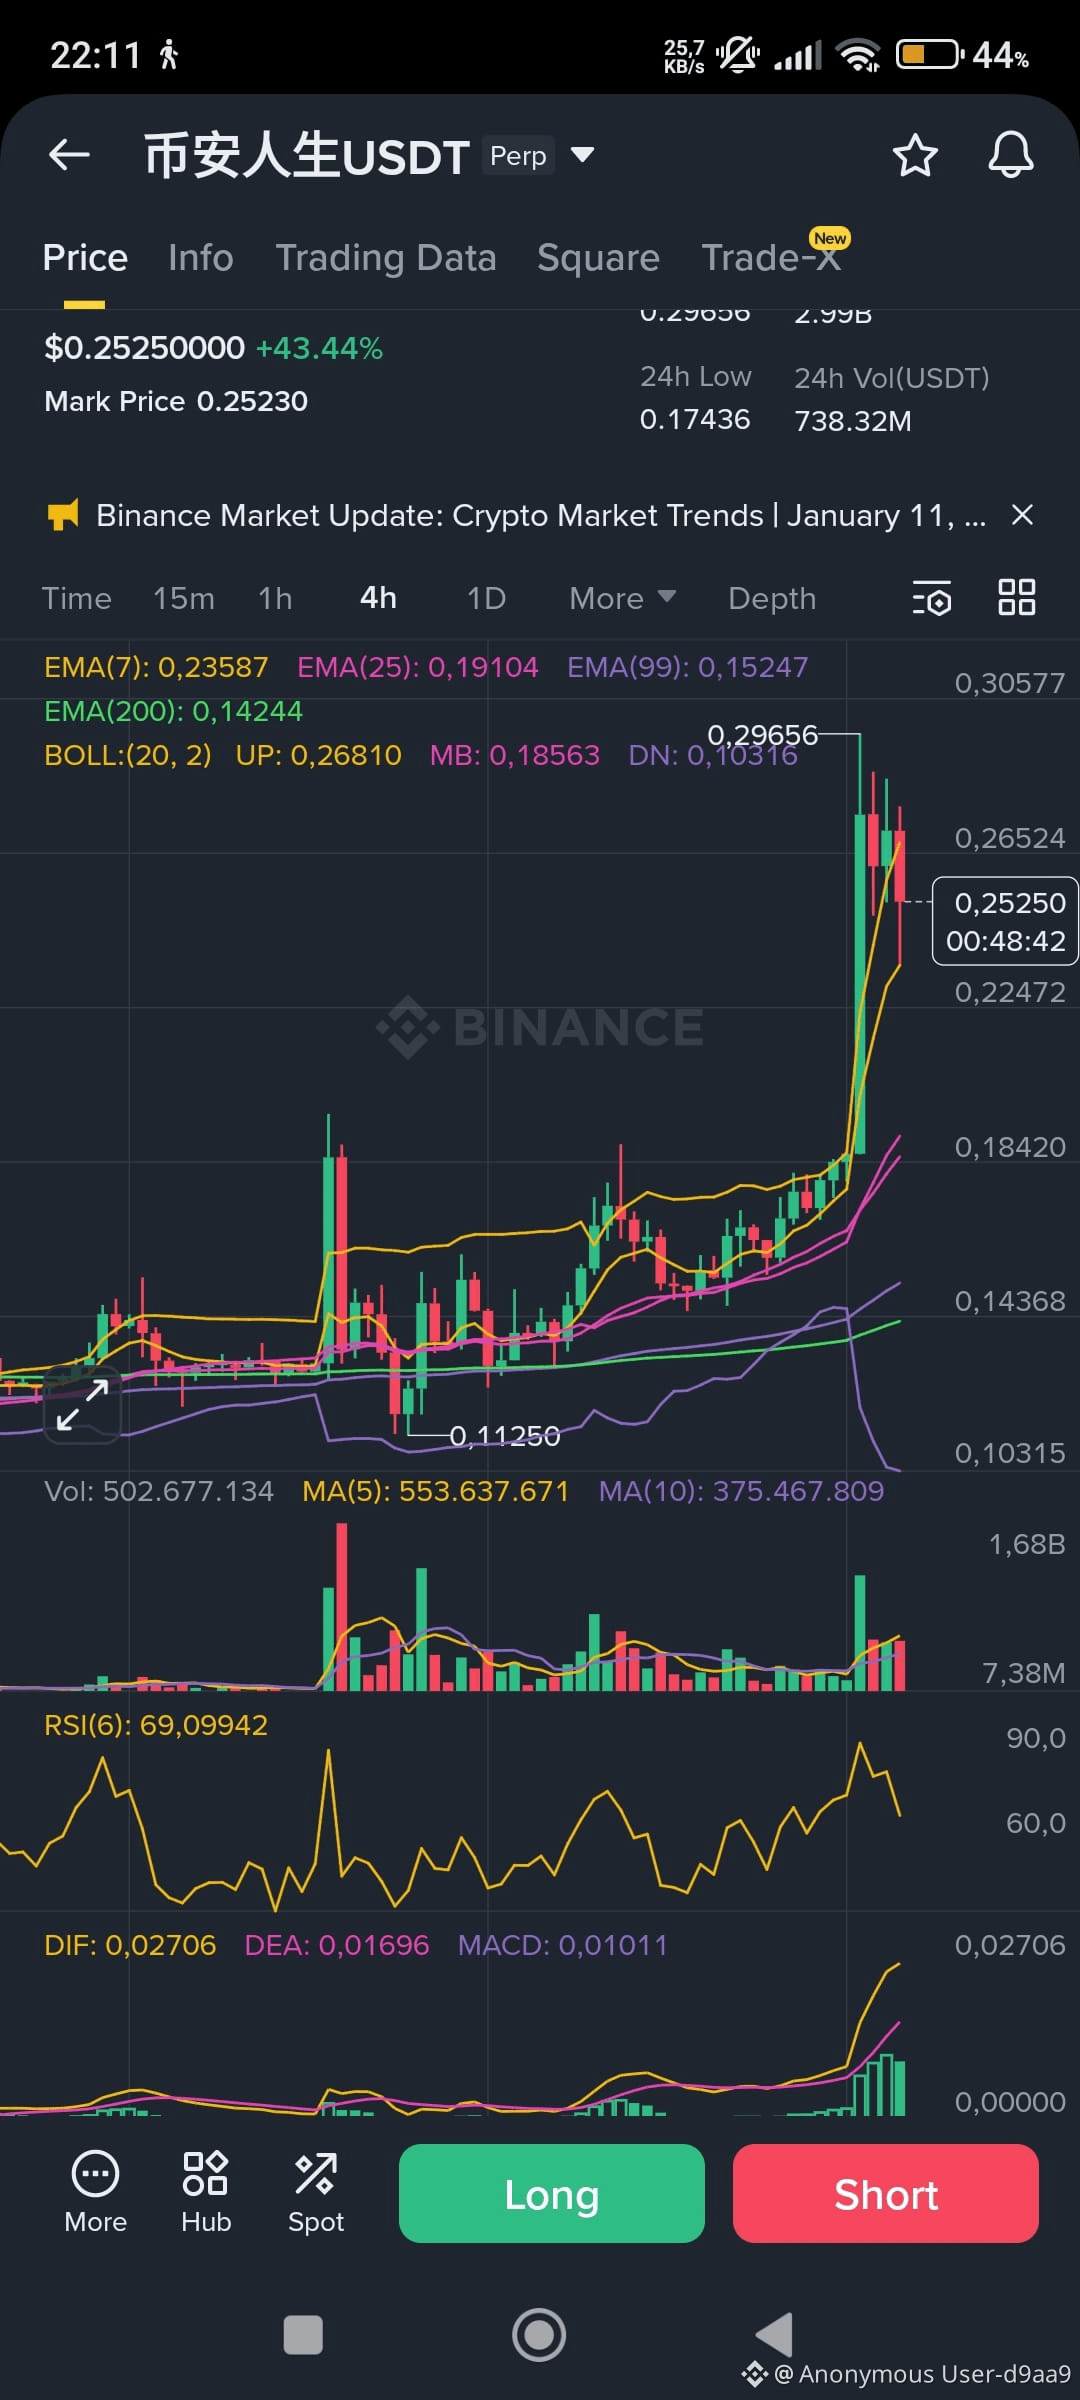
📉 $币安人生 – Potential Pullback After Parabolic Run
- Current Price: $0.2525 (+43.44%)
- Mark Price: $0.2523
- 24h Volume: 738.32M USDT
- EMA(7): 0.23587 | EMA(25): 0.19104 | EMA(99): 0.15247 | EMA(200): 0.14244
- RSI(6): 69.10 → approaching overbought territory
- MACD: DIF 0.02706 > DEA 0.01696 → bullish momentum but signs of slowing
- Bollinger Bands: Price nearing upper band (UP: 0.26810) → high volatility zone
- Timestamp: Jan 14, 2026 – 22:14 ICT
🔻 Analysis:
$币安人生 has surged over 40% in a short span, pushing RSI close to 70 and price into the upper Bollinger Band. While momentum remains strong, the setup suggests a possible short-term correction or consolidation. Volume is high, but MACD histogram is flattening, hinting at exhaustion. A rejection near 0.268 could trigger a pullback toward EMA(25) or the mid-band.
🎯 Suggested Strategy:
- Short Entry Zone: 0.255–0.265
- DCA Range: 0.268–0.275
- Stop-loss: 0.282
- Targets: 0.230 → 0.210 → 0.190
👉 Tap the chart below to open a Futures position on Binance.
#BinanceLifeUSDT #short #bearish #technicalanalysis #crypto $币安人生
{future}(币安人生USDT)
📉 $币安人生 – Potential Pullback After Parabolic Run
- Current Price: $0.2525 (+43.44%)
- Mark Price: $0.2523
- 24h Volume: 738.32M USDT
- EMA(7): 0.23587 | EMA(25): 0.19104 | EMA(99): 0.15247 | EMA(200): 0.14244
- RSI(6): 69.10 → approaching overbought territory
- MACD: DIF 0.02706 > DEA 0.01696 → bullish momentum but signs of slowing
- Bollinger Bands: Price nearing upper band (UP: 0.26810) → high volatility zone
- Timestamp: Jan 14, 2026 – 22:14 ICT
🔻 Analysis:
$币安人生 has surged over 40% in a short span, pushing RSI close to 70 and price into the upper Bollinger Band. While momentum remains strong, the setup suggests a possible short-term correction or consolidation. Volume is high, but MACD histogram is flattening, hinting at exhaustion. A rejection near 0.268 could trigger a pullback toward EMA(25) or the mid-band.
🎯 Suggested Strategy:
- Short Entry Zone: 0.255–0.265
- DCA Range: 0.268–0.275
- Stop-loss: 0.282
- Targets: 0.230 → 0.210 → 0.190
👉 Tap the chart below to open a Futures position on Binance.
#BinanceLifeUSDT #short #bearish #technicalanalysis #crypto $币安人生
2
202
عرض الترجمة
📈 $币安人生 – Explosive Bullish Breakout
- Current Price: $0.2525 (+43.44%)
- Mark Price: $0.2523
- 24h Volume: 738.32M USDT
- EMA(7): 0.23587 | EMA(25): 0.19104 | EMA(99): 0.15247 | EMA(200): 0.14244
- RSI(6): 69.10 → approaching overbought zone
- MACD: DIF 0.02706 > DEA 0.01696 → strong bullish momentum
- Bollinger Bands: Price nearing upper band (UP: 0.26810) → volatility expansion likely
- Timestamp: Jan 14, 2026 – 22:12 ICT
🔺 Analysis:
$币安人生 has surged over 43% in the last 24 hours, breaking above all major EMAs with strong volume support. RSI is nearing 70, indicating powerful momentum but also caution for potential short-term pullbacks. MACD confirms bullish strength, and Bollinger Bands suggest further upside if price breaks above 0.268.
🎯 Suggested Strategy:
- Buy Zone: 0.245–0.255
- Stop-loss: 0.232
- Targets: 0.275 → 0.295 → 0.320
👉 Tap the chart below to open a Futures position on Binance.
#BinanceLifeUSDT #bullish #long #breakout #technicalanalysis #crypto $币安人生
{future}(币安人生USDT)
📈 $币安人生 – Explosive Bullish Breakout
- Current Price: $0.2525 (+43.44%)
- Mark Price: $0.2523
- 24h Volume: 738.32M USDT
- EMA(7): 0.23587 | EMA(25): 0.19104 | EMA(99): 0.15247 | EMA(200): 0.14244
- RSI(6): 69.10 → approaching overbought zone
- MACD: DIF 0.02706 > DEA 0.01696 → strong bullish momentum
- Bollinger Bands: Price nearing upper band (UP: 0.26810) → volatility expansion likely
- Timestamp: Jan 14, 2026 – 22:12 ICT
🔺 Analysis:
$币安人生 has surged over 43% in the last 24 hours, breaking above all major EMAs with strong volume support. RSI is nearing 70, indicating powerful momentum but also caution for potential short-term pullbacks. MACD confirms bullish strength, and Bollinger Bands suggest further upside if price breaks above 0.268.
🎯 Suggested Strategy:
- Buy Zone: 0.245–0.255
- Stop-loss: 0.232
- Targets: 0.275 → 0.295 → 0.320
👉 Tap the chart below to open a Futures position on Binance.
#BinanceLifeUSDT #bullish #long #breakout #technicalanalysis #crypto $币安人生
2
222
عرض الترجمة
📈 $SHIB – Bullish Momentum Building
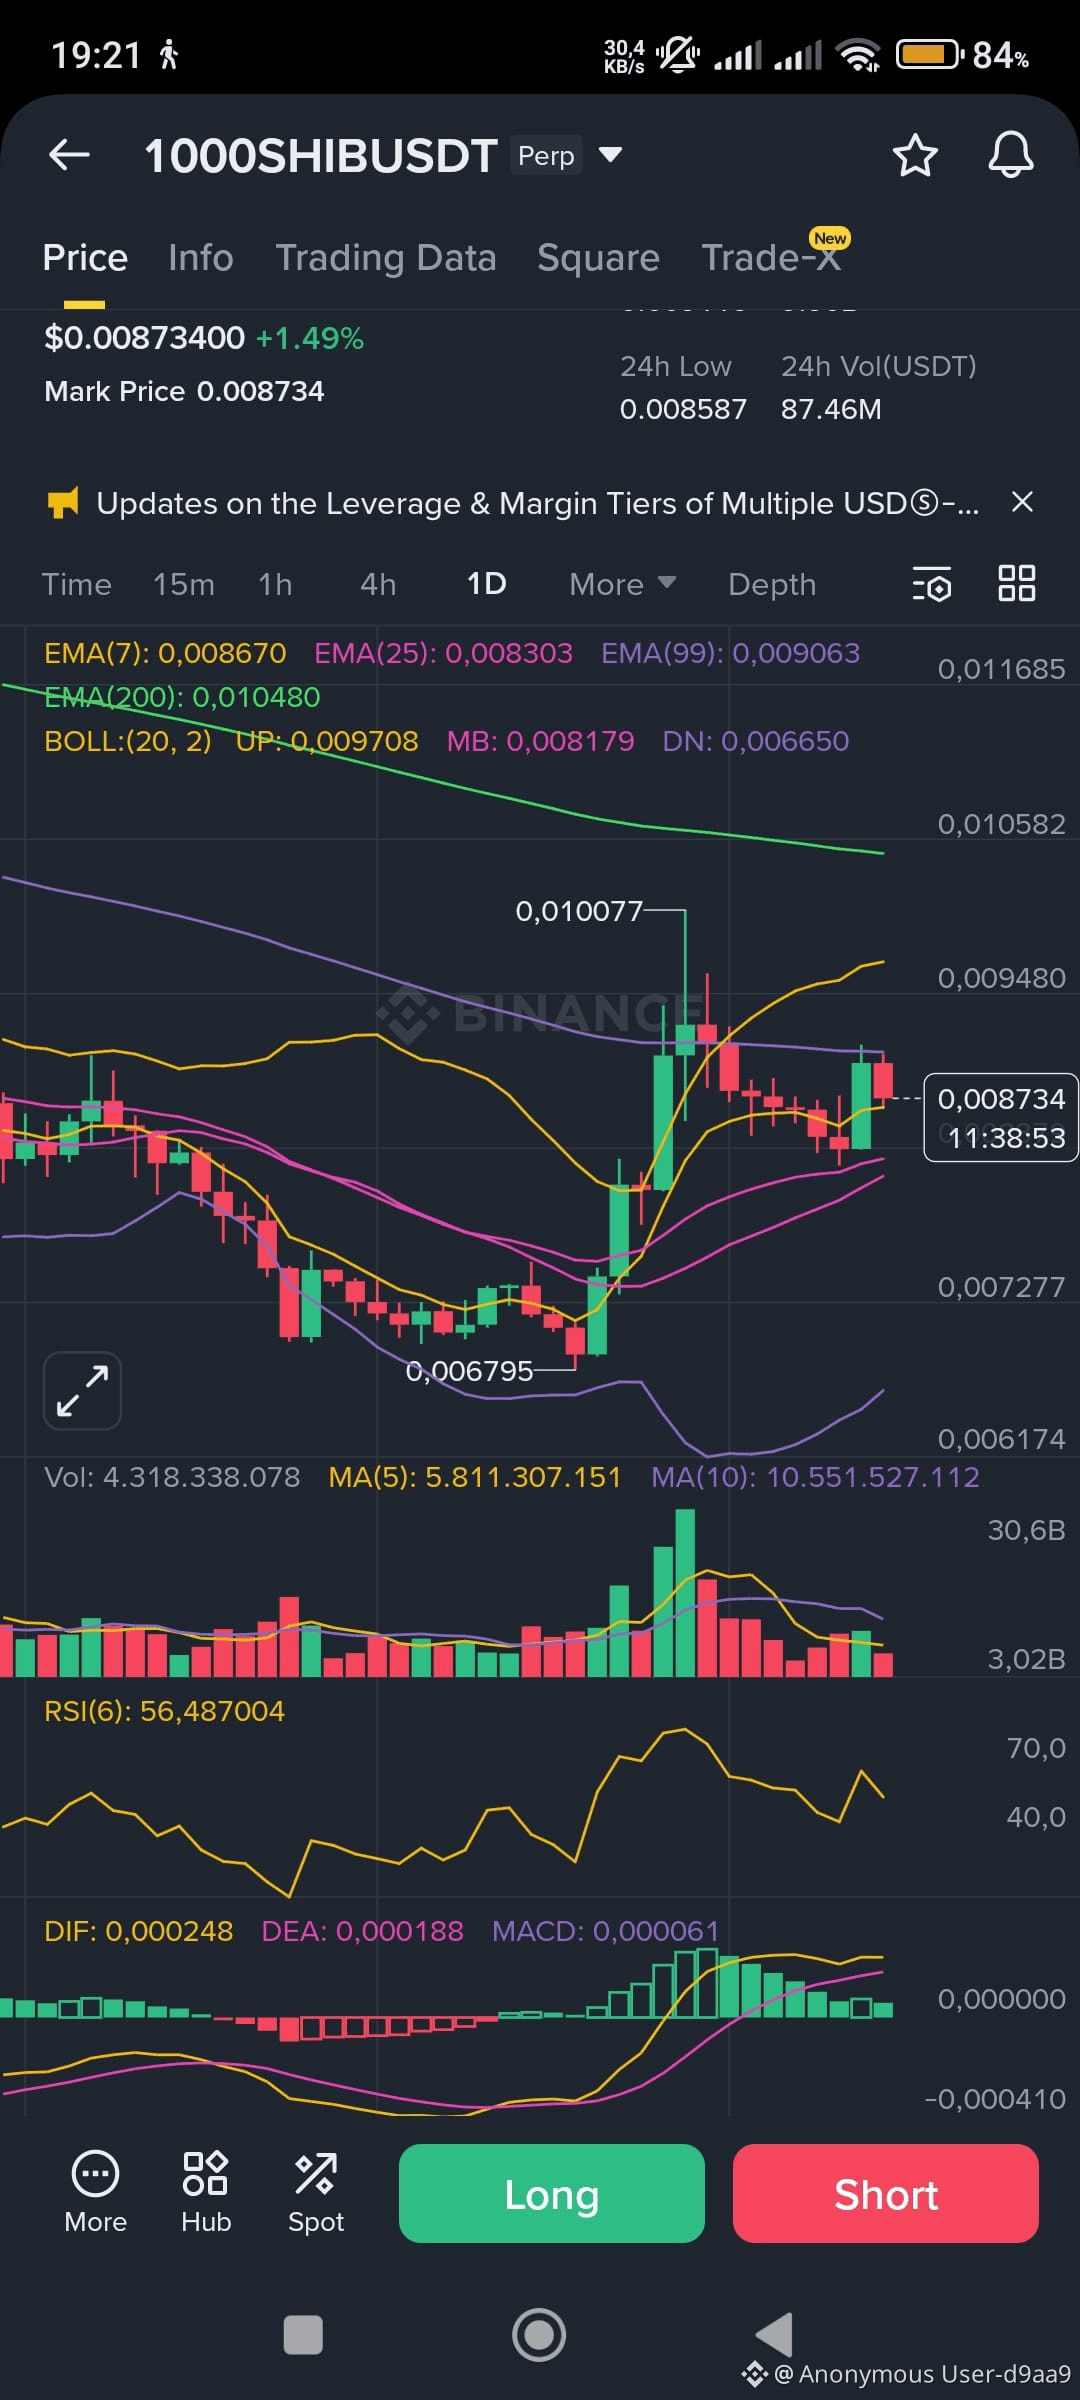
- Current Price: $0.008734 (+1.49%)
- Mark Price: $0.008734
- 24h Volume: 87.46M USDT
- EMA(7): 0.008670 | EMA(25): 0.008303 | EMA(99): 0.009063
- RSI(6): 56.49 → trending upward, still below overbought zone
- MACD: DIF 0.000248 > DEA 0.000188 → bullish crossover confirmed
- Bollinger Bands: Price approaching upper band (UP: 0.009708) → potential breakout ahead
- Timestamp: Jan 14, 2026 – 22:00 ICT
🔺 Analysis:
$SHIB is showing signs of bullish continuation after reclaiming EMA(7) and EMA(25). RSI is climbing steadily, and MACD confirms upward momentum. Price is nearing the upper Bollinger Band, suggesting a possible breakout if volume sustains. The recent low of 0.006795 has held firm, and the current structure favors a push toward resistance levels.
🎯 Suggested Strategy:
- Buy Zone: 0.00865–0.00875
- Stop-loss: 0.00850
- Targets: 0.00920 → 0.00970 → 0.01000
👉 Tap the chart below to open a Futures position on Binance.
#SHIBUSDT #bullish #long #technicalanalysis #Binance $SHIB
2
46
عرض الترجمة
📈 $SUI – Continued Bullish Signal
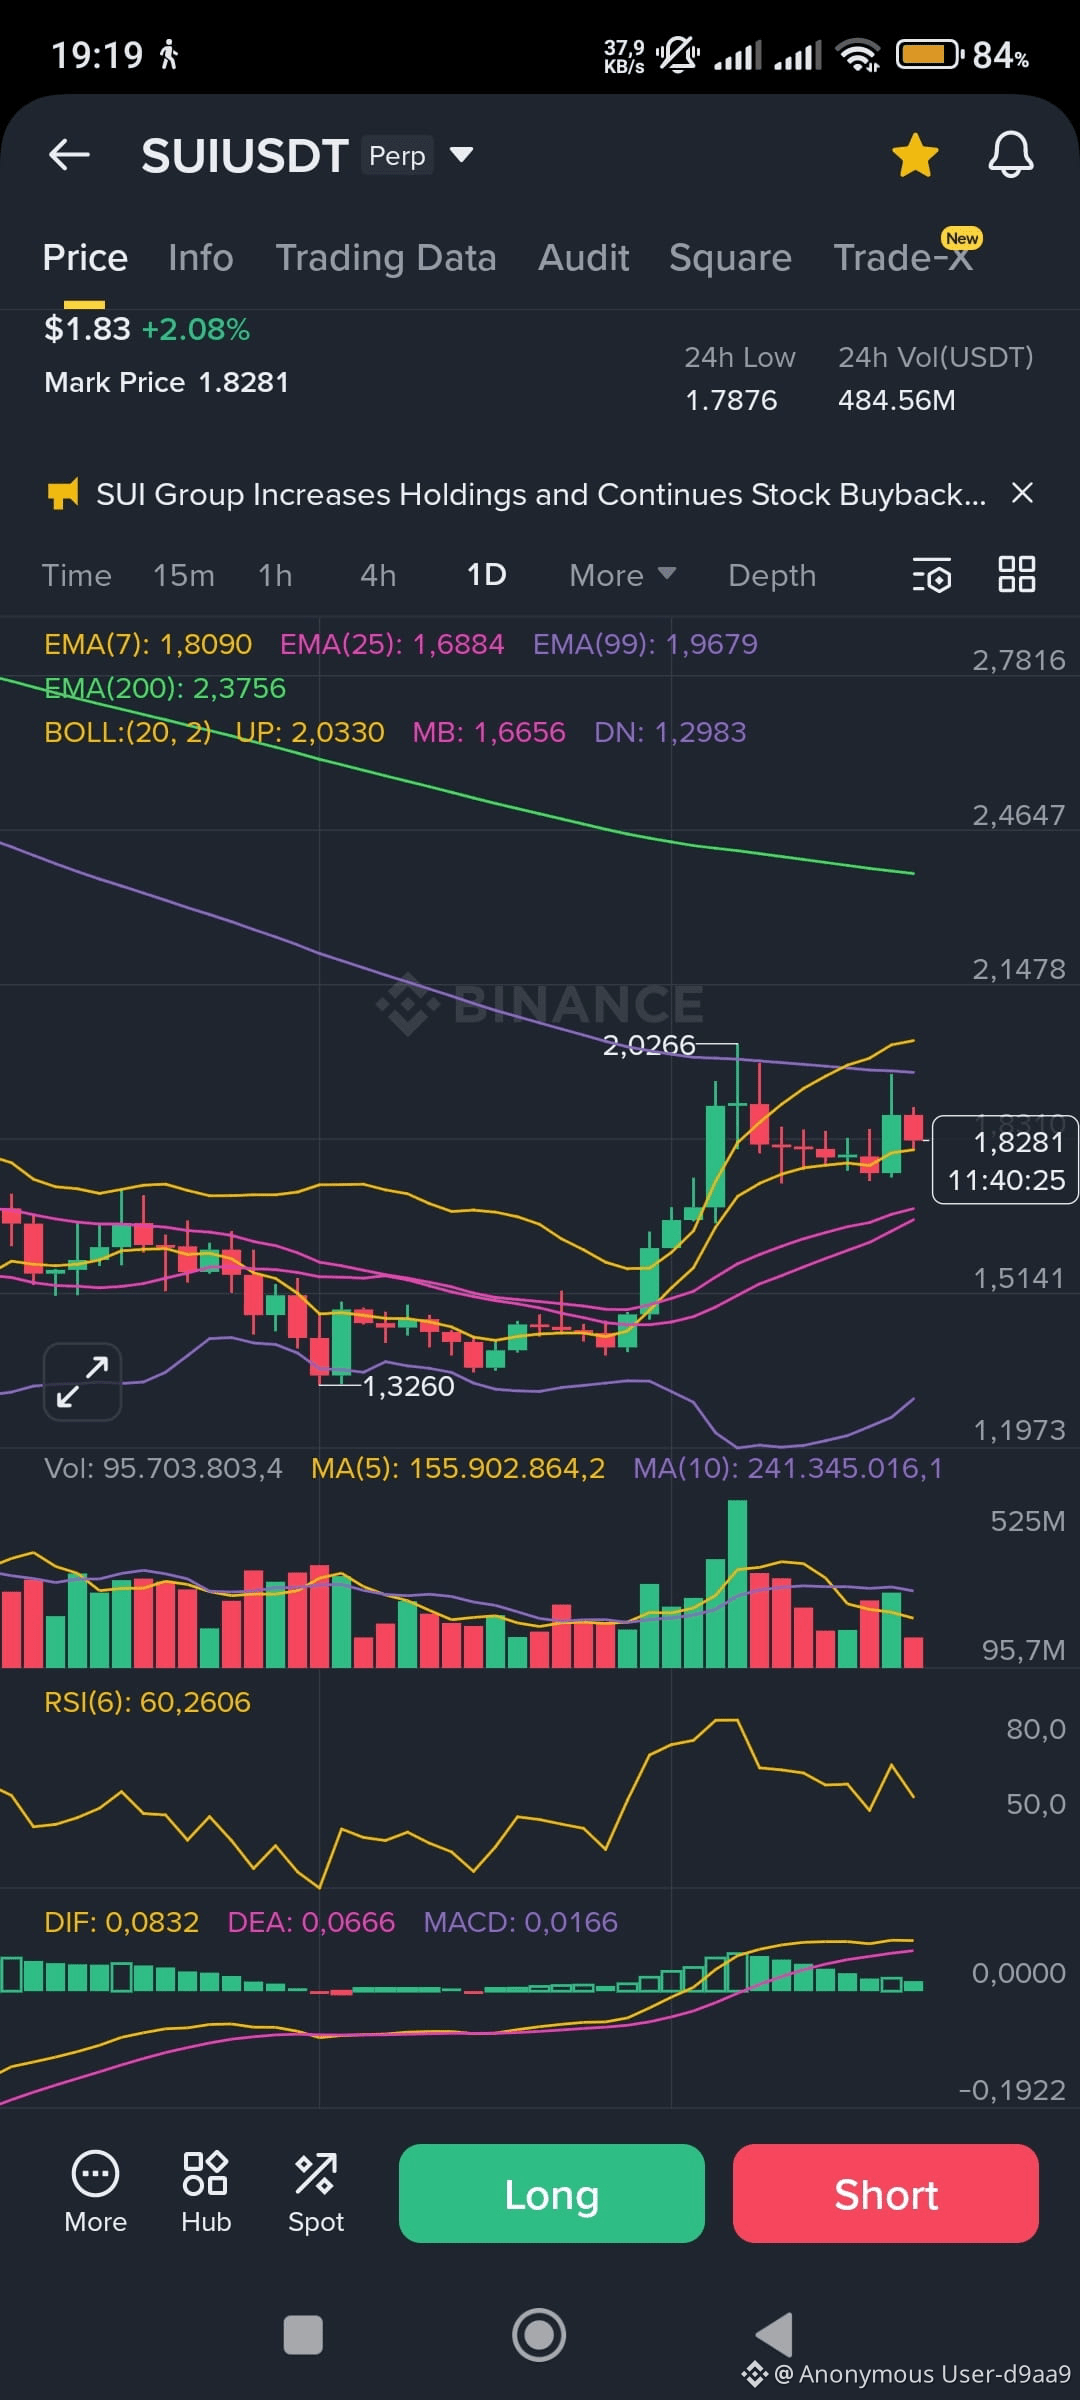
- Current Price: $1.83 (+2.08%)
- Mark Price: $1.8281
- 24h Trading Volume: 484.56M USDT
- EMA(7): 1.8090 | EMA(25): 1.6884 | EMA(99): 1.9679
- RSI(6): 60.26 → trending upward, not yet in overbought territory
- MACD: DIF 0.0832 > DEA 0.0666 → bullish momentum remains intact
- Bollinger Bands: Price approaching upper band (UP: 2.0330) → potential for further expansion
- Timestamp: Jan 14, 2026 – 21:54 ICT
🔺 Analysis:
$SUI is maintaining a steady uptrend after breaking above EMA(25). RSI above 60 indicates bullish momentum with room to grow. MACD continues to widen, confirming the upward trend. Bollinger Bands suggest price is nearing resistance around 2.03, and a breakout could open new upside potential.
🎯 Suggested Strategy:
- Buy Zone: 1.80–1.82
- Stop-loss: 1.76
- Targets: 1.95 → 2.10 → 2.30
👉 Tap the chart below to open a Futures position on Binance.
#SUIUSDT #bullish #long #technicalanalysis #Binance $SUI
2
72
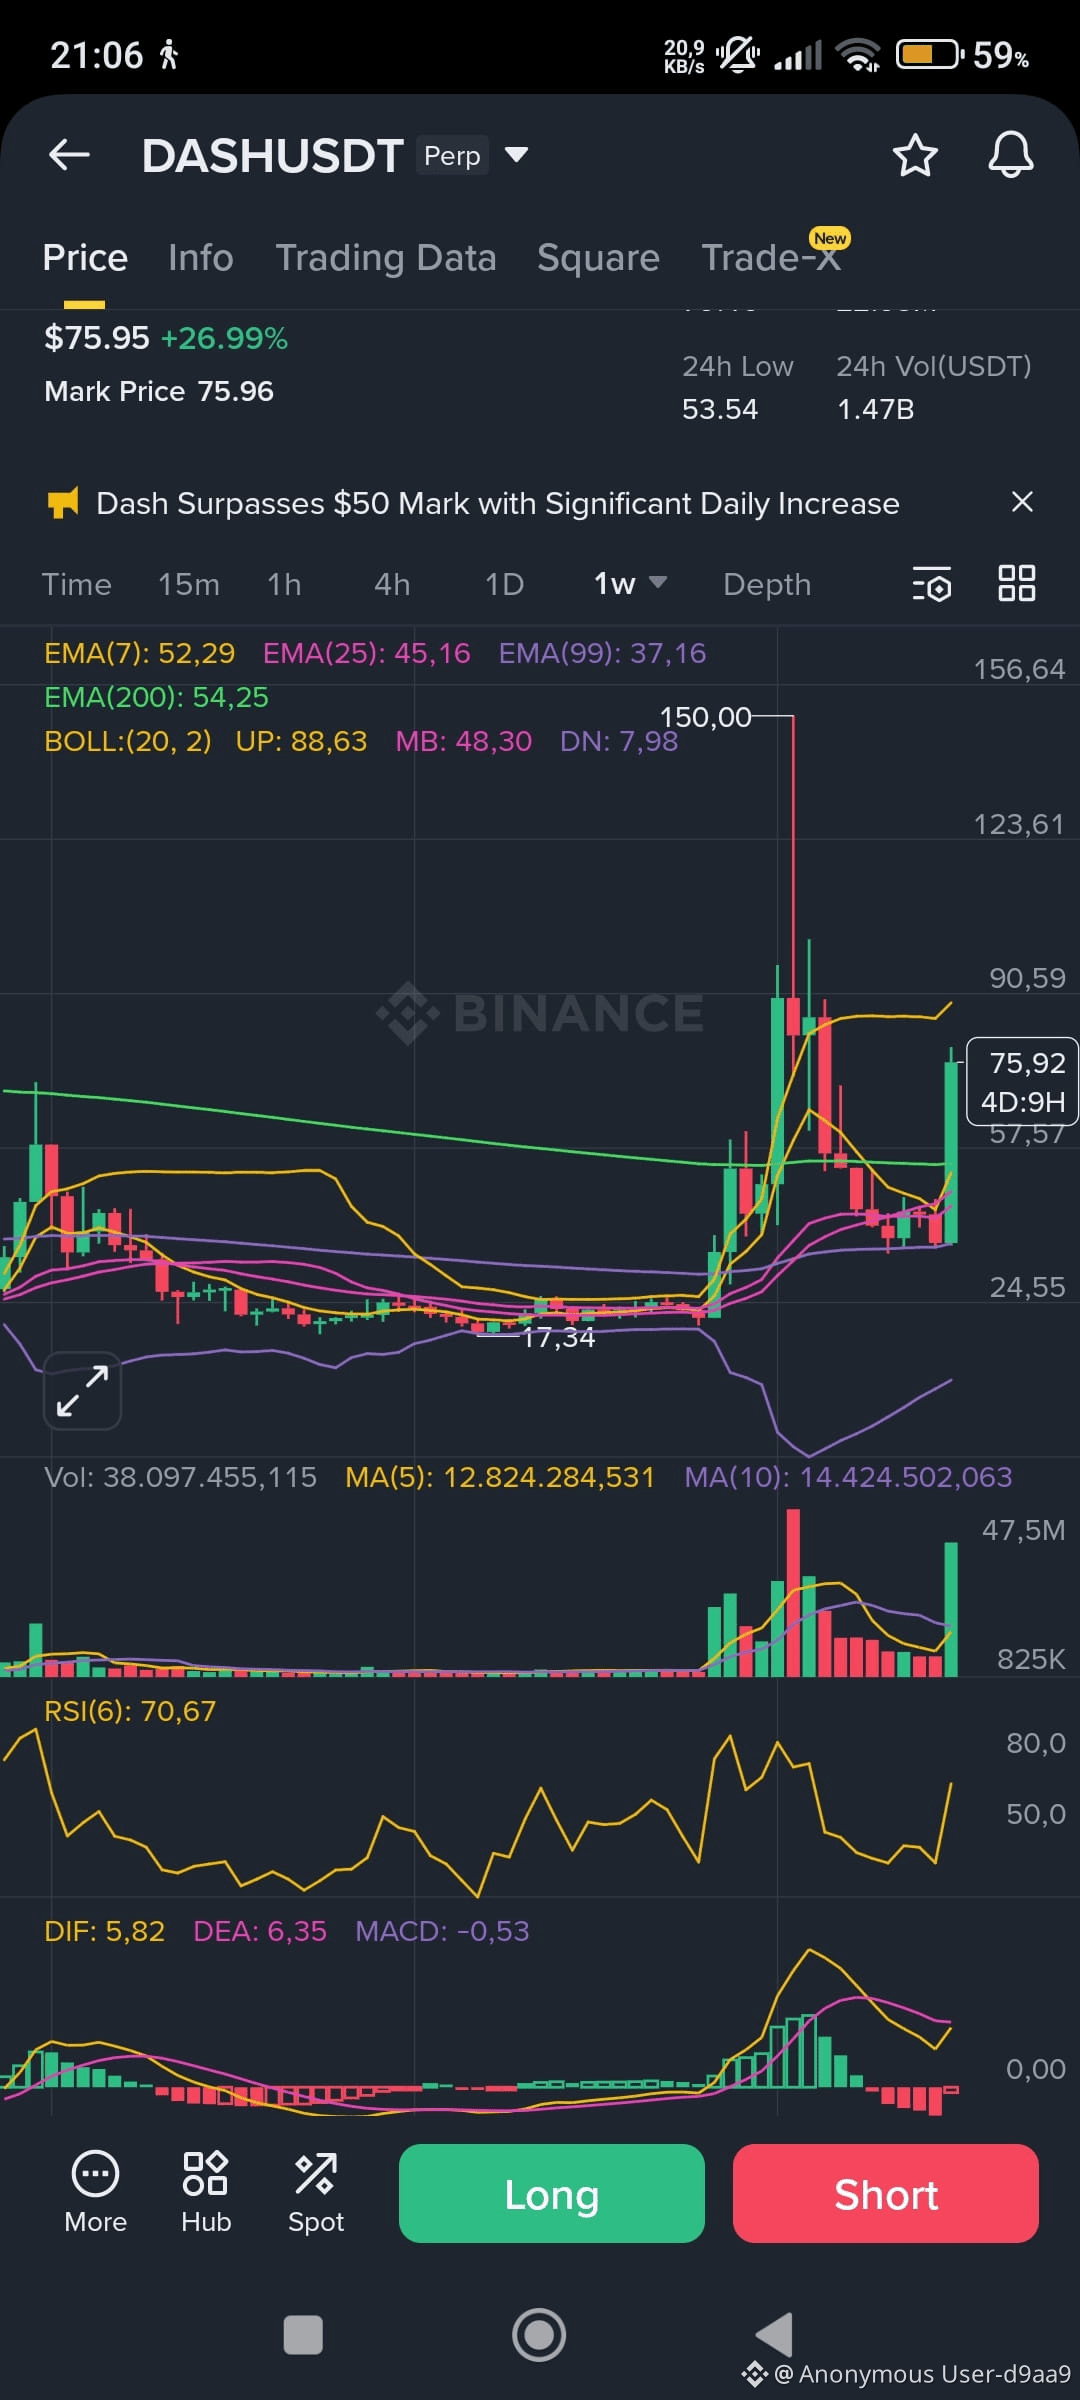
⚡ العقود الآجلة DASH/USDT – ارتفاع داش بنسبة +27.67%، زخم كسر المقاومة يهيمن
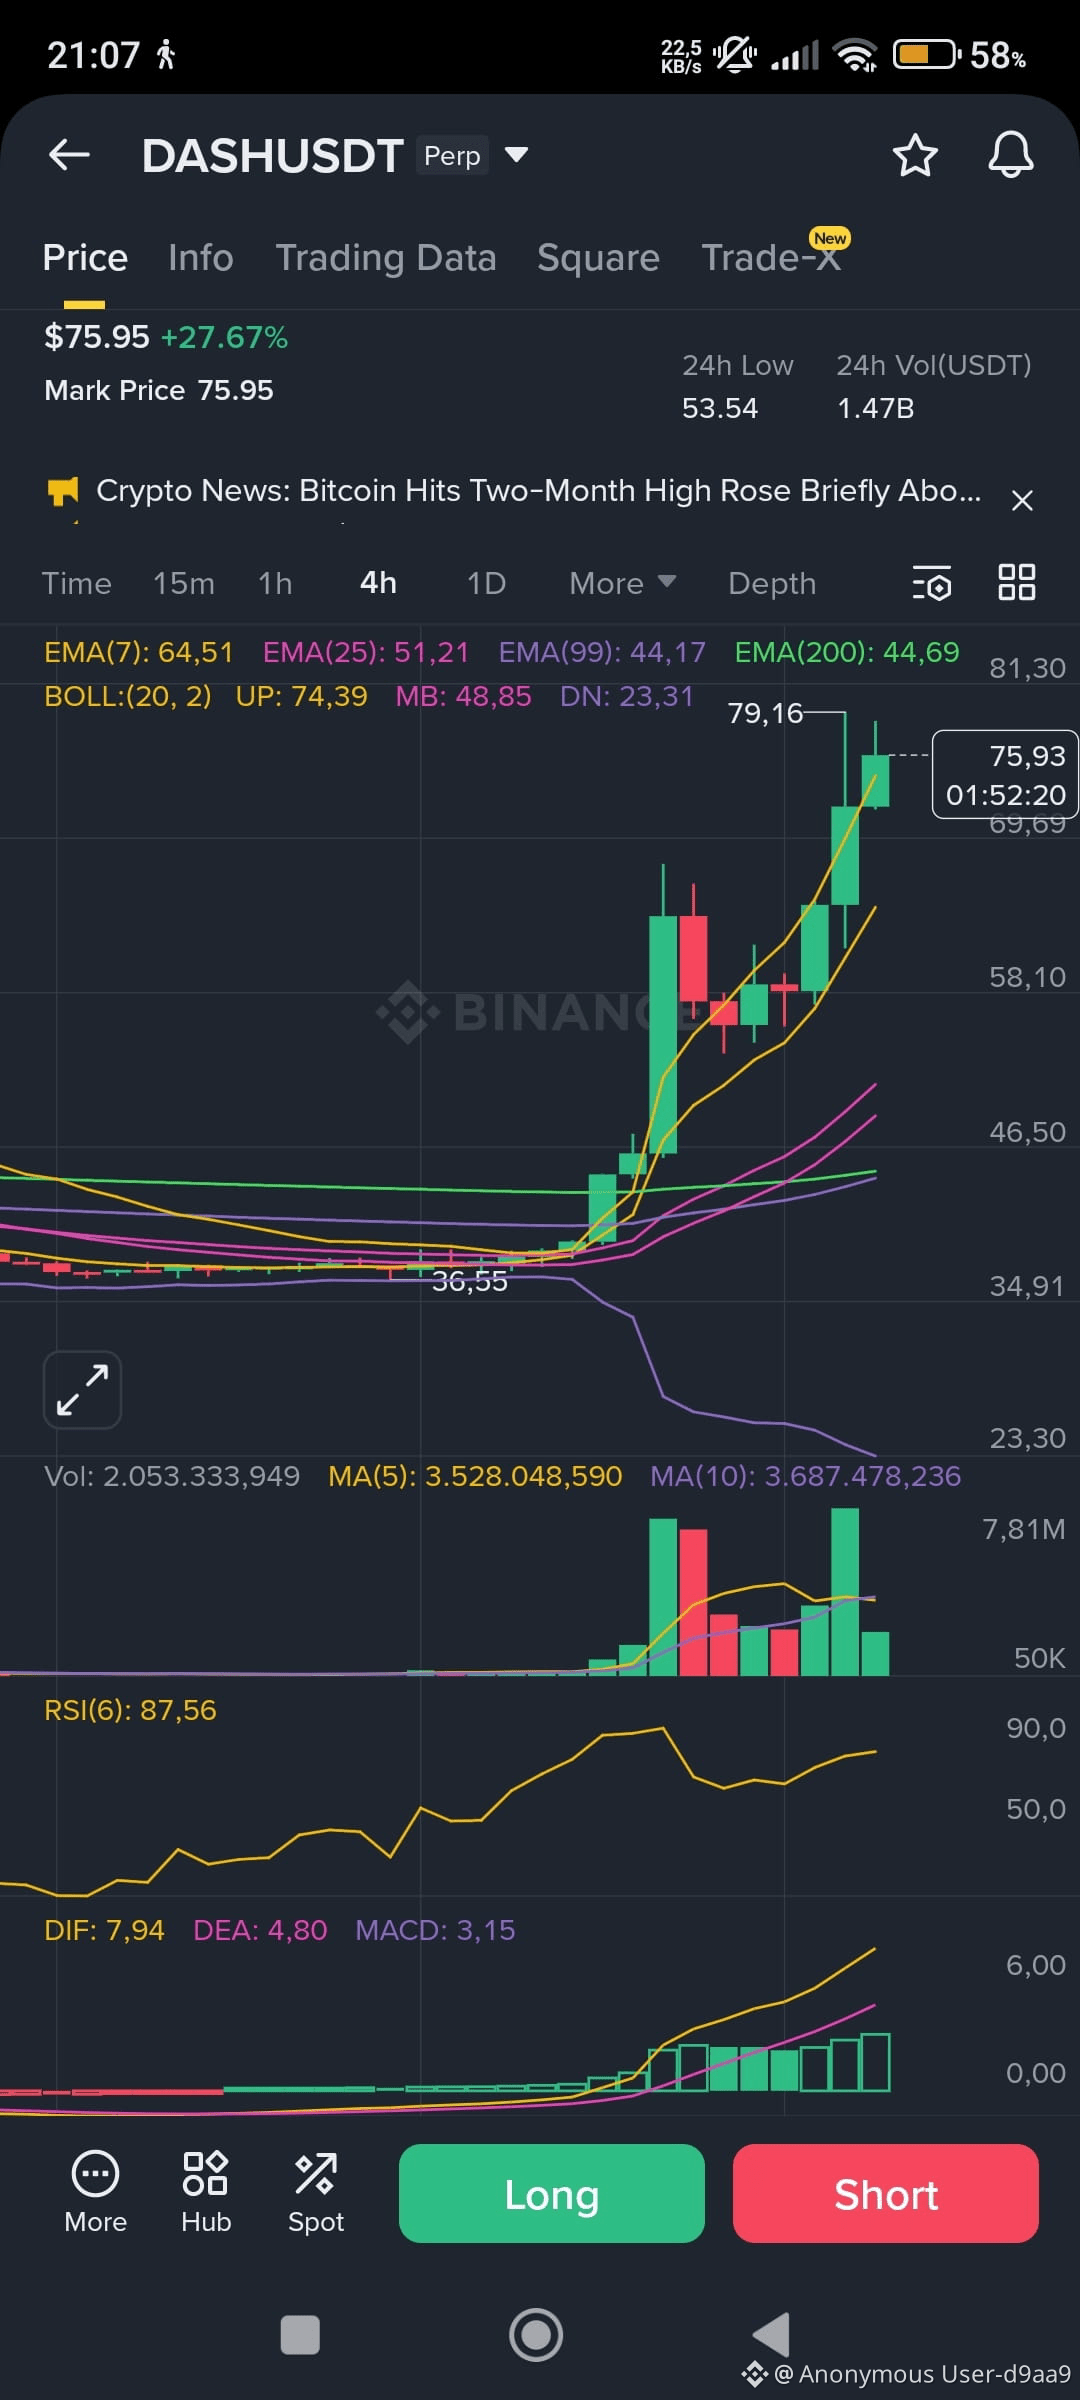
تتصاعد داش ($DASH) بزخم صعودي قوي، وتُتداول حاليًا عند 75.95 دولارًا، بارتفاع نسبته +27.67% خلال الـ24 ساعة الماضية. وبحجم تداول ضخم قدره 1.47 مليار دولار من USDT، فإن DASH تُعد واحدة من أكثر الأصول حركة في السوق حاليًا.
📊 نظرة تقنية
- EMA(7): 64.51 → السعر أعلى بكثير من المتوسط القصير الأجل، ما يؤكد زخمًا صعوديًا قويًا.
- EMA(25): 51.21 → منطقة دعم قوية.
- EMA(99): 44.17 → المقاومة المتوسطة الأجل أصبحت الآن دعمًا.
- EMA(200): 44.69 → تم تأكيد كسر المقاومة على المدى الطويل.
- RSI(6): 87.56 → داخل منطقة المبالغ في الشراء، مما يشير إلى طلب قوي لكن بحذر من الانخفاضات التصحيحية.
- MACD: DIF 7.94 > DEA 4.80 → MACD إيجابي (3.15) يدل على استمرار الاتجاه.
- أشرطة بولينجر: السعر كسر فوق الحد الأعلى (74.39) → زيادة في التقلبات، كسر المقاومة جارٍ.
🎯 استراتيجية التداول في العقود الآجلة
بالنسبة لزوج DASH/USDT الآجل، فكر في الدخول في صفقة شراء حول 74.50 – 76.00 دولارًا، والهدف هو منطقة الربح القصيرة الأجل من 80.00 – 85.00 دولار.
استخدم رافعة مالية من 3 إلى 5 أضعاف لضمان التعرض المحدود، وحدد وقف الخسارة تحت 72.00 دولارًا لإدارة المخاطر.
يُشير كسر داش لكل من المتوسطات المتحركة الرئيسية وأشرطة بولينجر إلى زخم قوي واهتمام من المتداولين. مثالي للتداول السريع، أو التداول بناءً على الزخم، أو استراتيجيات اتباع الاتجاه.
👉 اضغط على الرسم البياني أدناه لفتح صفقة آجلة على بانانس.
👉 تداول الكسر – اربح بينما تتسارع داش!
#BTC100kNext? $BTC
{future}(BTCUSDT)
$ETH
{future}(ETHUSDT)
$DASH
{future}(DASHUSDT)
⚡ العقود الآجلة DASH/USDT – ارتفاع داش بنسبة +27.67%، زخم كسر المقاومة يهيمن
تتصاعد داش ($DASH ) بزخم صعودي قوي، وتُتداول حاليًا عند 75.95 دولارًا، بارتفاع نسبته +27.67% خلال الـ24 ساعة الماضية. وبحجم تداول ضخم قدره 1.47 مليار دولار من USDT، فإن DASH تُعد واحدة من أكثر الأصول حركة في السوق حاليًا.
📊 نظرة تقنية
- EMA(7): 64.51 → السعر أعلى بكثير من المتوسط القصير الأجل، ما يؤكد زخمًا صعوديًا قويًا.
- EMA(25): 51.21 → منطقة دعم قوية.
- EMA(99): 44.17 → المقاومة المتوسطة الأجل أصبحت الآن دعمًا.
- EMA(200): 44.69 → تم تأكيد كسر المقاومة على المدى الطويل.
- RSI(6): 87.56 → داخل منطقة المبالغ في الشراء، مما يشير إلى طلب قوي لكن بحذر من الانخفاضات التصحيحية.
- MACD: DIF 7.94 > DEA 4.80 → MACD إيجابي (3.15) يدل على استمرار الاتجاه.
- أشرطة بولينجر: السعر كسر فوق الحد الأعلى (74.39) → زيادة في التقلبات، كسر المقاومة جارٍ.
🎯 استراتيجية التداول في العقود الآجلة
بالنسبة لزوج DASH/USDT الآجل، فكر في الدخول في صفقة شراء حول 74.50 – 76.00 دولارًا، والهدف هو منطقة الربح القصيرة الأجل من 80.00 – 85.00 دولار.
استخدم رافعة مالية من 3 إلى 5 أضعاف لضمان التعرض المحدود، وحدد وقف الخسارة تحت 72.00 دولارًا لإدارة المخاطر.
يُشير كسر داش لكل من المتوسطات المتحركة الرئيسية وأشرطة بولينجر إلى زخم قوي واهتمام من المتداولين. مثالي للتداول السريع، أو التداول بناءً على الزخم، أو استراتيجيات اتباع الاتجاه.
👉 اضغط على الرسم البياني أدناه لفتح صفقة آجلة على بانانس.
👉 تداول الكسر – اربح بينما تتسارع داش!
#BTC100kNext? $BTC
$ETH
$DASH
2
127
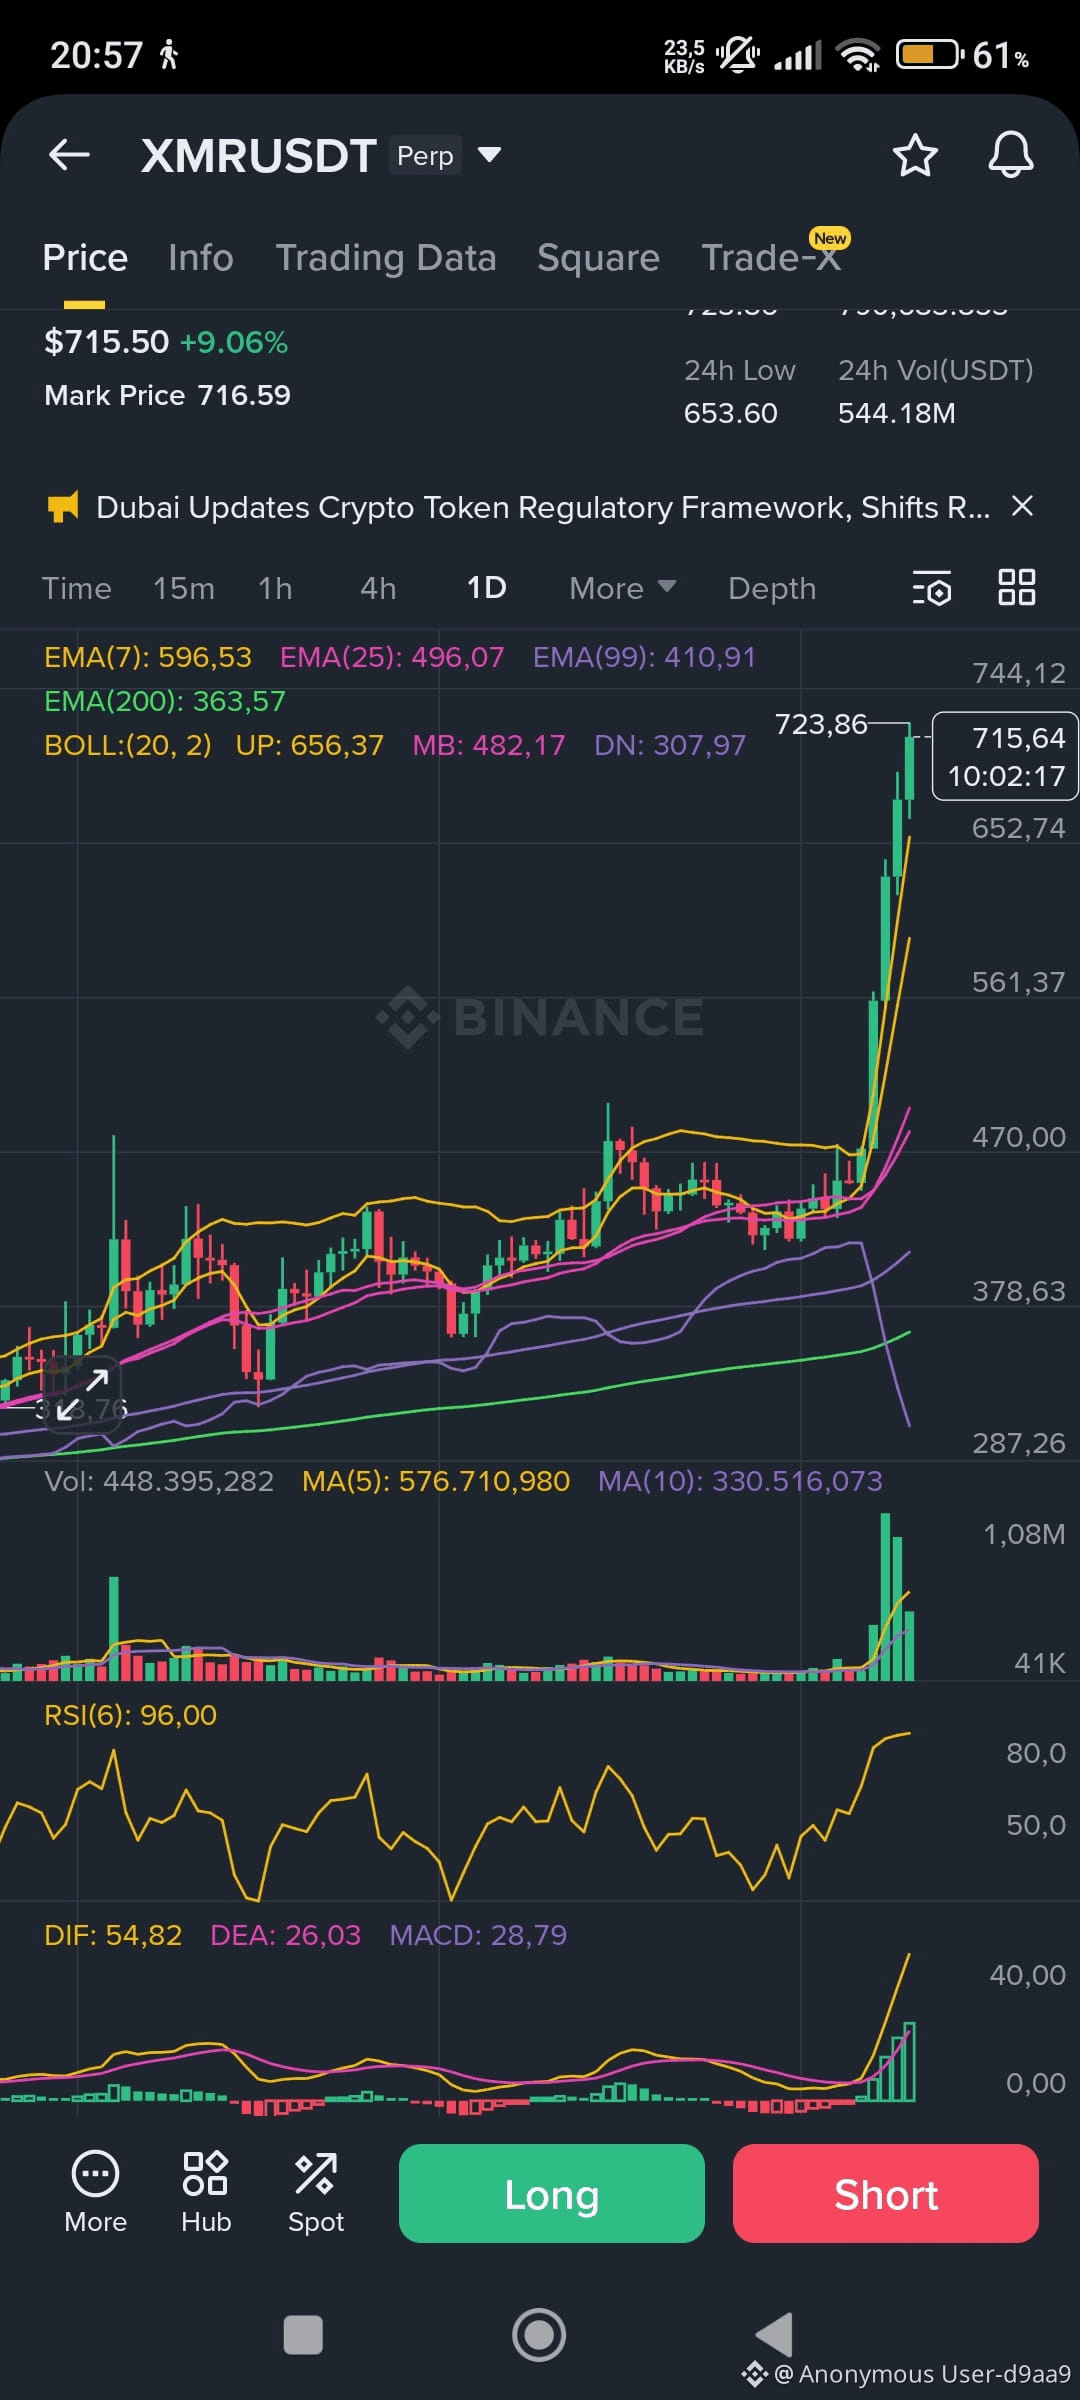
🕵️ عقود XMR/USDT المستقبلية – انفجار مونرو بـ +9.06٪، زخم كسر المقاومة في كامل نشاطه
تتصاعد عملة مونرو ($XMR) اليوم، حيث تُباع حالياً بسعر 715.50 دولار، بزيادة قدرها +9.06٪ خلال الـ 24 ساعة الماضية. مع حجم ضخم قدره 544.18 مليون دولار من USDT، تُظهر XMR واحدة من أقوى التوجهات الصاعدة في السوق.
📊 نظرة فنية
- EMA(7): 596.53 → السعر بعيد عن المتوسط القصير الأجل، مما يؤكد زخماً قوياً.
- EMA(25): 496.07 → منطقة دعم قوية.
- EMA(99): 410.91 → المقاومة المتوسطة الأجل انتقلت الآن إلى دعم.
- EMA(200): 363.57 → تم تأكيد الكسر الطويل الأجل.
- RSI(6): 96.00 → مفرط الشراء بشكل كبير، لكن الزخم لا يزال عدوانياً.
- MACD: DIF 54.82 > DEA 26.03 → MACD موجب (28.79) يشير إلى استمرار الاتجاه المتفجر.
- أشرطة بولينجر: كسر السعر فوق الحد الأعلى (656.37) → كسر ارتفاع التقلبات قيد التنفيذ.
🎯 استراتيجية تداول العقود المستقبلية
بالنسبة لعقود XMR/USDT المستقبلية، فكر في الدخول في مركز طويل عند مستوى 710 – 716 دولار، مع استهداف منطقة ربح قصيرة الأجل من 735 – 750 دولار.
استخدم رافعة مالية من 3–5 أضعاف لضمان التعرض المُتحكم به، وحدد وقف الخسارة تحت 695 دولاراً لإدارة المخاطر.
يُشير كسر مونرو لأعلى جميع مستويات EMA الرئيسية وأشرطة بولينجر المقاومة إلى اهتمام مؤسسي قوي وزخم قوي. مناسب تماماً للتداول السريع، أو التداول بناءً على الزخم، أو الاستراتيجيات التبعية للاتجاه.
👉 اضغط على الرسم البياني أدناه لفتح مركز عقود مستقبلية على بانينس.
👉 استمتع بالانفجار – اربح أثناء هروب مونرو!
#BTC100kNext? $BTC
{future}(BTCUSDT)
$ETH
{future}(ETHUSDT)
$XMR
{future}(XMRUSDT)
🕵️ عقود XMR/USDT المستقبلية – انفجار مونرو بـ +9.06٪، زخم كسر المقاومة في كامل نشاطه
تتصاعد عملة مونرو ($XMR ) اليوم، حيث تُباع حالياً بسعر 715.50 دولار، بزيادة قدرها +9.06٪ خلال الـ 24 ساعة الماضية. مع حجم ضخم قدره 544.18 مليون دولار من USDT، تُظهر XMR واحدة من أقوى التوجهات الصاعدة في السوق.
📊 نظرة فنية
- EMA(7): 596.53 → السعر بعيد عن المتوسط القصير الأجل، مما يؤكد زخماً قوياً.
- EMA(25): 496.07 → منطقة دعم قوية.
- EMA(99): 410.91 → المقاومة المتوسطة الأجل انتقلت الآن إلى دعم.
- EMA(200): 363.57 → تم تأكيد الكسر الطويل الأجل.
- RSI(6): 96.00 → مفرط الشراء بشكل كبير، لكن الزخم لا يزال عدوانياً.
- MACD: DIF 54.82 > DEA 26.03 → MACD موجب (28.79) يشير إلى استمرار الاتجاه المتفجر.
- أشرطة بولينجر: كسر السعر فوق الحد الأعلى (656.37) → كسر ارتفاع التقلبات قيد التنفيذ.
🎯 استراتيجية تداول العقود المستقبلية
بالنسبة لعقود XMR/USDT المستقبلية، فكر في الدخول في مركز طويل عند مستوى 710 – 716 دولار، مع استهداف منطقة ربح قصيرة الأجل من 735 – 750 دولار.
استخدم رافعة مالية من 3–5 أضعاف لضمان التعرض المُتحكم به، وحدد وقف الخسارة تحت 695 دولاراً لإدارة المخاطر.
يُشير كسر مونرو لأعلى جميع مستويات EMA الرئيسية وأشرطة بولينجر المقاومة إلى اهتمام مؤسسي قوي وزخم قوي. مناسب تماماً للتداول السريع، أو التداول بناءً على الزخم، أو الاستراتيجيات التبعية للاتجاه.
👉 اضغط على الرسم البياني أدناه لفتح مركز عقود مستقبلية على بانينس.
👉 استمتع بالانفجار – اربح أثناء هروب مونرو!
#BTC100kNext? $BTC
$ETH
$XMR
2
244
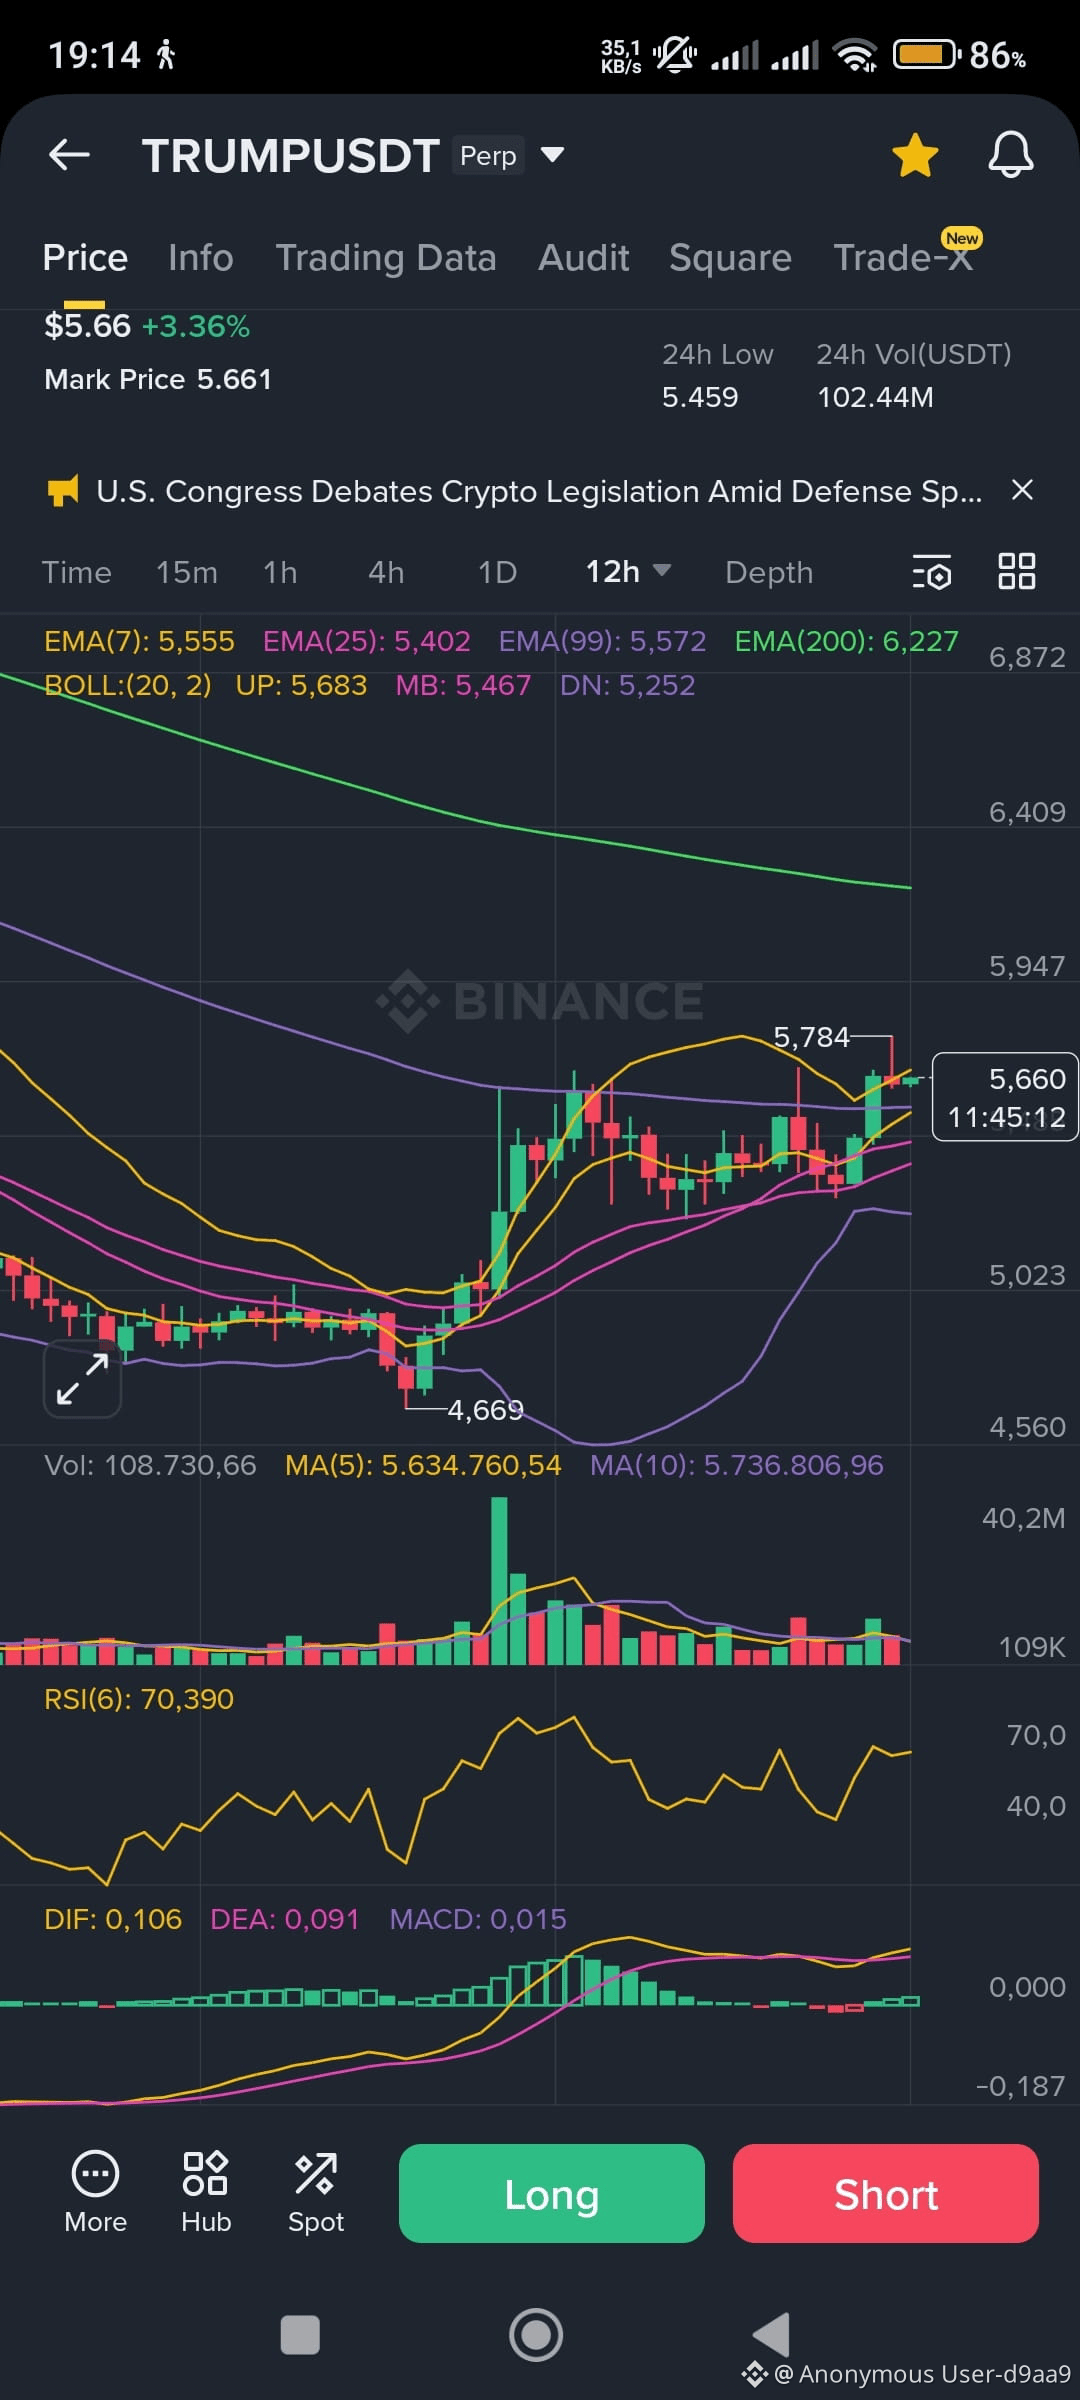
🇺🇸 ترومب/USDT المستقبلية – يزداد الدفع مع اقتراب السعر من المقاومة
يكتسب ترومب زخمًا اليوم، ويتم تداوله حاليًا عند 5.66 دولار، بزيادة قدرها +3.36% خلال الـ24 ساعة الماضية. وبحجم يومي قدره 102.44 مليون دولار USDT، يجذب هذا الرمز المرتبط بالسياسة المتداولين قصيري الأجل الذين يبحثون عن استغلال التقلبات.
📊 نظرة فنية
- EMA(7): 5.555 → السعر يحافظ على مستوى أعلى من المتوسط القصير الأجل، مما يؤكد زخمًا صعوديًا.
- EMA(25): 5.402 → منطقة دعم قوية.
- EMA(99): 5.572 → المقاومة المتوسطة الأجل أصبحت دعمًا الآن.
- EMA(200): 6.227 → الهدف المقاومة طويلة الأجل.
- RSI(6): 70.39 → دخلت منطقة المبالغة في الشراء، لكنها ما زالت ترتفع.
- MACD: DIF 0.106 > DEA 0.091 → MACD موجب (0.015) يشير إلى استمرار الاتجاه الصعودي.
- أشرطة بولينجر: السعر يقترب من الحد العلوي (5.683) → قد يحدث كسر أو ارتداد قصير الأجل.
🎯 استراتيجية التداول في العقود الآجلة
بالنسبة لزوج ترومب/USDT الآجلة، فكر في دخول مركز طويل عند مستوى 5.62 – 5.66 دولار، مستهدفًا منطقة ربح قصيرة الأجل من 5.75 – 5.85 دولار.
استخدم رافعة مالية من 3 إلى 5 أضعاف للتحكم في التعرض، وحدد وقف الخسارة تحت 5.55 دولار لإدارة المخاطر.
الحجم القوي وتكوين التحليل الفني لترومب يجعله مناسبًا للتداول بناءً على الزخم والسكالبينغ. يمكن للمتداولين الاستفادة من التحركات السريعة في السعر مع الحفاظ على سيطرة صارمة على المخاطر.
👉 اضغط على الرسم البياني أدناه لفتح مركز آجل على بانانس.
👉 تداول الكسر – اربح أثناء ارتفاع ترومب!#MarketRebound $BTC $ETH $TRUMP
1
97
عرض الترجمة
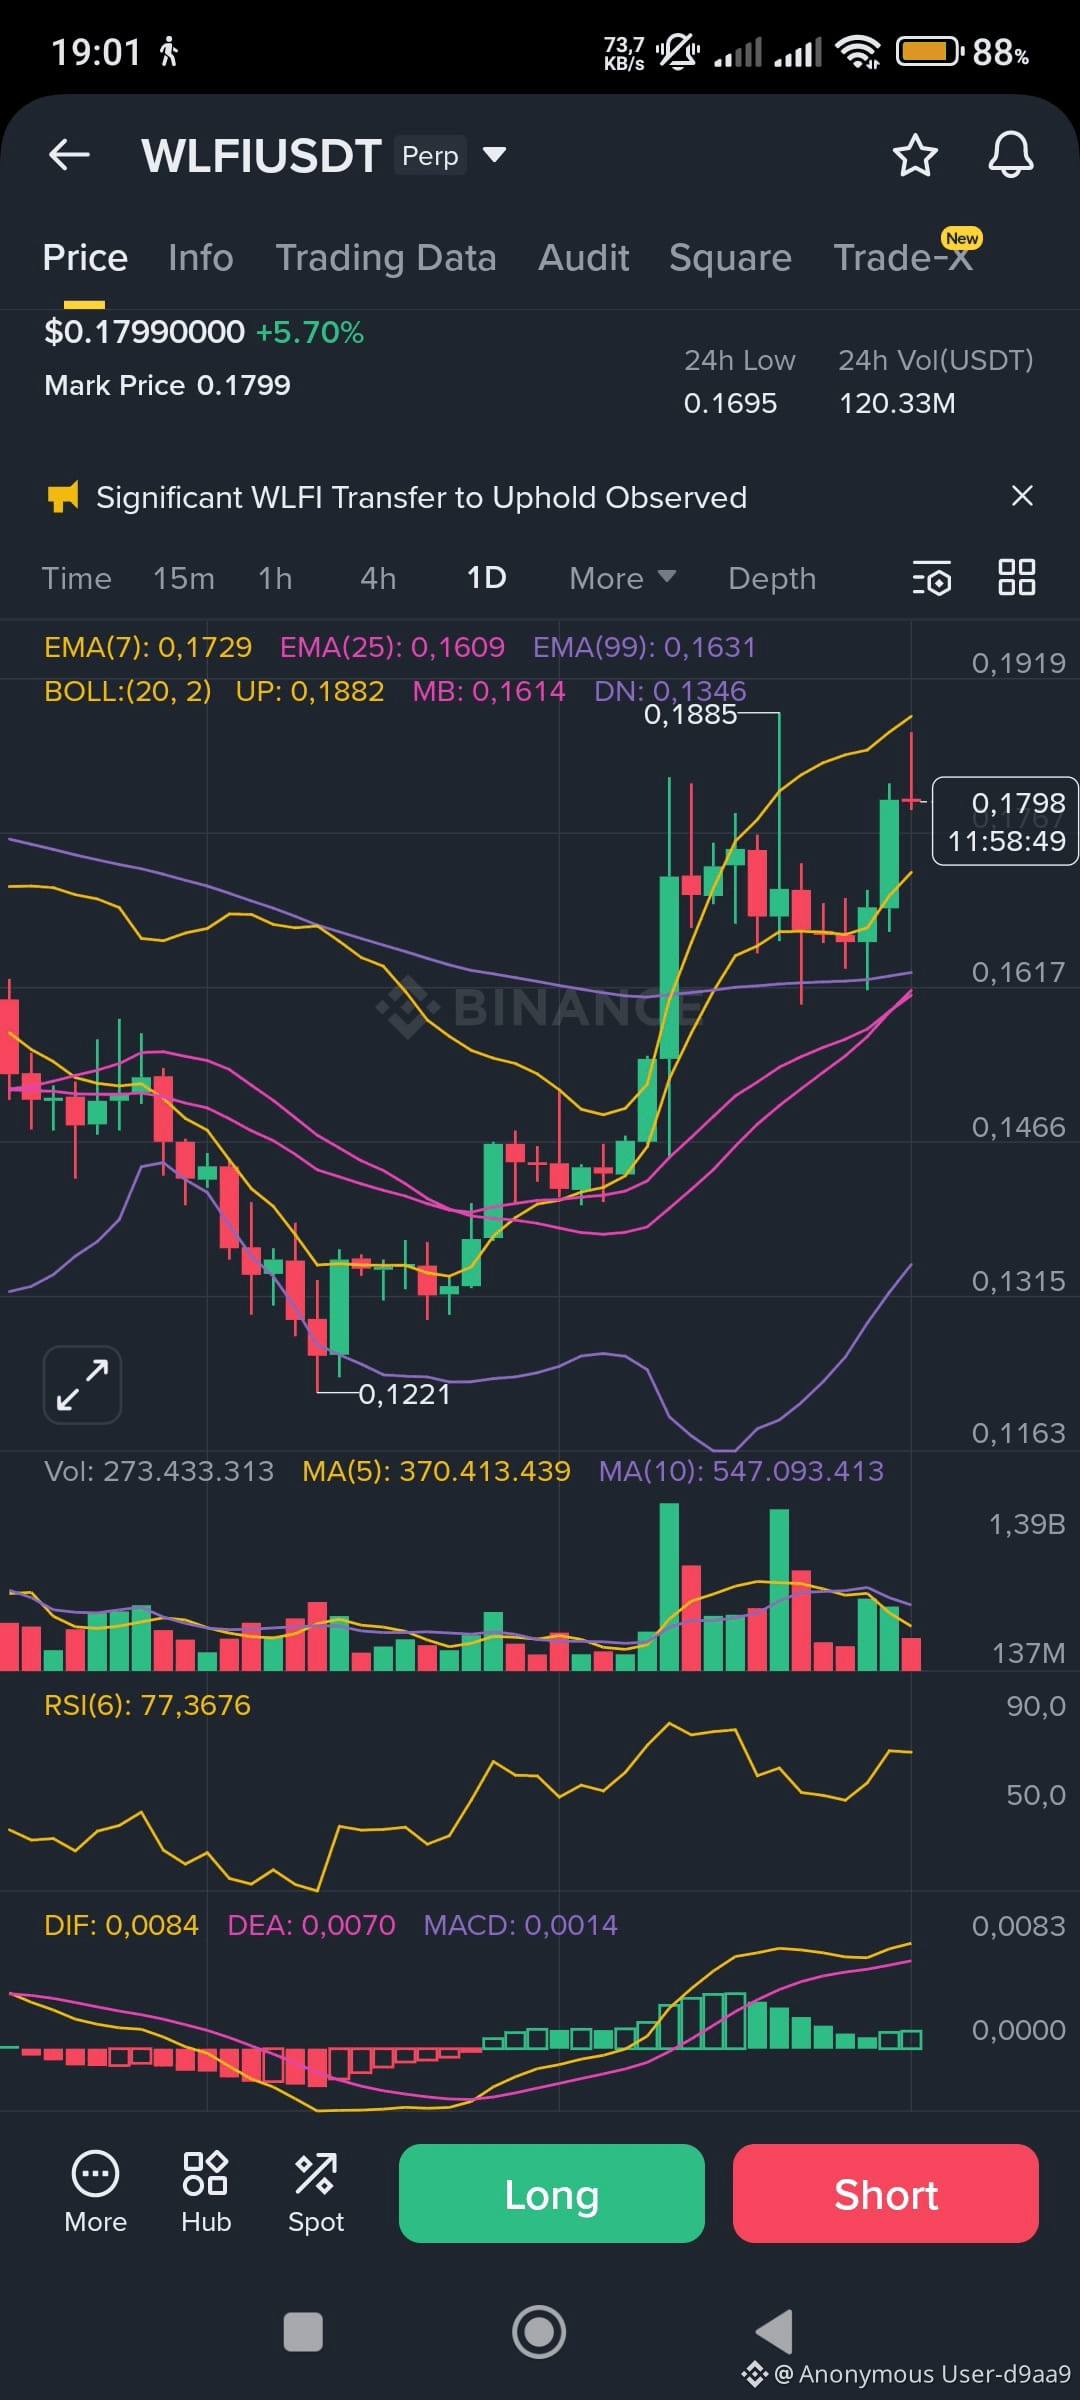
🚀 WLFI/USDT Futures – Strong Momentum, Ready to Challenge Resistance
WLFI is gaining traction today, currently trading at $0.1799, up +5.70% in the last 24 hours. With a daily volume of $120.33M USDT, this altcoin is drawing attention from short-term traders looking to capitalize on volatility.
📊 Technical Overview
- EMA(7): 0.1729 → Price is holding above short-term average, confirming bullish momentum.
- EMA(25): 0.1609 → Strong support zone.
- EMA(99): 0.1631 → Mid-term resistance now flipped to support.
- RSI(6): 77.37 → Entering overbought territory, but still climbing.
- MACD: DIF 0.0084 > DEA 0.0070 → Positive MACD (0.0014) signals continuation of uptrend.
- Bollinger Bands: Price approaching upper band (0.1882) → Possible breakout or short-term pullback.
🎯 Futures Trading Strategy
For WLFI/USDT Futures, consider entering a long position around $0.177 – $0.180, targeting a short-term profit zone of $0.186 – $0.190.
Use 3–5x leverage for controlled exposure, and set a stop-loss below $0.174 to manage risk.
WLFI’s strong volume and technical setup make it ideal for momentum trading and scalping. Traders can capitalize on quick price movements while maintaining tight risk control.
👉 Tap the chart below to open a Futures position on Binance.
👉 Trade the breakout – earn while WLFI surges!
#MarketRebound $BTC $ETH $WLFI
1
95
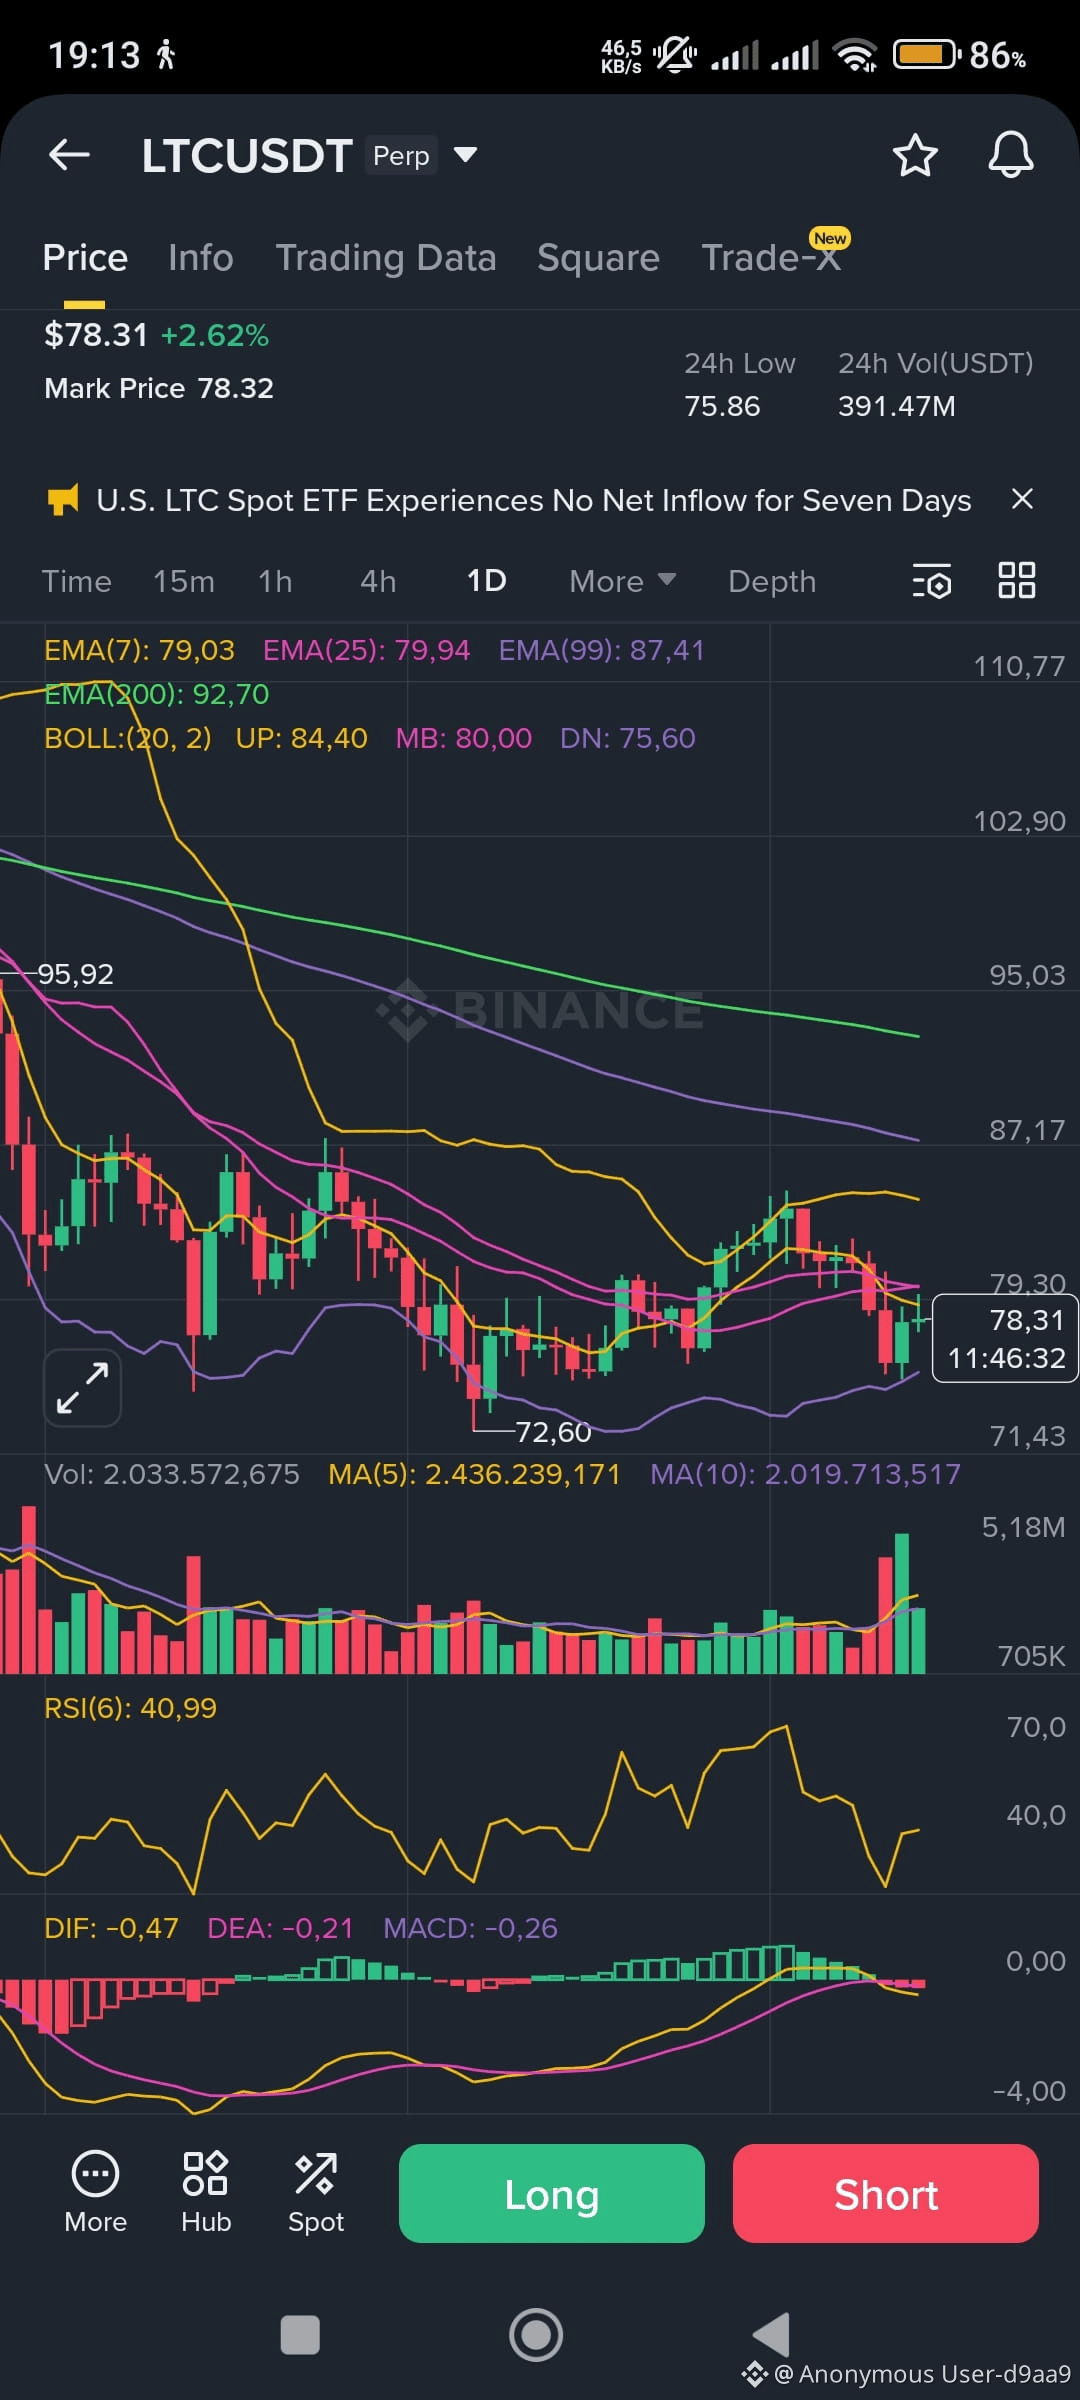
🪙 LTC/USDT مستقبلي – يحافظ لايتكوين على الدعم، ويستعد للانتعاش
يتم تداول لايتكوين ($LTC) حاليًا بسعر 78.31 دولار، بزيادة 2.62٪ خلال الـ 24 ساعة الماضية. وعلى الرغم من التدفقات المنخفضة للصناديق المتداولة في البورصة (ETF)، تُظهر أسواق العقود الآجلة علامات استقرار، حيث بلغ الحجم اليومي 391.47 مليون دولار من USDT.
📊 نظرة فنية
- EMA(7): 79.03 → السعر قليلاً تحت المتوسط القصير الأجل، ما يشير إلى موقف حذر.
- EMA(25): 79.94 → منطقة مقاومة للرصد.
- EMA(99): 87.41 → الهدف المقاوم المتوسط الأجل.
- EMA(200): 92.70 → السقف الطويل الأجل.
- RSI(6): 40.99 → المنطقة المحايدة، هناك مساحة للارتفاع.
- MACD: DIF -0.47 < DEA -0.21 → MACD سالب (-0.26) يشير إلى زخم ضعيف، لكنه يتجه نحو التسطح.
- نطاق بولينجر: السعر قرب الحد الأدنى (75.60)، والحد المتوسط عند 80.00 → تكوين محتمل للارتداد.
🎯 استراتيجية التداول في العقود الآجلة
بالنسبة لزوج LTC/USDT الآجل، فكر في دخول صفقة شراء عند مستوى 77.50 – 78.30، مع استهداف منطقة ربح قصيرة الأجل بين 80.50 – 82.00.
استخدم رافعة مالية من 3 إلى 5 أضعاف للحفاظ على التعرض المسيطر، وحدد وقف الخسارة تحت 76.00 لإدارة المخاطر.
يُظهر LTC علامات على توقف الهبوط بالقرب من مناطق الدعم. مع استقرار الحجم وانكماش نطاق بولينجر، قد يكون ارتداد قصير الأجل قادمًا.
👉 اضغط على الرسم البياني أدناه لفتح صفقة آجلة على بانينس.
👉 تداول الانعكاس – اربح أثناء تعافي لايتكوين!
#MarketRebound $BTC $ETH $LTC
🪙 LTC/USDT مستقبلي – يحافظ لايتكوين على الدعم، ويستعد للانتعاش
يتم تداول لايتكوين ($LTC ) حاليًا بسعر 78.31 دولار، بزيادة 2.62٪ خلال الـ 24 ساعة الماضية. وعلى الرغم من التدفقات المنخفضة للصناديق المتداولة في البورصة (ETF)، تُظهر أسواق العقود الآجلة علامات استقرار، حيث بلغ الحجم اليومي 391.47 مليون دولار من USDT.
📊 نظرة فنية
- EMA(7): 79.03 → السعر قليلاً تحت المتوسط القصير الأجل، ما يشير إلى موقف حذر.
- EMA(25): 79.94 → منطقة مقاومة للرصد.
- EMA(99): 87.41 → الهدف المقاوم المتوسط الأجل.
- EMA(200): 92.70 → السقف الطويل الأجل.
- RSI(6): 40.99 → المنطقة المحايدة، هناك مساحة للارتفاع.
- MACD: DIF -0.47 < DEA -0.21 → MACD سالب (-0.26) يشير إلى زخم ضعيف، لكنه يتجه نحو التسطح.
- نطاق بولينجر: السعر قرب الحد الأدنى (75.60)، والحد المتوسط عند 80.00 → تكوين محتمل للارتداد.
🎯 استراتيجية التداول في العقود الآجلة
بالنسبة لزوج LTC/USDT الآجل، فكر في دخول صفقة شراء عند مستوى 77.50 – 78.30، مع استهداف منطقة ربح قصيرة الأجل بين 80.50 – 82.00.
استخدم رافعة مالية من 3 إلى 5 أضعاف للحفاظ على التعرض المسيطر، وحدد وقف الخسارة تحت 76.00 لإدارة المخاطر.
يُظهر LTC علامات على توقف الهبوط بالقرب من مناطق الدعم. مع استقرار الحجم وانكماش نطاق بولينجر، قد يكون ارتداد قصير الأجل قادمًا.
👉 اضغط على الرسم البياني أدناه لفتح صفقة آجلة على بانينس.
👉 تداول الانعكاس – اربح أثناء تعافي لايتكوين!
#MarketRebound $BTC $ETH $LTC
1
66
عرض الترجمة
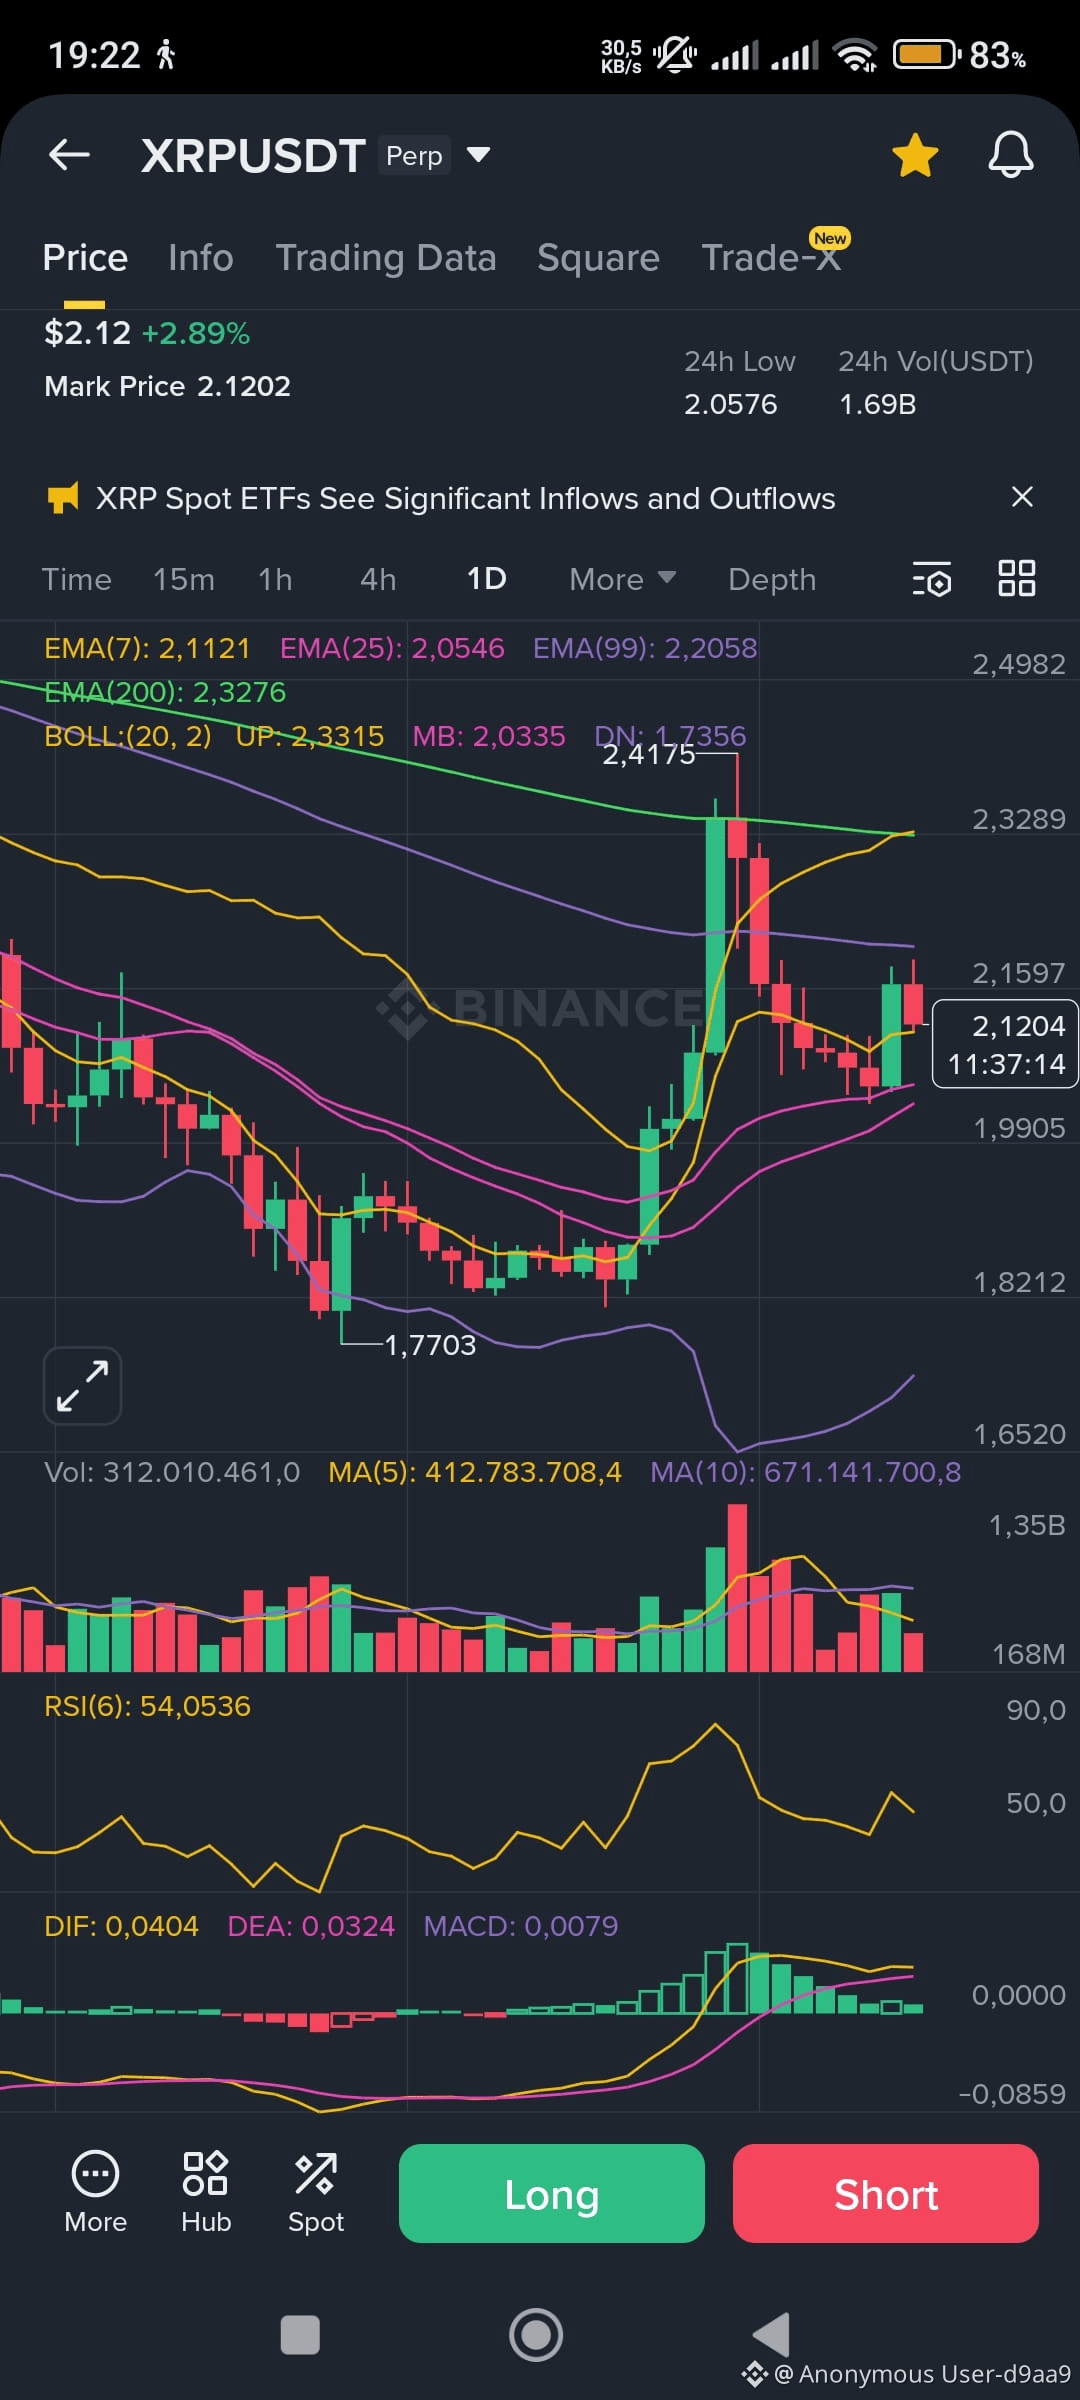
💎 XRP/USDT Futures – Momentum Builds as XRP Climbs 3.71%
Ripple ($XRP) is gaining traction, currently trading at $2.15, up +3.71% in the last 24 hours. With a strong daily volume of $1.59B USDT, XRP is attracting short-term traders looking to ride the wave.
📊 Technical Overview
- EMA(7): 2.1101 → Price is holding above short-term average, confirming bullish momentum.
- EMA(50): 2.0487 → Acting as support during this rally.
- EMA(99): 2.0736 → Mid-term resistance now flipped to support.
- EMA(200): 2.2106 → Long-term resistance target.
- RSI(6): 63.20 → Neutral zone, room for further upside.
- MACD: DIF 0.0249 < DEA 0.0329 → Slight bearish divergence, but trend remains intact.
- Bollinger Bands: Price near middle band (2.1452), upper band at 2.3349 → Potential breakout zone.
🎯 Futures Trading Strategy
For XRP/USDT Futures, consider entering a long position around $2.13 – $2.15, targeting a short-term profit zone of $2.22 – $2.28.
Use 3–5x leverage for controlled exposure, and set a stop-loss below $2.09 to manage risk.
XRP’s volume and price structure make it ideal for momentum trading and scalping. Traders can capitalize on quick price movements while maintaining tight risk control.
👉 Tap the chart below to open a Futures position on Binance.
👉 Trade the momentum – earn while XRP moves!
#BTC100kNext? $BTC $ETH $XRP
💎 XRP/USDT Futures – Momentum Builds as XRP Climbs 3.71%
Ripple ($XRP ) is gaining traction, currently trading at $2.15, up +3.71% in the last 24 hours. With a strong daily volume of $1.59B USDT, XRP is attracting short-term traders looking to ride the wave.
📊 Technical Overview
- EMA(7): 2.1101 → Price is holding above short-term average, confirming bullish momentum.
- EMA(50): 2.0487 → Acting as support during this rally.
- EMA(99): 2.0736 → Mid-term resistance now flipped to support.
- EMA(200): 2.2106 → Long-term resistance target.
- RSI(6): 63.20 → Neutral zone, room for further upside.
- MACD: DIF 0.0249 < DEA 0.0329 → Slight bearish divergence, but trend remains intact.
- Bollinger Bands: Price near middle band (2.1452), upper band at 2.3349 → Potential breakout zone.
🎯 Futures Trading Strategy
For XRP/USDT Futures, consider entering a long position around $2.13 – $2.15, targeting a short-term profit zone of $2.22 – $2.28.
Use 3–5x leverage for controlled exposure, and set a stop-loss below $2.09 to manage risk.
XRP’s volume and price structure make it ideal for momentum trading and scalping. Traders can capitalize on quick price movements while maintaining tight risk control.
👉 Tap the chart below to open a Futures position on Binance.
👉 Trade the momentum – earn while XRP moves!
#BTC100kNext? $BTC $ETH $XRP
6
112
سجّل الدخول لاستكشاف المزيد من المُحتوى
انضم إلى مُستخدمي العملات الرقمية حول العالم على Binance Square
⚡️ احصل على أحدث المعلومات المفيدة عن العملات الرقمية.
💬 موثوقة من قبل أكبر منصّة لتداول العملات الرقمية في العالم.
👍 اكتشف الرؤى الحقيقية من صنّاع المُحتوى الموثوقين.
البريد الإلكتروني / رقم الهاتف
المواضيع الرائجة
WithdrawalsBack: 15 networks live
1,783 مشاهدات
61 يقومون بالنقاش
تحديث أخبار Binance | Binance تعيد فتح عمليات السحب لـ BTC وETH وUSDT وغيرها عبر 15 شبكة، محققةً موعدها المستهدف يوم الأحد
Binance News
·33 إعجاب
·12.6k مشاهدات
BinanceUpdatesProofofReservesAddresses
51,215 مشاهدات
964 يقومون بالنقاش
BinanceToResumePhaseOneOfWithdrawals
85,612 مشاهدات
1,189 يقومون بالنقاش