

smart Crypto Hub 1
28 منشورات

smart Crypto Hub 1
إبلاغ
حظر المُستخدم
0 تتابع
9 المتابعون
16 إعجاب
منشورات
علم نفس الشموع الشمعدانية::
🟢 شمعة صاعدة قوية: المشترون لديهم السيطرة الكاملة → قوة شراء.
🟢 شمعة صاعدة صغيرة: المشترون في السيطرة → قد يستمر الاتجاه الصاعد.
🟢 ذيل علوي طويل: البائعون يكتسبون القوة → احتمال حدوث انعكاس/تصحيح.
🟢 ذيل سفلي طويل: المشترون يفقدون القوة → قد تزداد ضغوط البيع.
علم نفس الشموع الشمعدانية::
🟢 شمعة صاعدة قوية: المشترون لديهم السيطرة الكاملة → قوة شراء.
🟢 شمعة صاعدة صغيرة: المشترون في السيطرة → قد يستمر الاتجاه الصاعد.
🟢 ذيل علوي طويل: البائعون يكتسبون القوة → احتمال حدوث انعكاس/تصحيح.
🟢 ذيل سفلي طويل: المشترون يفقدون القوة → قد تزداد ضغوط البيع.
🟢 شمعة صاعدة قوية: المشترون لديهم السيطرة الكاملة → قوة شراء.
🟢 شمعة صاعدة صغيرة: المشترون في السيطرة → قد يستمر الاتجاه الصاعد.
🟢 ذيل علوي طويل: البائعون يكتسبون القوة → احتمال حدوث انعكاس/تصحيح.
🟢 ذيل سفلي طويل: المشترون يفقدون القوة → قد تزداد ضغوط البيع.

67
مقالة
تحديث سوق البيتكوين — الثيران ما زالت قوية.📊 تحديث سوق البيتكوين — الثيران ما زالت قوية
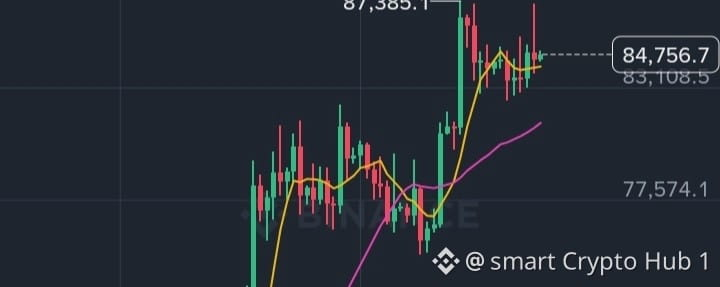
يتداول البيتكوين حاليًا حول 84,756 دولارًا، مُظهرًا صمودًا بعد موجته الصاعدة الأخيرة باتجاه 87,385 دولارًا.
لا يزال الرسم البياني صاعدًا على إطار 1D. يتداول البيتكوين فوق متوسطه المتحرك MA(7) عند 84,166 دولارًا، وMA(25) عند 81,387 دولارًا، وMA(99) عند 71,122 دولارًا، ما يشير إلى أن الاتجاه الأوسع لا يزال في صالح الثيران.
ومع ذلك، يواجه البيتكوين مقاومة حول نطاق 87 ألفًا إلى 88 ألف دولار. قد يؤدي اختراق قوي فوق هذه المنطقة إلى فتح المجال لموجة صعودية أخرى، بينما قد يؤدي فقدان منطقة الدعم 83 ألفًا إلى 81 ألف دولار إلى تصحيح أعمق.
تحديث سوق البيتكوين — الثيران ما زالت قوية.
📊 تحديث سوق البيتكوين — الثيران ما زالت قوية
يتداول البيتكوين حاليًا حول 84,756 دولارًا، مُظهرًا صمودًا بعد موجته الصاعدة الأخيرة باتجاه 87,385 دولارًا.
لا يزال الرسم البياني صاعدًا على إطار 1D. يتداول البيتكوين فوق متوسطه المتحرك MA(7) عند 84,166 دولارًا، وMA(25) عند 81,387 دولارًا، وMA(99) عند 71,122 دولارًا، ما يشير إلى أن الاتجاه الأوسع لا يزال في صالح الثيران.
ومع ذلك، يواجه البيتكوين مقاومة حول نطاق 87 ألفًا إلى 88 ألف دولار. قد يؤدي اختراق قوي فوق هذه المنطقة إلى فتح المجال لموجة صعودية أخرى، بينما قد يؤدي فقدان منطقة الدعم 83 ألفًا إلى 81 ألف دولار إلى تصحيح أعمق.
يتداول البيتكوين حاليًا حول 84,756 دولارًا، مُظهرًا صمودًا بعد موجته الصاعدة الأخيرة باتجاه 87,385 دولارًا.
لا يزال الرسم البياني صاعدًا على إطار 1D. يتداول البيتكوين فوق متوسطه المتحرك MA(7) عند 84,166 دولارًا، وMA(25) عند 81,387 دولارًا، وMA(99) عند 71,122 دولارًا، ما يشير إلى أن الاتجاه الأوسع لا يزال في صالح الثيران.
ومع ذلك، يواجه البيتكوين مقاومة حول نطاق 87 ألفًا إلى 88 ألف دولار. قد يؤدي اختراق قوي فوق هذه المنطقة إلى فتح المجال لموجة صعودية أخرى، بينما قد يؤدي فقدان منطقة الدعم 83 ألفًا إلى 81 ألف دولار إلى تصحيح أعمق.
68
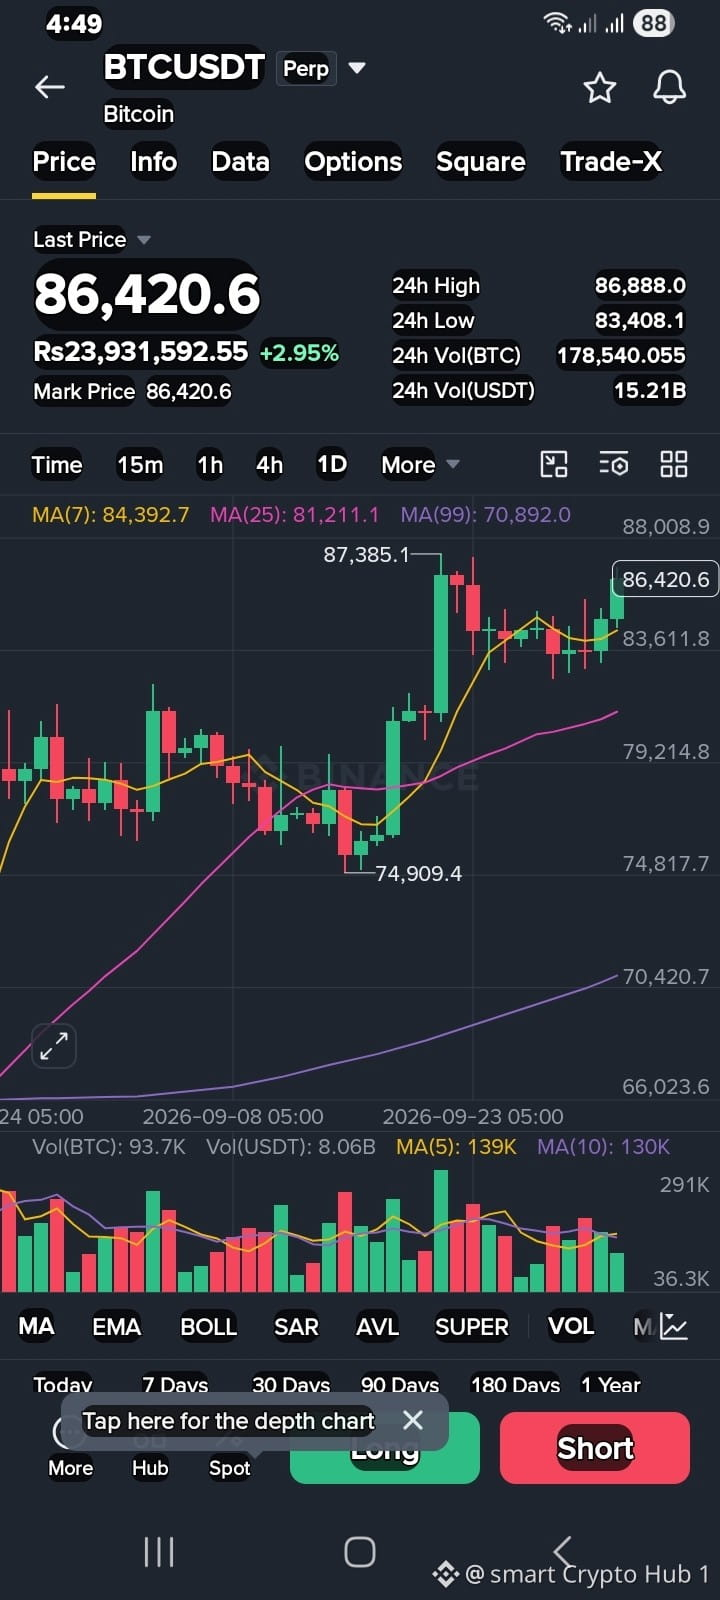
تحليل مخطط BTCUSDT — 1D
البنية الحالية تبدو صعودية، لكن BTC يقترب من منطقة مقاومة رئيسية.
السعر الحالي: 86,420
أعلى سعر خلال 24 ساعة: 86,888
قمة تأرجح رئيسية: 87,385
MA(7): 84,393
MA(25): 81,211
MA(99): 70,892
البنية
صنع BTC حركة قوية من حوالي 74,900 إلى 87,385.
ثم توطّد السعر حول 83.6k–85k ودفعه ذلك لاحقًا للأعلى مرة أخرى.
السعر فوق جميع المتوسطات الثلاثة المتحركة، وهذا يدعم البنية الصعودية.
العائق الفوري هو 87,385–88,000.
إعدادات محتملة
1. شراء اختراق انتظر إغلاقًا يوميًا فوق 87,385، ويفضّل أن يتبعه إعادة اختبار ناجحة.
منطقة الدخول: حوالي 87,400–87,800 بعد التأكيد
إلغاء الإعداد: العودة إلى ما دون منطقة الاختراق/إعادة الاختبار
الهدف الأول على المخطط: حوالي 88,000
إن فشل الاختراق فسيُلغي هذا الإعداد.
2. شراء جِني/ارتداد إذا رفض السعر القمم ثم تراجع:
الدعم الأول: 84,300–84,400 (قرب MA7)
دعم أقوى: 83,600
دعم رئيسي: 81,200 (MA25)
سيرتّب رد فعل صعودي من إحدى هذه المناطق بنية أنظف بدل المطاردة عند 86.4k.
3. بيع/Short لا أنظر إلى سيناريو البيع إلا إذا أظهر BTC رفضًا واضحًا حول 87.4k–88k ثم كسر مرة أخرى تحت الدعم/منطقة التوطيد القريبة. أما البيع لمجرد أن السعر "مرتفع" فسيكون ضد البنية اليومية الحالية.
مستوياتي الرئيسية
المستوى/الدور88,000مقاومة فورية87,385مستوى اختراق رئيسي86,420السعر الحالي84,400MA7 / أول دعم83,612دعم محلي مهم81,211MA25 / دعم رئيسي74,909قاع تأرجح رئيسي
الخلاصة: المخطط يميل إلى بنية صعودية، لكن 87.4k–88k هي منطقة القرار. سأراقب ما إذا كان BTC سيكسر ويحافظ فوقها بدل افتراض أن الحركة ستستمر.
#BTCUSDTAnalysis #BTCUSDT.
$BTC
تحليل مخطط BTCUSDT — 1D
البنية الحالية تبدو صعودية، لكن BTC يقترب من منطقة مقاومة رئيسية.
السعر الحالي: 86,420
أعلى سعر خلال 24 ساعة: 86,888
قمة تأرجح رئيسية: 87,385
MA(7): 84,393
MA(25): 81,211
MA(99): 70,892
البنية
صنع BTC حركة قوية من حوالي 74,900 إلى 87,385.
ثم توطّد السعر حول 83.6k–85k ودفعه ذلك لاحقًا للأعلى مرة أخرى.
السعر فوق جميع المتوسطات الثلاثة المتحركة، وهذا يدعم البنية الصعودية.
العائق الفوري هو 87,385–88,000.
إعدادات محتملة
1. شراء اختراق انتظر إغلاقًا يوميًا فوق 87,385، ويفضّل أن يتبعه إعادة اختبار ناجحة.
منطقة الدخول: حوالي 87,400–87,800 بعد التأكيد
إلغاء الإعداد: العودة إلى ما دون منطقة الاختراق/إعادة الاختبار
الهدف الأول على المخطط: حوالي 88,000
إن فشل الاختراق فسيُلغي هذا الإعداد.
2. شراء جِني/ارتداد إذا رفض السعر القمم ثم تراجع:
الدعم الأول: 84,300–84,400 (قرب MA7)
دعم أقوى: 83,600
دعم رئيسي: 81,200 (MA25)
سيرتّب رد فعل صعودي من إحدى هذه المناطق بنية أنظف بدل المطاردة عند 86.4k.
3. بيع/Short لا أنظر إلى سيناريو البيع إلا إذا أظهر BTC رفضًا واضحًا حول 87.4k–88k ثم كسر مرة أخرى تحت الدعم/منطقة التوطيد القريبة. أما البيع لمجرد أن السعر "مرتفع" فسيكون ضد البنية اليومية الحالية.
مستوياتي الرئيسية
المستوى/الدور88,000مقاومة فورية87,385مستوى اختراق رئيسي86,420السعر الحالي84,400MA7 / أول دعم83,612دعم محلي مهم81,211MA25 / دعم رئيسي74,909قاع تأرجح رئيسي
الخلاصة: المخطط يميل إلى بنية صعودية، لكن 87.4k–88k هي منطقة القرار. سأراقب ما إذا كان BTC سيكسر ويحافظ فوقها بدل افتراض أن الحركة ستستمر.
#BTCUSDTAnalysis #BTCUSDT.
$BTC
البنية الحالية تبدو صعودية، لكن BTC يقترب من منطقة مقاومة رئيسية.
السعر الحالي: 86,420
أعلى سعر خلال 24 ساعة: 86,888
قمة تأرجح رئيسية: 87,385
MA(7): 84,393
MA(25): 81,211
MA(99): 70,892
البنية
صنع BTC حركة قوية من حوالي 74,900 إلى 87,385.
ثم توطّد السعر حول 83.6k–85k ودفعه ذلك لاحقًا للأعلى مرة أخرى.
السعر فوق جميع المتوسطات الثلاثة المتحركة، وهذا يدعم البنية الصعودية.
العائق الفوري هو 87,385–88,000.
إعدادات محتملة
1. شراء اختراق انتظر إغلاقًا يوميًا فوق 87,385، ويفضّل أن يتبعه إعادة اختبار ناجحة.
منطقة الدخول: حوالي 87,400–87,800 بعد التأكيد
إلغاء الإعداد: العودة إلى ما دون منطقة الاختراق/إعادة الاختبار
الهدف الأول على المخطط: حوالي 88,000
إن فشل الاختراق فسيُلغي هذا الإعداد.
2. شراء جِني/ارتداد إذا رفض السعر القمم ثم تراجع:
الدعم الأول: 84,300–84,400 (قرب MA7)
دعم أقوى: 83,600
دعم رئيسي: 81,200 (MA25)
سيرتّب رد فعل صعودي من إحدى هذه المناطق بنية أنظف بدل المطاردة عند 86.4k.
3. بيع/Short لا أنظر إلى سيناريو البيع إلا إذا أظهر BTC رفضًا واضحًا حول 87.4k–88k ثم كسر مرة أخرى تحت الدعم/منطقة التوطيد القريبة. أما البيع لمجرد أن السعر "مرتفع" فسيكون ضد البنية اليومية الحالية.
مستوياتي الرئيسية
المستوى/الدور88,000مقاومة فورية87,385مستوى اختراق رئيسي86,420السعر الحالي84,400MA7 / أول دعم83,612دعم محلي مهم81,211MA25 / دعم رئيسي74,909قاع تأرجح رئيسي
الخلاصة: المخطط يميل إلى بنية صعودية، لكن 87.4k–88k هي منطقة القرار. سأراقب ما إذا كان BTC سيكسر ويحافظ فوقها بدل افتراض أن الحركة ستستمر.
#BTCUSDTAnalysis #BTCUSDT.
$BTC
60
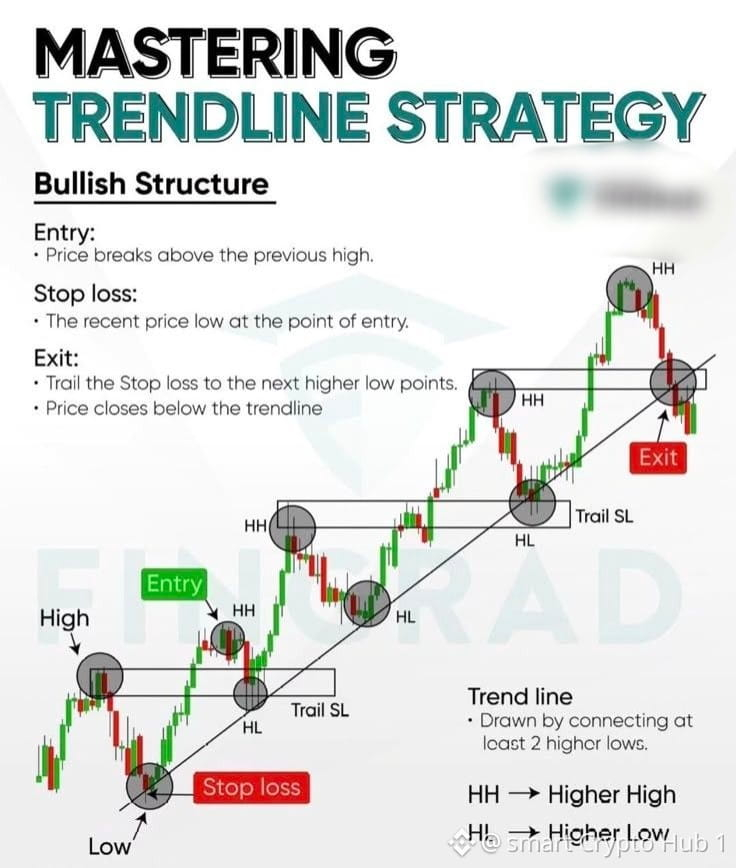
استراتيجية خط الاتجاه الصعودي – دليل كامل
1️⃣ تحديد الاتجاه أولاً
السوق في حالة صعود عندما:
يستمر في تحقيق قمم أعلى (HH)
يستمر في تحقيق قيعان أعلى (HL)
هذا يعني:
كل قمة جديدة أعلى من القمة السابقة.
كل قاع جديد أعلى من القاع السابق.
👉 هذا يدل على أن المشترين في السيطرة.
2️⃣ كيفية رسم خط الاتجاه
قم بربط ما لا يقل عن قيعان أعلى (HL) اثنين.
يجب أن يتحرك الخط لأعلى.
كلما احترم السعر خط الاتجاه أكثر، كان أقوى.
3️⃣ قواعد الدخول
✅ ادخل عندما:
يخترق السعر فوق القمة السابقة (كسر الهيكل)، أو
يرتد السعر من قاع أعلى مع شمعة صعودية قوية.
📌 انتظر دائمًا تأكيد الشمعة. لا تدخل مبكرًا.
4️⃣ مكان وقف الخسارة
🔴 ضع وقف الخسارة:
أسفل القاع الأعلى الأخير، أو
قليلاً أسفل خط الاتجاه.
⚠ لا تتداول أبدًا بدون وقف خسارة.
5️⃣ استراتيجية الخروج
✅ اتبع وقف خسارتك أسفل كل قاع أعلى جديد.
✅ اخرج إذا أغلق السعر أسفل خط الاتجاه.
✅ يمكنك أيضًا أخذ ربح جزئي عند 1:2 أو 1:3 نسبة المخاطر/العائد.
📊 قواعد تداول مهمة
أكد هيكل HH و HL أولاً.
تجنب الانهيارات الوهمية — انتظر إغلاق الشمعة.
خاطر فقط بنسبة 1–2% لكل صفقة.
يعمل بشكل أفضل في الأسواق التي تسير في اتجاه قوي.
استراتيجية خط الاتجاه الصعودي – دليل كامل
1️⃣ تحديد الاتجاه أولاً
السوق في حالة صعود عندما:
يستمر في تحقيق قمم أعلى (HH)
يستمر في تحقيق قيعان أعلى (HL)
هذا يعني:
كل قمة جديدة أعلى من القمة السابقة.
كل قاع جديد أعلى من القاع السابق.
👉 هذا يدل على أن المشترين في السيطرة.
2️⃣ كيفية رسم خط الاتجاه
قم بربط ما لا يقل عن قيعان أعلى (HL) اثنين.
يجب أن يتحرك الخط لأعلى.
كلما احترم السعر خط الاتجاه أكثر، كان أقوى.
3️⃣ قواعد الدخول
✅ ادخل عندما:
يخترق السعر فوق القمة السابقة (كسر الهيكل)، أو
يرتد السعر من قاع أعلى مع شمعة صعودية قوية.
📌 انتظر دائمًا تأكيد الشمعة. لا تدخل مبكرًا.
4️⃣ مكان وقف الخسارة
🔴 ضع وقف الخسارة:
أسفل القاع الأعلى الأخير، أو
قليلاً أسفل خط الاتجاه.
⚠ لا تتداول أبدًا بدون وقف خسارة.
5️⃣ استراتيجية الخروج
✅ اتبع وقف خسارتك أسفل كل قاع أعلى جديد.
✅ اخرج إذا أغلق السعر أسفل خط الاتجاه.
✅ يمكنك أيضًا أخذ ربح جزئي عند 1:2 أو 1:3 نسبة المخاطر/العائد.
📊 قواعد تداول مهمة
أكد هيكل HH و HL أولاً.
تجنب الانهيارات الوهمية — انتظر إغلاق الشمعة.
خاطر فقط بنسبة 1–2% لكل صفقة.
يعمل بشكل أفضل في الأسواق التي تسير في اتجاه قوي.
1️⃣ تحديد الاتجاه أولاً
السوق في حالة صعود عندما:
يستمر في تحقيق قمم أعلى (HH)
يستمر في تحقيق قيعان أعلى (HL)
هذا يعني:
كل قمة جديدة أعلى من القمة السابقة.
كل قاع جديد أعلى من القاع السابق.
👉 هذا يدل على أن المشترين في السيطرة.
2️⃣ كيفية رسم خط الاتجاه
قم بربط ما لا يقل عن قيعان أعلى (HL) اثنين.
يجب أن يتحرك الخط لأعلى.
كلما احترم السعر خط الاتجاه أكثر، كان أقوى.
3️⃣ قواعد الدخول
✅ ادخل عندما:
يخترق السعر فوق القمة السابقة (كسر الهيكل)، أو
يرتد السعر من قاع أعلى مع شمعة صعودية قوية.
📌 انتظر دائمًا تأكيد الشمعة. لا تدخل مبكرًا.
4️⃣ مكان وقف الخسارة
🔴 ضع وقف الخسارة:
أسفل القاع الأعلى الأخير، أو
قليلاً أسفل خط الاتجاه.
⚠ لا تتداول أبدًا بدون وقف خسارة.
5️⃣ استراتيجية الخروج
✅ اتبع وقف خسارتك أسفل كل قاع أعلى جديد.
✅ اخرج إذا أغلق السعر أسفل خط الاتجاه.
✅ يمكنك أيضًا أخذ ربح جزئي عند 1:2 أو 1:3 نسبة المخاطر/العائد.
📊 قواعد تداول مهمة
أكد هيكل HH و HL أولاً.
تجنب الانهيارات الوهمية — انتظر إغلاق الشمعة.
خاطر فقط بنسبة 1–2% لكل صفقة.
يعمل بشكل أفضل في الأسواق التي تسير في اتجاه قوي.
19
5
موسم الفوركس الأوروبي – EUR/USD
تاريخياً، كان شهر أبريل شهراً إيجابياً بشكل معتدل لـ EUR/USD، حيث أن زوج العملات الأكثر تداولاً في العالم حقق عائدًا متوسطًا قدره +0.3% على مدار السنوات الـ 50 الماضية. في مارس، انخفض EUR/USD وسط شراء الملاذ الآمن للدولار الأمريكي (وهي سمة شائعة طوال الشهر) وارتفاع أسعار الطاقة وسط النزاع في إيران، مما طغى على أي ميل موسمي. بينما من الممكن أن يحدث تعافي هذا الشهر، قد يتطلب الأمر تقدمًا ملموسًا نحو خفض التصعيد في الشرق الأوسط قبل أن يشعر المتداولون بالراحة في بيع الدولارات بأي درجة ذات مغزى.
موسم الفوركس الأوروبي – EUR/USD
تاريخياً، كان شهر أبريل شهراً إيجابياً بشكل معتدل لـ EUR/USD، حيث أن زوج العملات الأكثر تداولاً في العالم حقق عائدًا متوسطًا قدره +0.3% على مدار السنوات الـ 50 الماضية. في مارس، انخفض EUR/USD وسط شراء الملاذ الآمن للدولار الأمريكي (وهي سمة شائعة طوال الشهر) وارتفاع أسعار الطاقة وسط النزاع في إيران، مما طغى على أي ميل موسمي. بينما من الممكن أن يحدث تعافي هذا الشهر، قد يتطلب الأمر تقدمًا ملموسًا نحو خفض التصعيد في الشرق الأوسط قبل أن يشعر المتداولون بالراحة في بيع الدولارات بأي درجة ذات مغزى.
تاريخياً، كان شهر أبريل شهراً إيجابياً بشكل معتدل لـ EUR/USD، حيث أن زوج العملات الأكثر تداولاً في العالم حقق عائدًا متوسطًا قدره +0.3% على مدار السنوات الـ 50 الماضية. في مارس، انخفض EUR/USD وسط شراء الملاذ الآمن للدولار الأمريكي (وهي سمة شائعة طوال الشهر) وارتفاع أسعار الطاقة وسط النزاع في إيران، مما طغى على أي ميل موسمي. بينما من الممكن أن يحدث تعافي هذا الشهر، قد يتطلب الأمر تقدمًا ملموسًا نحو خفض التصعيد في الشرق الأوسط قبل أن يشعر المتداولون بالراحة في بيع الدولارات بأي درجة ذات مغزى.
57
عرض الترجمة
📊 Simple Buy & Sell Condition – Pattern Strategy
Before entering the market, always understand the pattern. Follow these simple rules:
✅ BUY Condition: • Price bounces from a strong support level
• Market forms Higher Highs & Higher Lows
• Volume increases on the buying side
• A confirmation candle closes green
🔻 SELL Condition: • Price gets rejected from a strong resistance level
• Market forms Lower Highs & Lower Lows
• Volume increases on the selling side
• A confirmation candle closes red
⚠️ Rule: First confirmation, then entry.
No emotions — only follow the pattern.
#Trading #Crypto #PriceAction
If you want, I can also make a more professional or more powerful version for your crypto page.
📊 Simple Buy & Sell Condition – Pattern Strategy
Before entering the market, always understand the pattern. Follow these simple rules:
✅ BUY Condition: • Price bounces from a strong support level
• Market forms Higher Highs & Higher Lows
• Volume increases on the buying side
• A confirmation candle closes green
🔻 SELL Condition: • Price gets rejected from a strong resistance level
• Market forms Lower Highs & Lower Lows
• Volume increases on the selling side
• A confirmation candle closes red
⚠️ Rule: First confirmation, then entry.
No emotions — only follow the pattern.
#Trading #Crypto #PriceAction
If you want, I can also make a more professional or more powerful version for your crypto page.
Before entering the market, always understand the pattern. Follow these simple rules:
✅ BUY Condition: • Price bounces from a strong support level
• Market forms Higher Highs & Higher Lows
• Volume increases on the buying side
• A confirmation candle closes green
🔻 SELL Condition: • Price gets rejected from a strong resistance level
• Market forms Lower Highs & Lower Lows
• Volume increases on the selling side
• A confirmation candle closes red
⚠️ Rule: First confirmation, then entry.
No emotions — only follow the pattern.
#Trading #Crypto #PriceAction
If you want, I can also make a more professional or more powerful version for your crypto page.
4

مقالة
عرض الترجمة
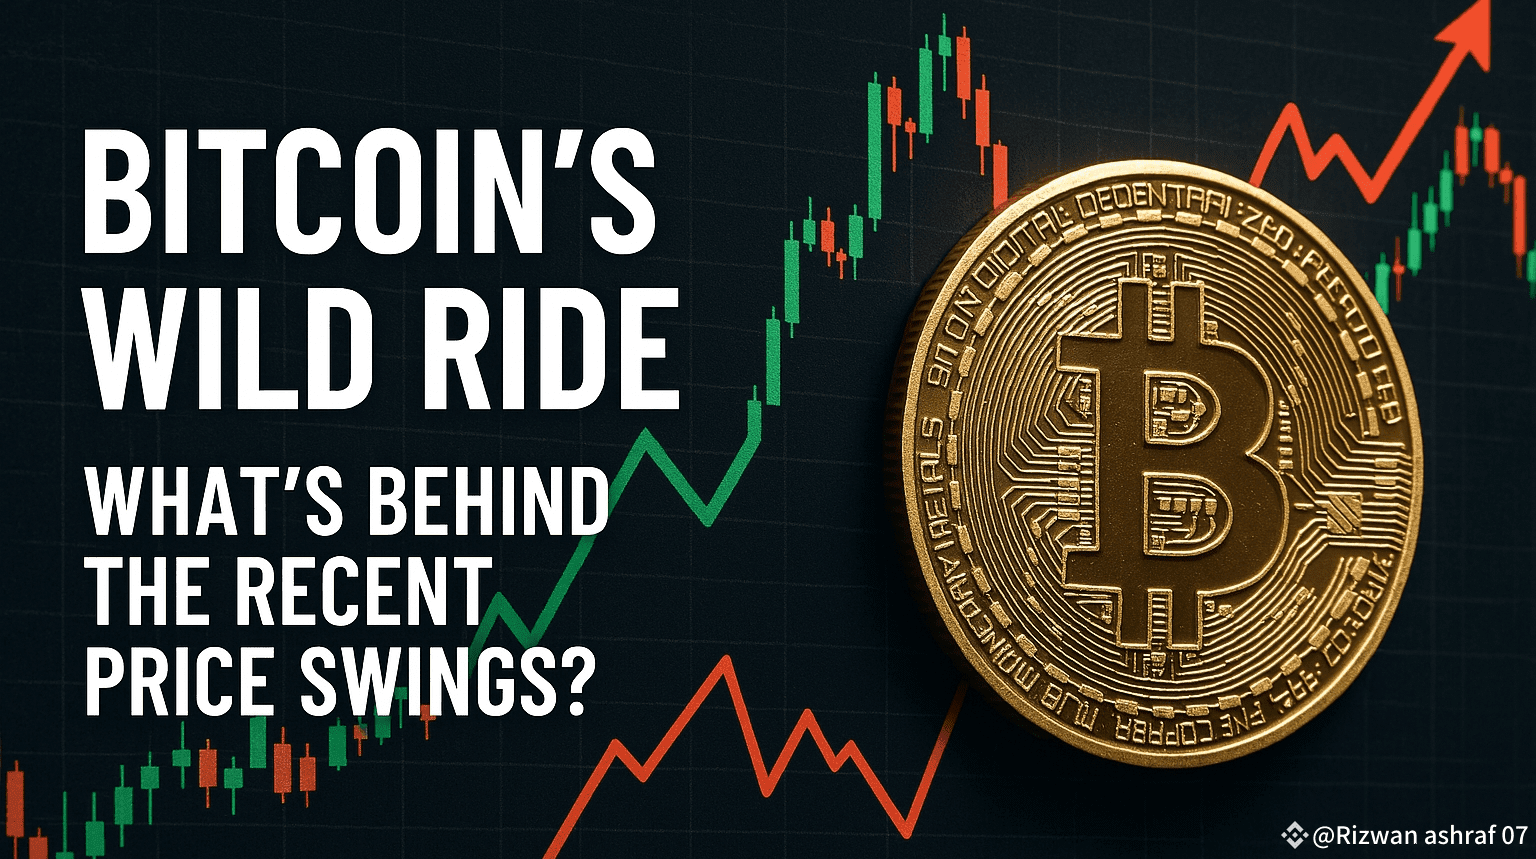
Bitcoin’s Wild Ride: What’s Behind the Recent Price Swings?In the fast-paced world of cryptocurrencyIn the fast-paced world of cryptocurrency, Bitcoin continues to live up to its reputation as a rollercoaster asset. In recent days, its price has experienced significant ups and downs, capturing the attention of investors, traders, and financial analysts around the globe. But what’s really driving these dramatic shifts—and what does the future hold for the king of crypto?
#Bitcoin’s Recent Surge: What Sparked the Rise?
Bitcoin saw a notable rise in early April 2025, briefly crossing key resistance levels. Several factors contributed to this rally:
1. Institutional Interest: Major investment firms and hedge funds are showing renewed interest in Bitcoin, viewing it as a hedge against inflation and market uncertainty.
2. Halving Anticipation: With the next Bitcoin halving event approaching, traders are speculating on reduced supply and increased demand—historically a bullish signal for BTC.
3. Global Economic Tensions: As traditional markets face uncertainty due to geopolitical conflicts and inflationary pressures, investors are seeking alternative assets—Bitcoin being a top choice.
4. ETF News & Regulations: Rumors and announcements around Bitcoin spot ETFs and more favorable regulations in major markets like the US have also boosted confidence.
The Sudden Fall: Why Did Bitcoin Pull Back?
Just as Bitcoin surged, it also experienced a sharp correction. Here’s why:
1. Profit-Taking: After the sharp rise, many short-term traders cashed out their profits, causing downward pressure on the price.
2. Regulatory Crackdowns: Some countries have issued fresh warnings or bans on crypto-related activities, spooking investors.
3. Market Manipulation & Whale Moves: Large holders (whales) selling off big chunks of Bitcoin can lead to sudden dips, triggering panic sells from retail investors.
4. Technical Resistance: Bitcoin hit a technical resistance level and failed to break through, prompting a reversal.
What Does This Mean for Investors?
The recent volatility is nothing new for seasoned Bitcoin watchers. While the price swings can be nerve-wracking, they also present opportunities. Analysts suggest:
Long-term holders (HODLers) should stay focused on fundamentals and not get shaken by short-term fluctuations.
Short-term traders need to be cautious and use risk management tools like stop-losses.
New investors are advised to research thoroughly and avoid investing money they can’t afford to lose.
Final Thoughts: I Bitcoin Still Worth It?
Despite the price fluctuations, Bitcoin continues to show resilience. Its decentralized nature, limited supply, and growing mainstream adoption keep it in the spotlight. Whether you're bullish or bearish, one thing’s for sure—Bitcoin isn’t going anywhere, and its journey is far from over.
Bitcoin’s Wild Ride: What’s Behind the Recent Price Swings?In the fast-paced world of cryptocurrency
In the fast-paced world of cryptocurrency, Bitcoin continues to live up to its reputation as a rollercoaster asset. In recent days, its price has experienced significant ups and downs, capturing the attention of investors, traders, and financial analysts around the globe. But what’s really driving these dramatic shifts—and what does the future hold for the king of crypto?
#Bitcoin’s Recent Surge: What Sparked the Rise?
Bitcoin saw a notable rise in early April 2025, briefly crossing key resistance levels. Several factors contributed to this rally:
1. Institutional Interest: Major investment firms and hedge funds are showing renewed interest in Bitcoin, viewing it as a hedge against inflation and market uncertainty.
2. Halving Anticipation: With the next Bitcoin halving event approaching, traders are speculating on reduced supply and increased demand—historically a bullish signal for BTC.
3. Global Economic Tensions: As traditional markets face uncertainty due to geopolitical conflicts and inflationary pressures, investors are seeking alternative assets—Bitcoin being a top choice.
4. ETF News & Regulations: Rumors and announcements around Bitcoin spot ETFs and more favorable regulations in major markets like the US have also boosted confidence.
The Sudden Fall: Why Did Bitcoin Pull Back?
Just as Bitcoin surged, it also experienced a sharp correction. Here’s why:
1. Profit-Taking: After the sharp rise, many short-term traders cashed out their profits, causing downward pressure on the price.
2. Regulatory Crackdowns: Some countries have issued fresh warnings or bans on crypto-related activities, spooking investors.
3. Market Manipulation & Whale Moves: Large holders (whales) selling off big chunks of Bitcoin can lead to sudden dips, triggering panic sells from retail investors.
4. Technical Resistance: Bitcoin hit a technical resistance level and failed to break through, prompting a reversal.
What Does This Mean for Investors?
The recent volatility is nothing new for seasoned Bitcoin watchers. While the price swings can be nerve-wracking, they also present opportunities. Analysts suggest:
Long-term holders (HODLers) should stay focused on fundamentals and not get shaken by short-term fluctuations.
Short-term traders need to be cautious and use risk management tools like stop-losses.
New investors are advised to research thoroughly and avoid investing money they can’t afford to lose.
Final Thoughts: I Bitcoin Still Worth It?
Despite the price fluctuations, Bitcoin continues to show resilience. Its decentralized nature, limited supply, and growing mainstream adoption keep it in the spotlight. Whether you're bullish or bearish, one thing’s for sure—Bitcoin isn’t going anywhere, and its journey is far from over.
#Bitcoin’s Recent Surge: What Sparked the Rise?
Bitcoin saw a notable rise in early April 2025, briefly crossing key resistance levels. Several factors contributed to this rally:
1. Institutional Interest: Major investment firms and hedge funds are showing renewed interest in Bitcoin, viewing it as a hedge against inflation and market uncertainty.
2. Halving Anticipation: With the next Bitcoin halving event approaching, traders are speculating on reduced supply and increased demand—historically a bullish signal for BTC.
3. Global Economic Tensions: As traditional markets face uncertainty due to geopolitical conflicts and inflationary pressures, investors are seeking alternative assets—Bitcoin being a top choice.
4. ETF News & Regulations: Rumors and announcements around Bitcoin spot ETFs and more favorable regulations in major markets like the US have also boosted confidence.
The Sudden Fall: Why Did Bitcoin Pull Back?
Just as Bitcoin surged, it also experienced a sharp correction. Here’s why:
1. Profit-Taking: After the sharp rise, many short-term traders cashed out their profits, causing downward pressure on the price.
2. Regulatory Crackdowns: Some countries have issued fresh warnings or bans on crypto-related activities, spooking investors.
3. Market Manipulation & Whale Moves: Large holders (whales) selling off big chunks of Bitcoin can lead to sudden dips, triggering panic sells from retail investors.
4. Technical Resistance: Bitcoin hit a technical resistance level and failed to break through, prompting a reversal.
What Does This Mean for Investors?
The recent volatility is nothing new for seasoned Bitcoin watchers. While the price swings can be nerve-wracking, they also present opportunities. Analysts suggest:
Long-term holders (HODLers) should stay focused on fundamentals and not get shaken by short-term fluctuations.
Short-term traders need to be cautious and use risk management tools like stop-losses.
New investors are advised to research thoroughly and avoid investing money they can’t afford to lose.
Final Thoughts: I Bitcoin Still Worth It?
Despite the price fluctuations, Bitcoin continues to show resilience. Its decentralized nature, limited supply, and growing mainstream adoption keep it in the spotlight. Whether you're bullish or bearish, one thing’s for sure—Bitcoin isn’t going anywhere, and its journey is far from over.
6
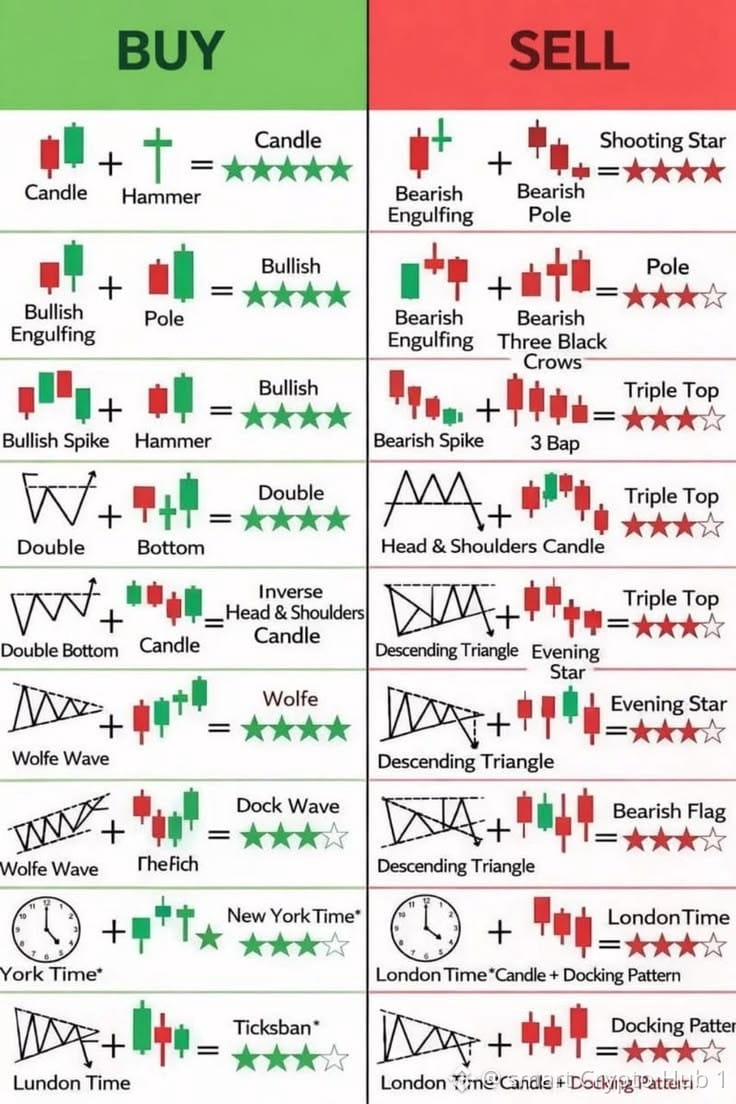
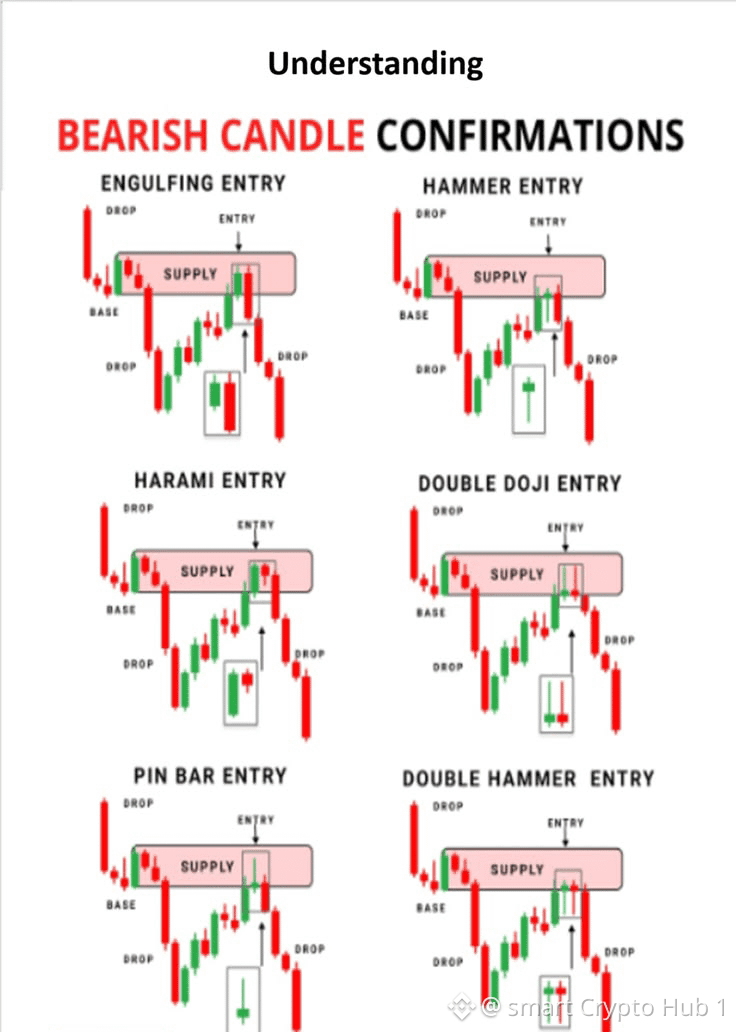
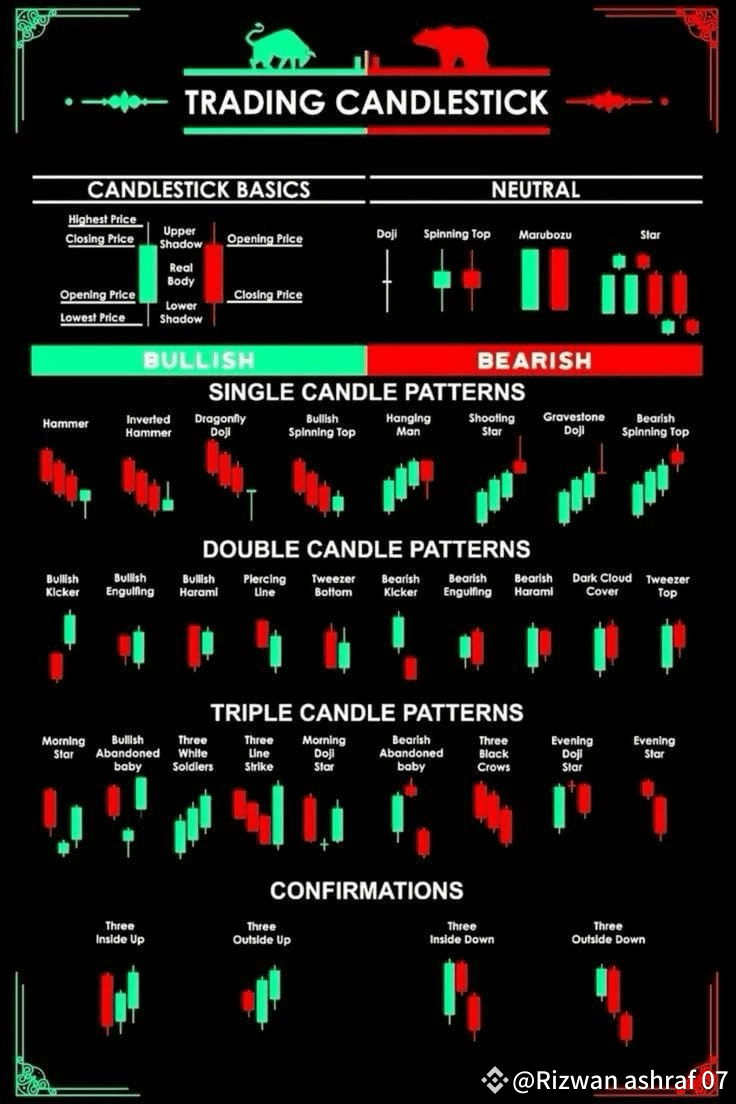
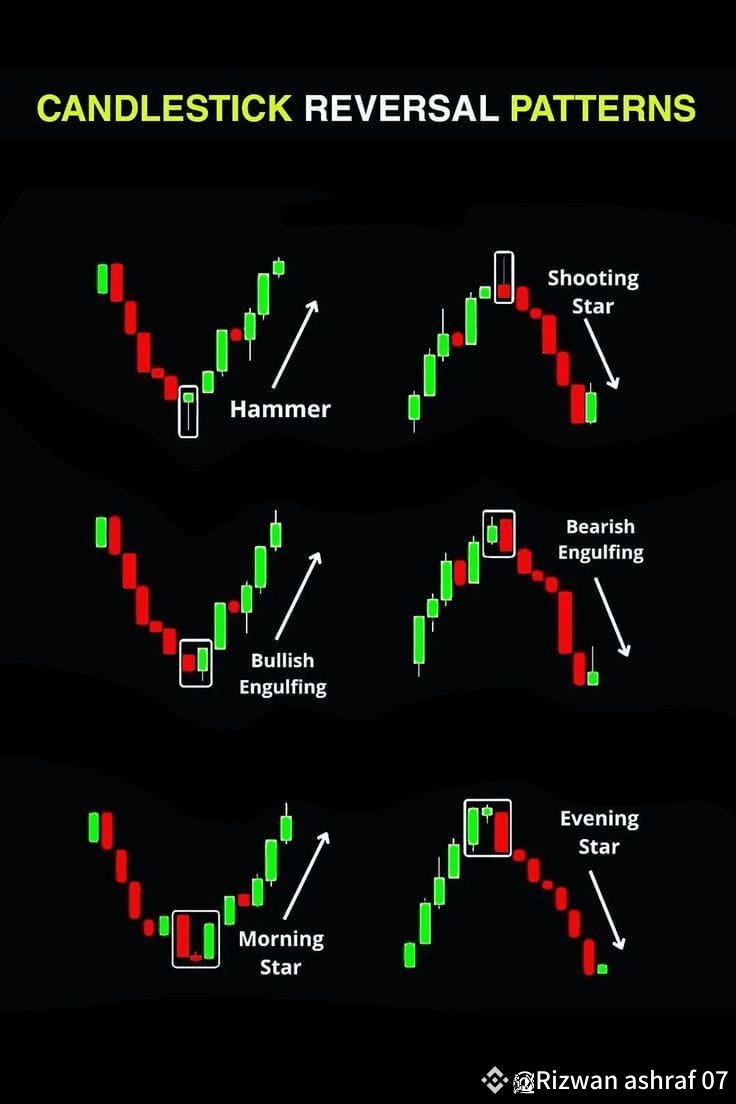
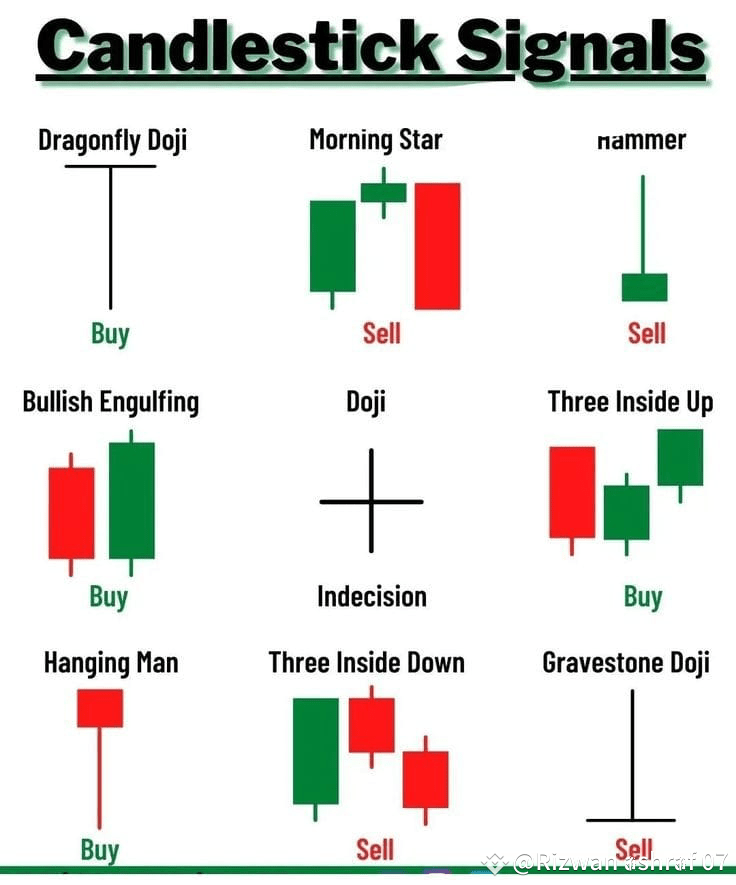
نمط الشموع حيث نشتري ونبيع ....
#BTC
$BTC
{spot}(BTCUSDT)
فهم المنطق وحقق الربح... 👇
بيتكوين ينخفض مرة أخرى في وقت إغلاق السوق..
نمط الشموع حيث نشتري ونبيع ....
#BTC
$BTC
فهم المنطق وحقق الربح... 👇
بيتكوين ينخفض مرة أخرى في وقت إغلاق السوق..
#BTC
$BTC
فهم المنطق وحقق الربح... 👇
بيتكوين ينخفض مرة أخرى في وقت إغلاق السوق..
133
سجّل الدخول لاستكشاف المزيد من المُحتوى
انضم إلى مُستخدمي العملات الرقمية حول العالم على Binance Square
⚡️ احصل على أحدث المعلومات المفيدة عن العملات الرقمية.
💬 موثوقة من قبل أكبر منصّة لتداول العملات الرقمية في العالم.
👍 اكتشف الرؤى الحقيقية من صنّاع المُحتوى الموثوقين.
البريد الإلكتروني / رقم الهاتف
المواضيع الرائجة
DriftHackVictimsBeginClaims
55,128 مشاهدات
650 يقومون بالنقاش
🚨 عاجل | بدء تعويضات ضحايا اختراق بروتوكول Drift! 💸🔐
أعلن بروتوكول Drift، أبرز بورصة عقود آجلة لامركزية على شبكة Solana، عن الافتتاح الرسمي لبوابة المطالبات والاستردادات المخصصة لرمز DFX، لتعويض المستخدمين المتأثرين بالاختراق الضخم الذي وقع في 1 أبريل/نيسان.
أبرز تفاصيل خطة الاسترداد الحالية:
• حجم الخسائر الأصلية: الهجوم الذي نُفِّذ من قِبل جهات مرتبطة بكوريا الشمالية كان قد استنزف حوالي 295.4 مليون دولار.
• آلية التعويض: سيتلقى المتضررون رمز DFX مقابل كل USDT من الخسارة المثبتة في لقطة اليوم (snapshot).
• معدل الاسترداد الأولي: يبلغ التخصيص الأولي لصندوق الاسترداد نحو 3.11 مليون USDT، مما يضع معدل الاسترداد الأولي عند 0.0104 USDT فقط لكل DFX (أي أن المستخدمين سيحصلون تقريبًا على سنت واحد مقابل كل دولار في هذه المرحلة الأولى).
• المهلة الزمنية: لدى المتضررين حتى 1 يناير/كانون الثاني 2028 للمطالبة برموزهم عبر البوابة الرسمية، وبعد هذا التاريخ سيتم حرق أي جزء غير مطالب به من إجمالي إمداد DFX بشكل دائم.
#DriftHackVictimsBeginClaims
$DRIFT
الكريبتو بالمختصر
·1 إعجاب
·149 مشاهدات
SolanaTokenizedStockVolumeTops$4.4BInSeptember
6,861 مشاهدات
71 يقومون بالنقاش
BitcoinSpotETFsDraw$6.34BInflowsInQ3
22,423 مشاهدات
184 يقومون بالنقاش