

Odunerd
54 منشورات

Odunerd
إبلاغ
حظر المُستخدم
BP-24948D0AD5FF
94 تتابع
432 المتابعون
1.3K+ إعجاب
منشورات
الكل
اقتباسات
PINNED
·
--
صاعد
غالبًا ما نهمل قناعاتنا وعندما يحدث ذلك تصرخ 😬 أوه.
بجانب التحليل الفني والتحليل الأساسي
هناك شيء يسمى تحليل المشاعر
ما هي مشاعرك تجاه قصة معينة في مجال العملات المشفرة وما هو التأثير الذي تقدمه لك مشاعرك سواء كان جيدًا أو سيئًا؟
أعني، سواء كان صعوديًا أو هبوطيًا، ما يهم هو حالتك الذهنية وليس فقط ما يظهره الرسم البياني أو MM.
حافظ على تركيزك🤳
الرموز التي أقود بها قناعاتي هي rn
#memes
#L2s
#AI
#exchtokens
غالبًا ما نهمل قناعاتنا وعندما يحدث ذلك تصرخ 😬 أوه.
بجانب التحليل الفني والتحليل الأساسي
هناك شيء يسمى تحليل المشاعر
ما هي مشاعرك تجاه قصة معينة في مجال العملات المشفرة وما هو التأثير الذي تقدمه لك مشاعرك سواء كان جيدًا أو سيئًا؟
أعني، سواء كان صعوديًا أو هبوطيًا، ما يهم هو حالتك الذهنية وليس فقط ما يظهره الرسم البياني أو MM.
حافظ على تركيزك🤳
الرموز التي أقود بها قناعاتي هي rn
#memes
#L2s
#AI
#exchtokens
بجانب التحليل الفني والتحليل الأساسي
هناك شيء يسمى تحليل المشاعر
ما هي مشاعرك تجاه قصة معينة في مجال العملات المشفرة وما هو التأثير الذي تقدمه لك مشاعرك سواء كان جيدًا أو سيئًا؟
أعني، سواء كان صعوديًا أو هبوطيًا، ما يهم هو حالتك الذهنية وليس فقط ما يظهره الرسم البياني أو MM.
حافظ على تركيزك🤳
الرموز التي أقود بها قناعاتي هي rn
#memes
#L2s
#AI
#exchtokens

3
8
2.5k
·
--
رمز ينجو بصعوبة للعودة إلى قدميه—لكن هذا لا يبدو جيدًا على الإطلاق لعائلة ريبل الآن..
#BitgetHackerMoves$83MStolenXRP
رمز ينجو بصعوبة للعودة إلى قدميه—لكن هذا لا يبدو جيدًا على الإطلاق لعائلة ريبل الآن..
#BitgetHackerMoves$83MStolenXRP
#BitgetHackerMoves$83MStolenXRP
351
·
--
مقالة
عرض الترجمة
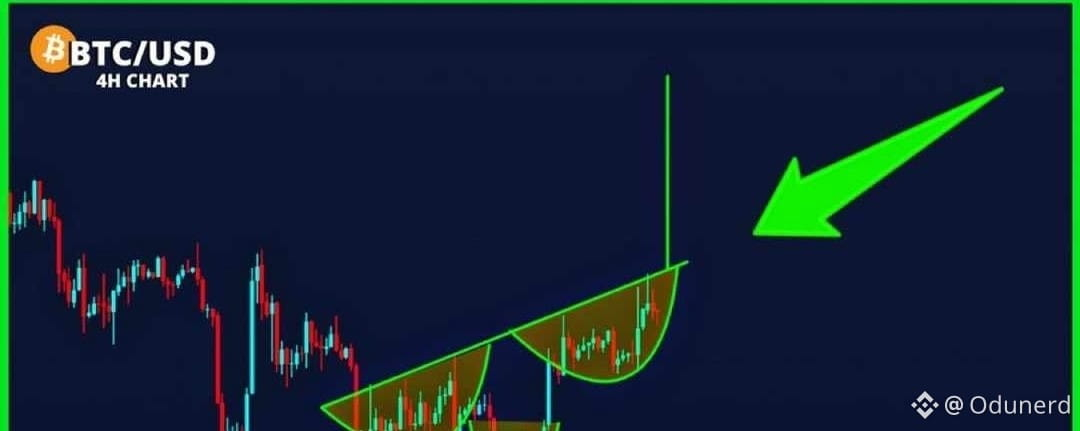
BITCOIN INCONSISTENCIES ANALYTICAL PROVEN..Was June 30, 2026 the Bitcoin Cycle Bottom?
One question has been sitting at the center of my Bitcoin analysis:
Did Bitcoin actually find its cycle bottom on June 30, 2026?
Rather than relying on the chart alone, I approached the question from two sides:
Market structure + on-chain and market data.
1. Starting With Price Action
I deliberately kept the technical analysis simple.
No complicated indicators.
Just price structure.
Bitcoin reached a low of approximately $58.53K on June 30.
Since then, the market has behaved differently from the downtrend that led into that low.
On the daily chart, $BTC moved away from the June low and entered a period of consolidation before beginning to form a sequence of higher highs and higher lows.
The weekly chart adds another important piece of context.
The June low has remained intact, while Bitcoin has recovered substantially from that level.
That is certainly worth paying attention to.
But there is an important distinction:
A strong recovery from a low does not, by itself, prove that the cycle bottom is in.
So I went deeper.
2. Looking Beneath the Chart
To test the June low from a data perspective, I built a framework around several metrics and historical comparisons:
- MVRV
- Bitcoin Realized Price
- ETF flows
- Historical cycle bottoms
- Peak-to-bottom drawdowns
- Post-bottom recovery behaviour
The objective wasn't to find one magic indicator.
Instead, I wanted to see whether multiple independent pieces of evidence were pointing toward the same conclusion.
Key numbers from the analysis
$58.53K — June 30 low
-53.11% — Peak-to-bottom drawdown
1.47 — Current MVRV
$53.19K — Realized Price
+30.52% — Recovery from the June low at the time of the analysis
When these figures are placed alongside historical Bitcoin cycle behaviour, the June 30 low starts to look increasingly significant.
3. What Does the Evidence Actually Tell Us?
The analysis suggests that June 30 is a credible candidate for the cycle bottom.
But there is an important caveat:
A candidate bottom is not the same thing as a confirmed cycle bottom.
Bitcoin has historically experienced significant recoveries that were later followed by another major move lower.
That's why I don't think one should look at the June low in isolation.
The more interesting observation is that both price structure and the underlying data are pointing toward a potential change in market behaviour around that period.
Price is showing a different structure.
The on-chain and market data provide additional evidence worth investigating.
But the higher-timeframe cycle still needs to prove itself.
4. Why Combine Technical Analysis With Data Analytics?
This is actually the bigger lesson behind the research.
The chart tells us what price is doing.
But data can help us investigate what may be happening underneath the price.
Instead of asking:
«"Does the chart look bullish?"»
The better analytical question becomes:
"Do multiple independent datasets support the same market hypothesis?"
That shift changes the way I approach crypto research.
Rather than relying on a single indicator or prediction, I want to combine:
Price → On-chain data → Historical behaviour → Market flows → Statistical context
Then let the evidence tell the story.
So, was June 30, 2026 the Bitcoin cycle bottom?
It is a credible candidate — but the data does not make it a confirmed fact yet.
For me, that's where the research becomes interesting.
The goal isn't to predict the market with certainty.
It's to identify important market events, collect the relevant data, test the hypothesis, and continue monitoring whether the evidence holds.
PS: I've put together the full research, dashboard, and methodology for anyone interested in going through the analysis from start to finish.
BITCOIN INCONSISTENCIES ANALYTICAL PROVEN..
Was June 30, 2026 the Bitcoin Cycle Bottom?
One question has been sitting at the center of my Bitcoin analysis:
Did Bitcoin actually find its cycle bottom on June 30, 2026?
Rather than relying on the chart alone, I approached the question from two sides:
Market structure + on-chain and market data.
1. Starting With Price Action
I deliberately kept the technical analysis simple.
No complicated indicators.
Just price structure.
Bitcoin reached a low of approximately $58.53K on June 30.
Since then, the market has behaved differently from the downtrend that led into that low.
On the daily chart, $BTC moved away from the June low and entered a period of consolidation before beginning to form a sequence of higher highs and higher lows.
The weekly chart adds another important piece of context.
The June low has remained intact, while Bitcoin has recovered substantially from that level.
That is certainly worth paying attention to.
But there is an important distinction:
A strong recovery from a low does not, by itself, prove that the cycle bottom is in.
So I went deeper.
2. Looking Beneath the Chart
To test the June low from a data perspective, I built a framework around several metrics and historical comparisons:
- MVRV
- Bitcoin Realized Price
- ETF flows
- Historical cycle bottoms
- Peak-to-bottom drawdowns
- Post-bottom recovery behaviour
The objective wasn't to find one magic indicator.
Instead, I wanted to see whether multiple independent pieces of evidence were pointing toward the same conclusion.
Key numbers from the analysis
$58.53K — June 30 low
-53.11% — Peak-to-bottom drawdown
1.47 — Current MVRV
$53.19K — Realized Price
+30.52% — Recovery from the June low at the time of the analysis
When these figures are placed alongside historical Bitcoin cycle behaviour, the June 30 low starts to look increasingly significant.
3. What Does the Evidence Actually Tell Us?
The analysis suggests that June 30 is a credible candidate for the cycle bottom.
But there is an important caveat:
A candidate bottom is not the same thing as a confirmed cycle bottom.
Bitcoin has historically experienced significant recoveries that were later followed by another major move lower.
That's why I don't think one should look at the June low in isolation.
The more interesting observation is that both price structure and the underlying data are pointing toward a potential change in market behaviour around that period.
Price is showing a different structure.
The on-chain and market data provide additional evidence worth investigating.
But the higher-timeframe cycle still needs to prove itself.
4. Why Combine Technical Analysis With Data Analytics?
This is actually the bigger lesson behind the research.
The chart tells us what price is doing.
But data can help us investigate what may be happening underneath the price.
Instead of asking:
«"Does the chart look bullish?"»
The better analytical question becomes:
"Do multiple independent datasets support the same market hypothesis?"
That shift changes the way I approach crypto research.
Rather than relying on a single indicator or prediction, I want to combine:
Price → On-chain data → Historical behaviour → Market flows → Statistical context
Then let the evidence tell the story.
So, was June 30, 2026 the Bitcoin cycle bottom?
It is a credible candidate — but the data does not make it a confirmed fact yet.
For me, that's where the research becomes interesting.
The goal isn't to predict the market with certainty.
It's to identify important market events, collect the relevant data, test the hypothesis, and continue monitoring whether the evidence holds.
PS: I've put together the full research, dashboard, and methodology for anyone interested in going through the analysis from start to finish.
One question has been sitting at the center of my Bitcoin analysis:
Did Bitcoin actually find its cycle bottom on June 30, 2026?
Rather than relying on the chart alone, I approached the question from two sides:
Market structure + on-chain and market data.
1. Starting With Price Action
I deliberately kept the technical analysis simple.
No complicated indicators.
Just price structure.
Bitcoin reached a low of approximately $58.53K on June 30.
Since then, the market has behaved differently from the downtrend that led into that low.
On the daily chart, $BTC moved away from the June low and entered a period of consolidation before beginning to form a sequence of higher highs and higher lows.
The weekly chart adds another important piece of context.
The June low has remained intact, while Bitcoin has recovered substantially from that level.
That is certainly worth paying attention to.
But there is an important distinction:
A strong recovery from a low does not, by itself, prove that the cycle bottom is in.
So I went deeper.
2. Looking Beneath the Chart
To test the June low from a data perspective, I built a framework around several metrics and historical comparisons:
- MVRV
- Bitcoin Realized Price
- ETF flows
- Historical cycle bottoms
- Peak-to-bottom drawdowns
- Post-bottom recovery behaviour
The objective wasn't to find one magic indicator.
Instead, I wanted to see whether multiple independent pieces of evidence were pointing toward the same conclusion.
Key numbers from the analysis
$58.53K — June 30 low
-53.11% — Peak-to-bottom drawdown
1.47 — Current MVRV
$53.19K — Realized Price
+30.52% — Recovery from the June low at the time of the analysis
When these figures are placed alongside historical Bitcoin cycle behaviour, the June 30 low starts to look increasingly significant.
3. What Does the Evidence Actually Tell Us?
The analysis suggests that June 30 is a credible candidate for the cycle bottom.
But there is an important caveat:
A candidate bottom is not the same thing as a confirmed cycle bottom.
Bitcoin has historically experienced significant recoveries that were later followed by another major move lower.
That's why I don't think one should look at the June low in isolation.
The more interesting observation is that both price structure and the underlying data are pointing toward a potential change in market behaviour around that period.
Price is showing a different structure.
The on-chain and market data provide additional evidence worth investigating.
But the higher-timeframe cycle still needs to prove itself.
4. Why Combine Technical Analysis With Data Analytics?
This is actually the bigger lesson behind the research.
The chart tells us what price is doing.
But data can help us investigate what may be happening underneath the price.
Instead of asking:
«"Does the chart look bullish?"»
The better analytical question becomes:
"Do multiple independent datasets support the same market hypothesis?"
That shift changes the way I approach crypto research.
Rather than relying on a single indicator or prediction, I want to combine:
Price → On-chain data → Historical behaviour → Market flows → Statistical context
Then let the evidence tell the story.
So, was June 30, 2026 the Bitcoin cycle bottom?
It is a credible candidate — but the data does not make it a confirmed fact yet.
For me, that's where the research becomes interesting.
The goal isn't to predict the market with certainty.
It's to identify important market events, collect the relevant data, test the hypothesis, and continue monitoring whether the evidence holds.
PS: I've put together the full research, dashboard, and methodology for anyone interested in going through the analysis from start to finish.
1
62
·
--
صاعد
$ARB
$ZAMA
$SUI
إن البدائل تستيقظ بالفعل، لكن لا يزال معدل التعافي لبعض الرموز لا يطابق زخمها.
$ARB
$ZAMA
$SUI
إن البدائل تستيقظ بالفعل، لكن لا يزال معدل التعافي لبعض الرموز لا يطابق زخمها.
$ZAMA
$SUI
إن البدائل تستيقظ بالفعل، لكن لا يزال معدل التعافي لبعض الرموز لا يطابق زخمها.
1
594
·
--
أحضر لي الوضع المظلم في أي وقت وبأي طريقة من أجل مصلحتي حقًا، الضرر الذي تسببت فيه الوضعية الساطعة يحتاج إلى مزيد من الاهتمام.
أحضر لي الوضع المظلم في أي وقت وبأي طريقة من أجل مصلحتي حقًا، الضرر الذي تسببت فيه الوضعية الساطعة يحتاج إلى مزيد من الاهتمام.

Odunerd
·
--
صاعدباعتبارك مطورًا تتعلم وتبرمج أيضًا ما هي الشاشة التي تفضلها أثناء وجودك على الشاشة.
▪︎شاشة مضيئة
▪︎شاشة داكنة
دعونا نتحدث.
▪︎شاشة مضيئة
▪︎شاشة داكنة
دعونا نتحدث.
1
6
·
--
#StockMarketCrash أثر الحرب من المؤكد أنه سيلعب دورًا في العواقب، ما نراه الآن هو مجرد فخ أو لجذب الناس.
#StockMarketCrash أثر الحرب من المؤكد أنه سيلعب دورًا في العواقب، ما نراه الآن هو مجرد فخ أو لجذب الناس.
1
53
·
--
صاعد
ارتفاع البيتكوين إلى 73 ألف دولار ليس قاعدة للشعور بالوصول، ما يغذي الارتفاع في السوق الآن هو كمية $BTC في المخزون والحرب تشتت انتباه المعدنين، كما يقال.
ارتفاع البيتكوين إلى 73 ألف دولار ليس قاعدة للشعور بالوصول، ما يغذي الارتفاع في السوق الآن هو كمية $BTC في المخزون والحرب تشتت انتباه المعدنين، كما يقال.
1
65
·
--
لقد أعاقوا الجميع في المنصب حقًا
لقد أعاقوا الجميع في المنصب حقًا

Tyler Oliveira
·
--
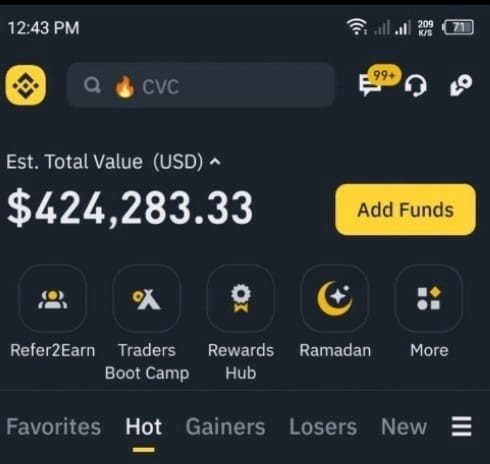
كان لدي 1.2 مليون في حسابي قبل بضع ساعات 💔😭
لقد خسرت تقريبًا 800K في $POWER ، كيف أستطيع استعادة هذه الخسائر؟؟؟ 😰
أنا أشتري $RIVER 📈✅
لقد خسرت تقريبًا 800K في $POWER ، كيف أستطيع استعادة هذه الخسائر؟؟؟ 😰
أنا أشتري $RIVER 📈✅

1
16
·
--
صاعد
متفائل بالتساوي بشأن $KAITO هنا
متفائل بالتساوي بشأن $KAITO هنا


CoinQuest
·
--
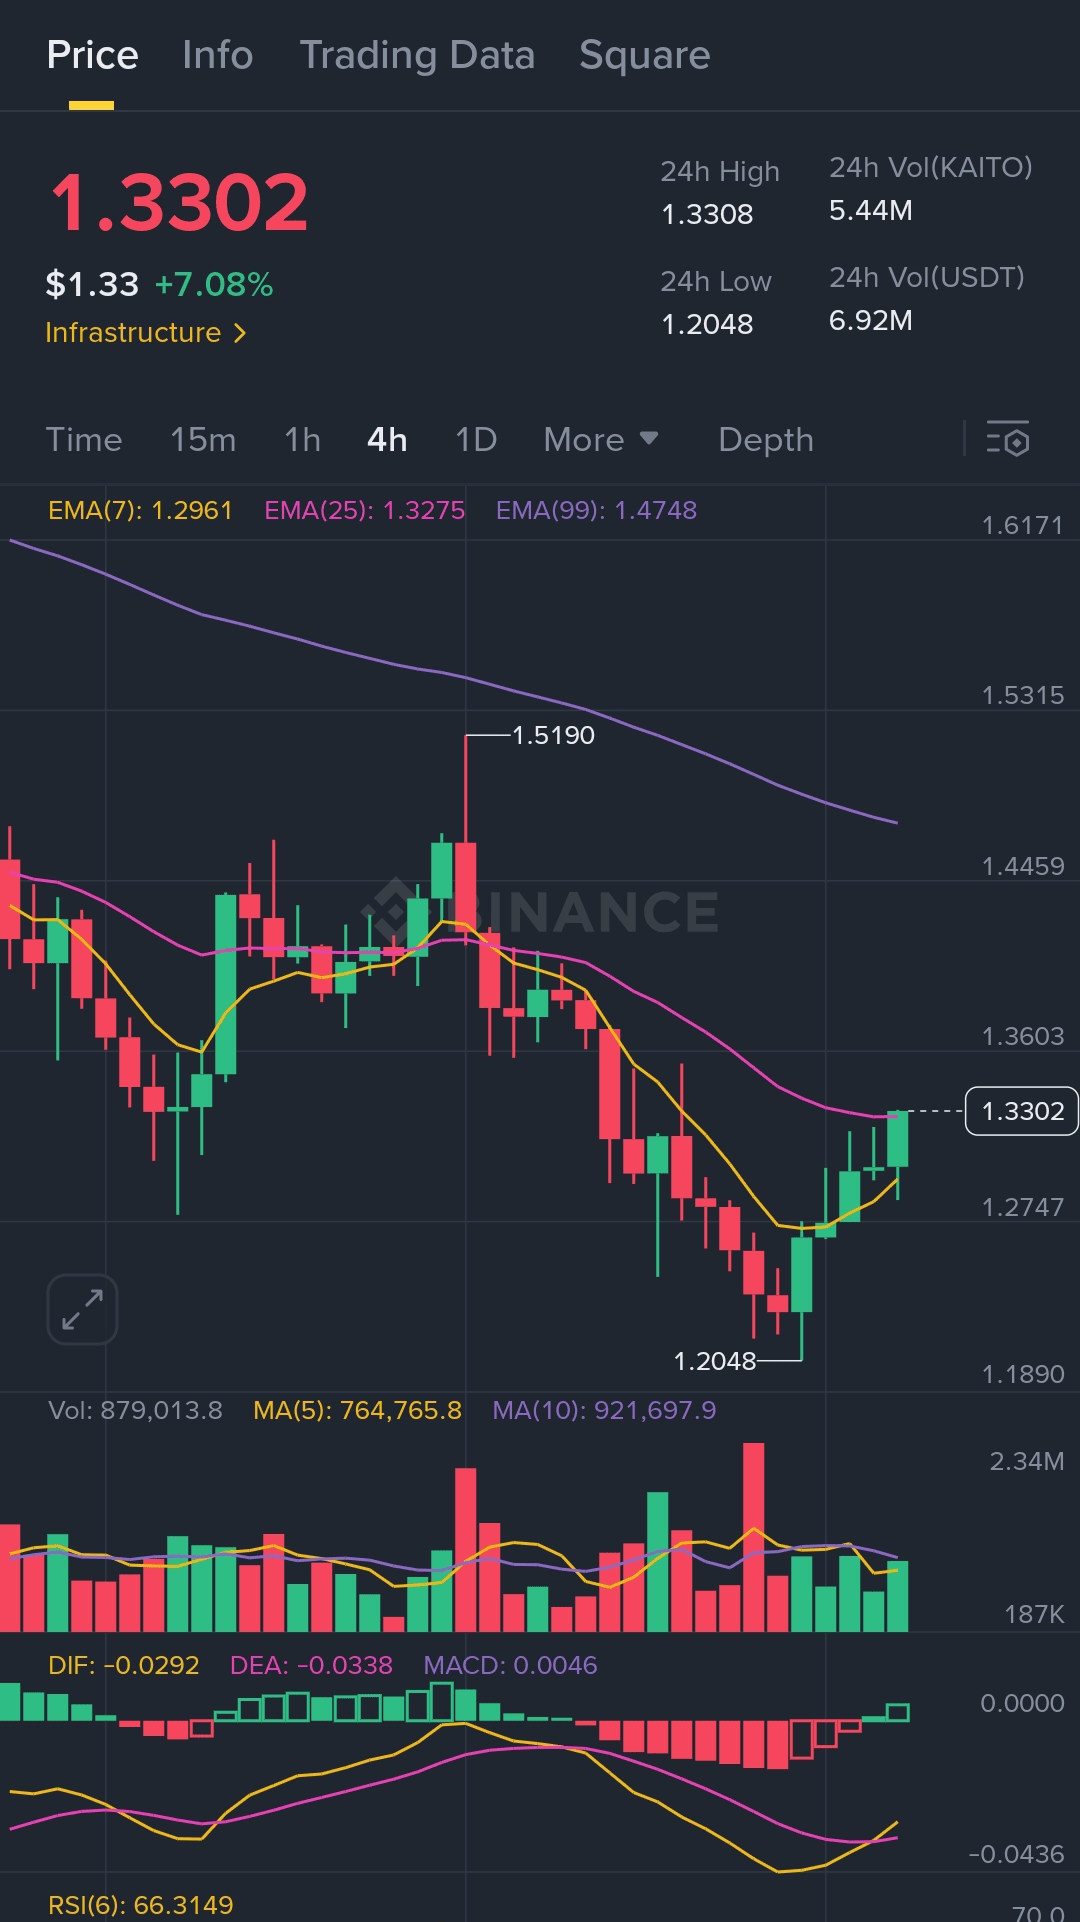
صاعد$KAITO هيكل الانفجار في الحركة ✅
KAITO قد تجاوز المقاومة مع تأكيد الحجم ويشكل قيعان أعلى نظيفة. الثيران تستعيد السيطرة بالكامل.
🎯 الدخول: $1.3300
الأهداف: $1.3538 | $1.3850 | $1.4200 (اختياري للتدرج)
🛡️ وقف الخسارة: $1.2975
الزخم يميل نحو الاستمرار. يجب على متداولي الانفجار مراقبة القوة فوق $1.33 لإعداد نظيف لتمديد الاتجاه الصاعد.
KAITO قد تجاوز المقاومة مع تأكيد الحجم ويشكل قيعان أعلى نظيفة. الثيران تستعيد السيطرة بالكامل.
🎯 الدخول: $1.3300
الأهداف: $1.3538 | $1.3850 | $1.4200 (اختياري للتدرج)
🛡️ وقف الخسارة: $1.2975
الزخم يميل نحو الاستمرار. يجب على متداولي الانفجار مراقبة القوة فوق $1.33 لإعداد نظيف لتمديد الاتجاه الصاعد.
182
·
--
صاعد
➠الوقت هو كل ما يهم، ولكن على المدى الطويل، يرجى إعطاء الأولوية لأمانك أولاً، فكل شيء آخر مجرد مزحة.
📢📢
➠الوقت هو كل ما يهم، ولكن على المدى الطويل، يرجى إعطاء الأولوية لأمانك أولاً، فكل شيء آخر مجرد مزحة.
📢📢
📢📢
16
·
--
صاعد
لا تترك أي حجر دون أن تقلبه.
نصيحتي هي عدم التوقف عن النقر.
لا تترك أي حجر دون أن تقلبه.
نصيحتي هي عدم التوقف عن النقر.
نصيحتي هي عدم التوقف عن النقر.

2
6
6.9k
·
--
صاعد
سؤال حقيقي فقط للحصول على إجابة حقيقية.
هل اقتربنا من مواسم Alts؟
سؤال حقيقي فقط للحصول على إجابة حقيقية.
هل اقتربنا من مواسم Alts؟
هل اقتربنا من مواسم Alts؟

11
7
7.1k
·
--
صاعد
المفتاح الرئيسي هنا هو أن يكون لديك قناعات قوية بشأن أي شيء تتمسك به بعد ذلك، ثم خذ وقتك للتحقق من بعض البيانات والإحصائيات لتأسيس موقفك.
#Dogs لديه خلفية سردية قوية جدًا، لا داعي للذعر كثيرًا، فالتمسك به ممكن أو تداوله بحذر.
من خلال الاستماع إلى بافيل دوروف الرئيس التنفيذي لشركة Telegram، ستفهم من أين تأتي السرد #Dogs وستعرف أنه ليس مجرد ميم عادي.
أنا أركز على X
يمكننا التواصل من هنا.
أعجب بأفكارك وشاركها.
#bnb 💛
المفتاح الرئيسي هنا هو أن يكون لديك قناعات قوية بشأن أي شيء تتمسك به بعد ذلك، ثم خذ وقتك للتحقق من بعض البيانات والإحصائيات لتأسيس موقفك.
#Dogs لديه خلفية سردية قوية جدًا، لا داعي للذعر كثيرًا، فالتمسك به ممكن أو تداوله بحذر.
من خلال الاستماع إلى بافيل دوروف الرئيس التنفيذي لشركة Telegram، ستفهم من أين تأتي السرد #Dogs وستعرف أنه ليس مجرد ميم عادي.
أنا أركز على X
يمكننا التواصل من هنا.
أعجب بأفكارك وشاركها.
#bnb 💛
#Dogs لديه خلفية سردية قوية جدًا، لا داعي للذعر كثيرًا، فالتمسك به ممكن أو تداوله بحذر.
من خلال الاستماع إلى بافيل دوروف الرئيس التنفيذي لشركة Telegram، ستفهم من أين تأتي السرد #Dogs وستعرف أنه ليس مجرد ميم عادي.
أنا أركز على X
يمكننا التواصل من هنا.
أعجب بأفكارك وشاركها.
#bnb 💛
1
706
·
--
هابط
شهدت شبكة Open Network (TON) انخفاضًا مفاجئًا بسبب اعتقال الرئيس التنفيذي لشركة Telegram.
#PavelDurov
حان الوقت للتحرك بسرعة بشأن الميمات البارزة على Ton Blockchain لاستغلال هذه الفرصة وتأمينها كتصويت شراء.
#Fish
#Notcoin
#utyab
#Raff
Tpet
Durev
Tcandy
Tmonk.
والعديد منها يمكنك التحقق منها على geckoterminal.com أو استخدام هذه dexs لشراء الرمز المدرج.
Ston.fi
DeDust.io
شهدت شبكة Open Network (TON) انخفاضًا مفاجئًا بسبب اعتقال الرئيس التنفيذي لشركة Telegram.
#PavelDurov
حان الوقت للتحرك بسرعة بشأن الميمات البارزة على Ton Blockchain لاستغلال هذه الفرصة وتأمينها كتصويت شراء.
#Fish
#Notcoin
#utyab
#Raff
Tpet
Durev
Tcandy
Tmonk.
والعديد منها يمكنك التحقق منها على geckoterminal.com أو استخدام هذه dexs لشراء الرمز المدرج.
Ston.fi
DeDust.io
#PavelDurov
حان الوقت للتحرك بسرعة بشأن الميمات البارزة على Ton Blockchain لاستغلال هذه الفرصة وتأمينها كتصويت شراء.
#Fish
#Notcoin
#utyab
#Raff
Tpet
Durev
Tcandy
Tmonk.
والعديد منها يمكنك التحقق منها على geckoterminal.com أو استخدام هذه dexs لشراء الرمز المدرج.
Ston.fi
DeDust.io

4
720
·
--
صاعد
هذا الجزء من التعليم يدفئ قلبي دائمًا من Binance إلى العالم.
#BNB 💛
هذا الجزء من التعليم يدفئ قلبي دائمًا من Binance إلى العالم.
#BNB 💛
#BNB 💛


Binance Square Official
·
--
كيفية كتابة مقال طويل على Square
202
·
--
صاعد
أفكاري أيضًا لعالم DEFI اليوم هي دعونا نتبنى المزيد من التكنولوجيا والابتكارات والأفكار لن تكون شيئًا ينقص في فضاء العملات المشفرة تمامًا..
كن منتجًا
كن متصلًا
كن منفتح الذهن
أفكاري أيضًا لعالم DEFI اليوم هي دعونا نتبنى المزيد من التكنولوجيا والابتكارات والأفكار لن تكون شيئًا ينقص في فضاء العملات المشفرة تمامًا..
كن منتجًا
كن متصلًا
كن منفتح الذهن
كن منتجًا
كن متصلًا
كن منفتح الذهن
5
269
·
--
#MarketSentimentToday سأقول إن السوق في حالة دوجي في الوقت الحالي ويجب أن يكون المرء حذرًا جدًا أثناء اتخاذ القرارات..
#MarketSentimentToday سأقول إن السوق في حالة دوجي في الوقت الحالي ويجب أن يكون المرء حذرًا جدًا أثناء اتخاذ القرارات..
5
3k
·
--
صاعد
باعتبارك مطورًا تتعلم وتبرمج أيضًا ما هي الشاشة التي تفضلها أثناء وجودك على الشاشة.
▪︎شاشة مضيئة
▪︎شاشة داكنة
دعونا نتحدث.
باعتبارك مطورًا تتعلم وتبرمج أيضًا ما هي الشاشة التي تفضلها أثناء وجودك على الشاشة.
▪︎شاشة مضيئة
▪︎شاشة داكنة
دعونا نتحدث.
▪︎شاشة مضيئة
▪︎شاشة داكنة
دعونا نتحدث.
1
2
5.5k
سجّل الدخول لاستكشاف المزيد من المُحتوى
انضم إلى مُستخدمي العملات الرقمية حول العالم على Binance Square
⚡️ احصل على أحدث المعلومات المفيدة عن العملات الرقمية.
💬 موثوقة من قبل أكبر منصّة لتداول العملات الرقمية في العالم.
👍 اكتشف الرؤى الحقيقية من صنّاع المُحتوى الموثوقين.
البريد الإلكتروني / رقم الهاتف
المواضيع الرائجة
UKFCAWinsCourtOrderToRecover851400Pounds
40,422 مشاهدات
851 يقومون بالنقاش
#UKFCAWinsCourtOrderToRecover851400Pounds
#UKFCAWinsCourtOrderToRecover851400Pounds
هيئة الرقابة المالية البريطانية FCA تفوز بأمر قضائي لاسترداد 851400 باوند
في انتصار كبير للعدالة المالية في بريطانيا
التفاصيل الكاملة
المحتال جون بيرفورد 86 سنة عالم سابق في ناسا
نصب على اكثر من 100 مستثمر بمبلغ مليون باوند
عرض صناديق استثمار وهمية بدون ترخيص من FCA
اخفى الخسائر واستخدم اموال الناس لشراء منزل لنفسه
حكم عليه بالسجن سنتين في سبتمبر 2025
قرار المحكمة الجديد
محكمة Southwark في لندن امرت بدفع 655951.40 باوند
هذا المبلغ هو كل الاصول القابلة للاسترداد
الاموال ستعود مباشرة للضحايا
مع المدفوعات السابقة سيسترد الضحايا 99% من اموالهم
اذا لم يدفع خلال 3 اشهر سيضاف 5 سنوات سجن اضافية
رسالة FCA
قال ستيف سمارت مدير التنفيذ في FCA
السيد بيرفورد احتال على المستثمرين لتمويل اسلوب حياته الفاخر
استرداد الاموال المسروقة واعادتها للضحايا يرسل رسالة واضحة ان الجريمة لا تفيد
هذا يثبت قوة القانون البريطاني في حماية المستثمرين
#UKFCAWinsCourtOrderToRecover851400Pounds #UKFCA #بريطانيا #FCA #BinanceSquare
Mohammed _crypto sniper
·1 إعجاب
·81 مشاهدات
ChainlinkLaunchesCCIP2WithEnterpriseVerification
52,434 مشاهدات
1,014 يقومون بالنقاش
GoldFallsTo$4144
17,744 مشاهدات
169 يقومون بالنقاش