

Mughal007
3 منشورات

Mughal007
إبلاغ
حظر المُستخدم
فتح تداول
مُتداول عرضي
3 سنوات
1 تتابع
4 المتابعون
0 إعجاب
منشورات
الحافظة الاستثمارية
·
--
$ETH بصراحة، كان أداء ETH سيئًا جدًا هذا الشهر. فبعد محاولة الصعود نحو مستوى المقاومة عند 2,800 دولار قبل فترة، لم يتمكن المشترون من الحفاظ على الزخم. ويتراجع السعر حاليًا إلى نطاق يتراوح بين 2,310 و2,330 دولارًا، مسجلًا انخفاضًا بنحو 11 إلى 12% خلال شهر أكتوبر.
إذا كنت تتابع الرسوم البيانية، فهناك بعض الأمور اللافتة:
اختبار الدعم: يستقر السعر حاليًا عند مستوى 2,300 دولار تقريبًا، وهو مستوى بالغ الأهمية. فإذا كُسر هذا المستوى، فقد نرى بسهولة هبوطًا لاختبار منطقة 2,000 دولار النفسية.
المؤشرات: يقع مؤشر القوة النسبية (RSI) في منتصف نطاق الثلاثينيات، مقتربًا من منطقة التشبع البيعي. وهذا يعني عادةً أننا قد نشهد ارتدادًا محدودًا قريبًا، لكن الاتجاه العام لا يزال ضعيفًا. كما أن أحجام البيع في سوق العقود الآجلة كانت مهيمنة إلى حد كبير.
الأجواء: لم تكن التدفقات المؤسسية قوية بما يكفي لدعم السعر مؤخرًا، كما أن التوتر يخيّم على السوق الكلية الأوسع.
باختصار، الوضع الآن أشبه بانتظار ما ستسفر عنه الأمور. يحتاج ETH فعلًا إلى استعادة مستوى 2,400 دولار أو تجاوزه، والثبات فوقه، قبل أن يتمكن أي شخص من الحديث بجدية عن انعكاس الاتجاه.
ما نوع الفرص التي تراقبها حاليًا؟ هل تحاول إيجاد نقطة مناسبة للتجميع، أم تتابع رسوم Binance عن كثب لمعرفة أين سيستقر السعر؟ @Ethereum_official
{spot}(ETHUSDT)
#Ethereum
$ETH بصراحة، كان أداء ETH سيئًا جدًا هذا الشهر. فبعد محاولة الصعود نحو مستوى المقاومة عند 2,800 دولار قبل فترة، لم يتمكن المشترون من الحفاظ على الزخم. ويتراجع السعر حاليًا إلى نطاق يتراوح بين 2,310 و2,330 دولارًا، مسجلًا انخفاضًا بنحو 11 إلى 12% خلال شهر أكتوبر.
إذا كنت تتابع الرسوم البيانية، فهناك بعض الأمور اللافتة:
اختبار الدعم: يستقر السعر حاليًا عند مستوى 2,300 دولار تقريبًا، وهو مستوى بالغ الأهمية. فإذا كُسر هذا المستوى، فقد نرى بسهولة هبوطًا لاختبار منطقة 2,000 دولار النفسية.
المؤشرات: يقع مؤشر القوة النسبية (RSI) في منتصف نطاق الثلاثينيات، مقتربًا من منطقة التشبع البيعي. وهذا يعني عادةً أننا قد نشهد ارتدادًا محدودًا قريبًا، لكن الاتجاه العام لا يزال ضعيفًا. كما أن أحجام البيع في سوق العقود الآجلة كانت مهيمنة إلى حد كبير.
الأجواء: لم تكن التدفقات المؤسسية قوية بما يكفي لدعم السعر مؤخرًا، كما أن التوتر يخيّم على السوق الكلية الأوسع.
باختصار، الوضع الآن أشبه بانتظار ما ستسفر عنه الأمور. يحتاج ETH فعلًا إلى استعادة مستوى 2,400 دولار أو تجاوزه، والثبات فوقه، قبل أن يتمكن أي شخص من الحديث بجدية عن انعكاس الاتجاه.
ما نوع الفرص التي تراقبها حاليًا؟ هل تحاول إيجاد نقطة مناسبة للتجميع، أم تتابع رسوم Binance عن كثب لمعرفة أين سيستقر السعر؟ @Ethereum
#Ethereum

134
·
--
مقالة
عرض الترجمة
Bitcoin Analysis October 2026$BTC (BTC) Market Analysis – October 2026
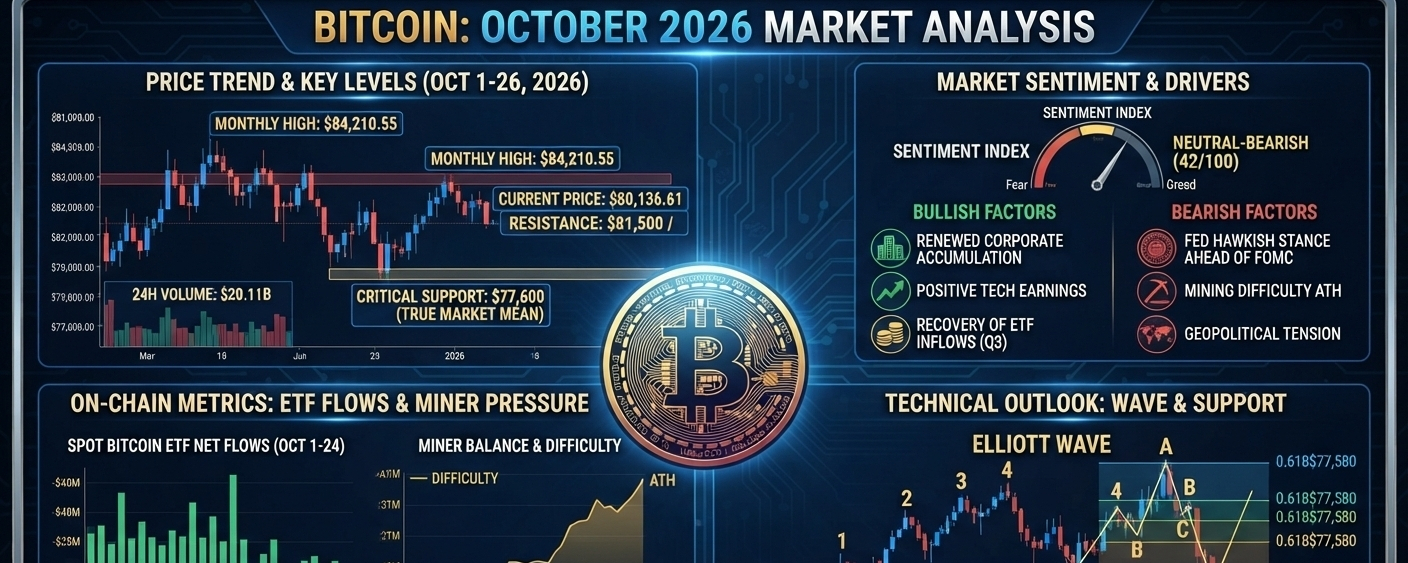
Bitcoin ($BTC) has experienced notable volatility in October 2026, dropping to the $77,600 region before attempting to stabilize around the $80,100 mark. The current market phase represents a critical consolidation period as the asset navigates contrasting macro-economic headwinds and fundamental on-chain shifts.
Here is a detailed breakdown of the technical, fundamental, and sentiment factors currently shaping Bitcoin's price action:
1. Price Action & Key Levels
After reaching a monthly high of $84,210.55, Bitcoin faced a correctional pull-back, touching a critical support level at $77,600. This support area is particularly significant as it aligns with the 2026 "True Market Mean" and previous high-volume node areas, offering a strong floor for bulls.
Resistance: Immidiate hurdles lie at the $81,500 to $82,500 range. For the bullish trend to resume with strength, $BTC needs to decisively break and hold above the $81,500 resistance.
Support: The $77,600 area remains the most vital defense line. A sustained breach below this point could see Bitcoin fall back to the $72,856 level, which coincides with the 200-day Moving Average (MA).
2. Market Sentiment: "Neutral-Bearish"
The Crypto Fear & Greed / Sentiment Index has dipped into Neutral-Bearish territory (42/100), reflecting cautiousness among retail and institutional players.
Bearish Drivers: General hesitation is fueled by a hawkish Federal Reserve stance heading into the upcoming FOMC meeting, alongside escalating geopolitical tensions. Furthermore, the network’s mining difficulty has hit an All-Time High (ATH), squeezing miner margins.
Bullish Undercurrents: Despite the fear, underlying institutional interest remains steady, marked by renewed corporate accumulation. The market is also benefiting from a general recovery trend in spot ETF interest after a mixed third quarter.
3. On-Chain Metrics & ETF Activity
ETF Flow Activity (Oct 1–24): Mid-October saw a period of net outflows (totaling around -$485M). Spot Bitcoin ETFs have seen sporadic daily activity as institutional desk managers adjust their portfolios ahead of year-end.
Miner Behavior: With the mining difficulty peaking, on-chain data shows Miner Balances decreasing slightly, indicating that miners may be selling off some holdings to cover rising operational costs. This miner capitulation pressure is currently keeping a lid on rapid upward movements.
4. Technical Outlook (Elliott Wave Analysis)
From a technical wave perspective, Bitcoin's drop from its local highs can be interpreted as a standard corrective 'Wave C' phase within an Elliott Wave pattern.
A natural ending to the correction appears to have formed around the $77,600 (0.618 Fibonacci level).
If the support continues to hold, we are likely to see a period of consolidation between $77,600 and $81,500.
An accumulation pattern in this range could lay the groundwork for the next impulsive 'Wave 5' upward push toward new highs later in the year.
Summary: The market is at a crossroads. While near-term headwinds like mining difficulty and macro-economic policies are caping large gains, Bitcoin's defense of the $77,600 level demonstrates resilient buy-side interest. A period of sideways consolidation is expected before the next major directional breakout.
Disclaimer: This analysis is for informational purposes only and does not constitute financial advice. Cryptocurrency markets are highly volatile
#bitcoin #cryptooinsigts

Bitcoin Analysis October 2026
$BTC (BTC) Market Analysis – October 2026
Bitcoin ($BTC ) has experienced notable volatility in October 2026, dropping to the $77,600 region before attempting to stabilize around the $80,100 mark. The current market phase represents a critical consolidation period as the asset navigates contrasting macro-economic headwinds and fundamental on-chain shifts.
Here is a detailed breakdown of the technical, fundamental, and sentiment factors currently shaping Bitcoin's price action:
1. Price Action & Key Levels
After reaching a monthly high of $84,210.55, Bitcoin faced a correctional pull-back, touching a critical support level at $77,600. This support area is particularly significant as it aligns with the 2026 "True Market Mean" and previous high-volume node areas, offering a strong floor for bulls.
Resistance: Immidiate hurdles lie at the $81,500 to $82,500 range. For the bullish trend to resume with strength, $BTC needs to decisively break and hold above the $81,500 resistance.
Support: The $77,600 area remains the most vital defense line. A sustained breach below this point could see Bitcoin fall back to the $72,856 level, which coincides with the 200-day Moving Average (MA).
2. Market Sentiment: "Neutral-Bearish"
The Crypto Fear & Greed / Sentiment Index has dipped into Neutral-Bearish territory (42/100), reflecting cautiousness among retail and institutional players.
Bearish Drivers: General hesitation is fueled by a hawkish Federal Reserve stance heading into the upcoming FOMC meeting, alongside escalating geopolitical tensions. Furthermore, the network’s mining difficulty has hit an All-Time High (ATH), squeezing miner margins.
Bullish Undercurrents: Despite the fear, underlying institutional interest remains steady, marked by renewed corporate accumulation. The market is also benefiting from a general recovery trend in spot ETF interest after a mixed third quarter.
3. On-Chain Metrics & ETF Activity
ETF Flow Activity (Oct 1–24): Mid-October saw a period of net outflows (totaling around -$485M). Spot Bitcoin ETFs have seen sporadic daily activity as institutional desk managers adjust their portfolios ahead of year-end.
Miner Behavior: With the mining difficulty peaking, on-chain data shows Miner Balances decreasing slightly, indicating that miners may be selling off some holdings to cover rising operational costs. This miner capitulation pressure is currently keeping a lid on rapid upward movements.
4. Technical Outlook (Elliott Wave Analysis)
From a technical wave perspective, Bitcoin's drop from its local highs can be interpreted as a standard corrective 'Wave C' phase within an Elliott Wave pattern.
A natural ending to the correction appears to have formed around the $77,600 (0.618 Fibonacci level).
If the support continues to hold, we are likely to see a period of consolidation between $77,600 and $81,500.
An accumulation pattern in this range could lay the groundwork for the next impulsive 'Wave 5' upward push toward new highs later in the year.
Summary: The market is at a crossroads. While near-term headwinds like mining difficulty and macro-economic policies are caping large gains, Bitcoin's defense of the $77,600 level demonstrates resilient buy-side interest. A period of sideways consolidation is expected before the next major directional breakout.
Disclaimer: This analysis is for informational purposes only and does not constitute financial advice. Cryptocurrency markets are highly volatile
#bitcoin #cryptooinsigts

71
·
--
#EarnFreeCrypto2024
أعتقد أنه ينبغي لنا أن نهدأ في الأوقات المالية الصعبة حتى نتمكن من صنع أوقات جيدة لأنفسنا.
#EarnFreeCrypto2024
أعتقد أنه ينبغي لنا أن نهدأ في الأوقات المالية الصعبة حتى نتمكن من صنع أوقات جيدة لأنفسنا.
أعتقد أنه ينبغي لنا أن نهدأ في الأوقات المالية الصعبة حتى نتمكن من صنع أوقات جيدة لأنفسنا.
1
138
سجّل الدخول لاستكشاف المزيد من المُحتوى
انضم إلى مُستخدمي العملات الرقمية حول العالم على Binance Square
⚡️ احصل على أحدث المعلومات المفيدة عن العملات الرقمية.
💬 موثوقة من قبل أكبر منصّة لتداول العملات الرقمية في العالم.
👍 اكتشف الرؤى الحقيقية من صنّاع المُحتوى الموثوقين.
البريد الإلكتروني / رقم الهاتف
المواضيع الرائجة
BinancePick
3M مشاهدات
152,141 يقومون بالنقاش
انضم إلى #موسم_الأرباح: توقّع الأرباح على Binance Pick وشاركنا رأيك على Binance Square!
Binance Square Official
·409 إعجاب
·342.6k مشاهدات
EarningsSeason
5.3M مشاهدات
25,852 يقومون بالنقاش
AnthropicTTMRevenueGrewAbout1200%
23,672 مشاهدات
356 يقومون بالنقاش