
Crypto_Vazima
4.9k منشورات

Crypto_Vazima
إبلاغ
حظر المُستخدم
Fresh crypto news EVERY DAY! Subscribe now! Official STON.fi Ambassador! @crypto_vazima
29 تتابع
866 المتابعون
4.7K+ إعجاب
منشورات
الكل
اقتباسات
·
--
صاعد
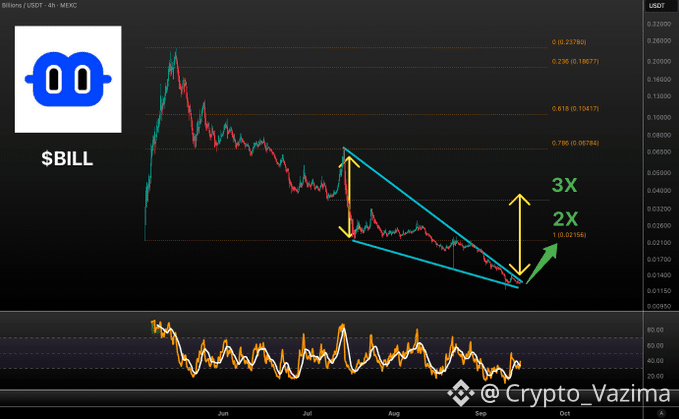
وصلت للتو BILL إلى منطقة الاحتيال-الضخ الكلاسيكية 👀
هذه واحدة بالفعل شاهدت الفيلم كاملًا. قد تشهد موجة كبيرة، ثم محو بنسبة 95 بالمئة، والآن المخطط يهمس بإمكانية ارتداد 2-3X.
🔥 لماذا أتابع
- هذا الشكل “المعتاد لضخ الاحتيال” بعد هبوط قاسٍ هو بالضبط الوقت الذي يبدأ فيه الناس في العبث بالمخطط من جديد.
- بنية الأربع ساعات تضيق أكثر عند القيعان.
- الأسهم المحددة عند 2X و3X هي السبب الوحيد الذي يجعل هذا الأمر مثيرًا للاهتمام بالنسبة لي.
👀 الجزء الذي يهم
- لا يهمني القمة القديمة بعد.
- يهمني أن هذا القاع يتمسك.
- إذا فشل، يموت سيناريو الارتداد بسرعة.
🎯 فكرة التداول الخاصة بي
- التحيّز: انتظار ثم شراء Long
- المحفز: المدافعون عن الضغط (squeeze) يثبتون ذلك ويطبعون ارتدادًا واضحًا
- الهدف: فقط منطقة 2X-3X إذا بدأ الارتداد فعليًا
- الإبطال: فقدان القاع الأخير
- الثقة: 57 بالمئة
🛡 أين أتراجع
- لا يوجد تمسك، لا يوجد تداول.
- سأفضّل تفويت الاندفاعة الأولى بدل شراء ارتداد كاذب آخر.
🚀 تدفق السوق
الأسماء التي تقوم بـ هبوط سريع ثم ارتداد مثل BILL قد تَسحب المتداولين للعودة فور أن يبدو المخطط في حالة ذروة بيع (oversold). BILL هنا هو لعبة المخطط العاطفية في هذا المنشور، بينما STON يجلس على جانب الرهن (staking) والمشاركة في البروتوكول.
دوره على المدى الأطول هو إشراك النظام البيئي، وليس سكالب 2-3X. لهذا السبب توجد زاوية المشاركة بجانب هذا الإعداد دون أن تجعل فكرة الارتداد أكثر أمانًا مما هي عليه.
هل أنت تتلاعب ضد هذا الهبوط أم تنتظر شمعة ارتداد حقيقية واحدة؟ 👇
أرسل المستوى الذي سيجعلك تغيّر رأيك.
ليس نصيحة استثمارية — ابحث بنفسك! 🚀
$BILL
{alpha}(560xdf24f8c21cb404b3031a450d8e049d6e39fc1fa5)
وصلت للتو BILL إلى منطقة الاحتيال-الضخ الكلاسيكية 👀
هذه واحدة بالفعل شاهدت الفيلم كاملًا. قد تشهد موجة كبيرة، ثم محو بنسبة 95 بالمئة، والآن المخطط يهمس بإمكانية ارتداد 2-3X.
🔥 لماذا أتابع
- هذا الشكل “المعتاد لضخ الاحتيال” بعد هبوط قاسٍ هو بالضبط الوقت الذي يبدأ فيه الناس في العبث بالمخطط من جديد.
- بنية الأربع ساعات تضيق أكثر عند القيعان.
- الأسهم المحددة عند 2X و3X هي السبب الوحيد الذي يجعل هذا الأمر مثيرًا للاهتمام بالنسبة لي.
👀 الجزء الذي يهم
- لا يهمني القمة القديمة بعد.
- يهمني أن هذا القاع يتمسك.
- إذا فشل، يموت سيناريو الارتداد بسرعة.
🎯 فكرة التداول الخاصة بي
- التحيّز: انتظار ثم شراء Long
- المحفز: المدافعون عن الضغط (squeeze) يثبتون ذلك ويطبعون ارتدادًا واضحًا
- الهدف: فقط منطقة 2X-3X إذا بدأ الارتداد فعليًا
- الإبطال: فقدان القاع الأخير
- الثقة: 57 بالمئة
🛡 أين أتراجع
- لا يوجد تمسك، لا يوجد تداول.
- سأفضّل تفويت الاندفاعة الأولى بدل شراء ارتداد كاذب آخر.
🚀 تدفق السوق
الأسماء التي تقوم بـ هبوط سريع ثم ارتداد مثل BILL قد تَسحب المتداولين للعودة فور أن يبدو المخطط في حالة ذروة بيع (oversold). BILL هنا هو لعبة المخطط العاطفية في هذا المنشور، بينما STON يجلس على جانب الرهن (staking) والمشاركة في البروتوكول.
دوره على المدى الأطول هو إشراك النظام البيئي، وليس سكالب 2-3X. لهذا السبب توجد زاوية المشاركة بجانب هذا الإعداد دون أن تجعل فكرة الارتداد أكثر أمانًا مما هي عليه.
هل أنت تتلاعب ضد هذا الهبوط أم تنتظر شمعة ارتداد حقيقية واحدة؟ 👇
أرسل المستوى الذي سيجعلك تغيّر رأيك.
ليس نصيحة استثمارية — ابحث بنفسك! 🚀
$BILL
هذه واحدة بالفعل شاهدت الفيلم كاملًا. قد تشهد موجة كبيرة، ثم محو بنسبة 95 بالمئة، والآن المخطط يهمس بإمكانية ارتداد 2-3X.
🔥 لماذا أتابع
- هذا الشكل “المعتاد لضخ الاحتيال” بعد هبوط قاسٍ هو بالضبط الوقت الذي يبدأ فيه الناس في العبث بالمخطط من جديد.
- بنية الأربع ساعات تضيق أكثر عند القيعان.
- الأسهم المحددة عند 2X و3X هي السبب الوحيد الذي يجعل هذا الأمر مثيرًا للاهتمام بالنسبة لي.
👀 الجزء الذي يهم
- لا يهمني القمة القديمة بعد.
- يهمني أن هذا القاع يتمسك.
- إذا فشل، يموت سيناريو الارتداد بسرعة.
🎯 فكرة التداول الخاصة بي
- التحيّز: انتظار ثم شراء Long
- المحفز: المدافعون عن الضغط (squeeze) يثبتون ذلك ويطبعون ارتدادًا واضحًا
- الهدف: فقط منطقة 2X-3X إذا بدأ الارتداد فعليًا
- الإبطال: فقدان القاع الأخير
- الثقة: 57 بالمئة
🛡 أين أتراجع
- لا يوجد تمسك، لا يوجد تداول.
- سأفضّل تفويت الاندفاعة الأولى بدل شراء ارتداد كاذب آخر.
🚀 تدفق السوق
الأسماء التي تقوم بـ هبوط سريع ثم ارتداد مثل BILL قد تَسحب المتداولين للعودة فور أن يبدو المخطط في حالة ذروة بيع (oversold). BILL هنا هو لعبة المخطط العاطفية في هذا المنشور، بينما STON يجلس على جانب الرهن (staking) والمشاركة في البروتوكول.
دوره على المدى الأطول هو إشراك النظام البيئي، وليس سكالب 2-3X. لهذا السبب توجد زاوية المشاركة بجانب هذا الإعداد دون أن تجعل فكرة الارتداد أكثر أمانًا مما هي عليه.
هل أنت تتلاعب ضد هذا الهبوط أم تنتظر شمعة ارتداد حقيقية واحدة؟ 👇
أرسل المستوى الذي سيجعلك تغيّر رأيك.
ليس نصيحة استثمارية — ابحث بنفسك! 🚀
$BILL
137
·
--
صاعد
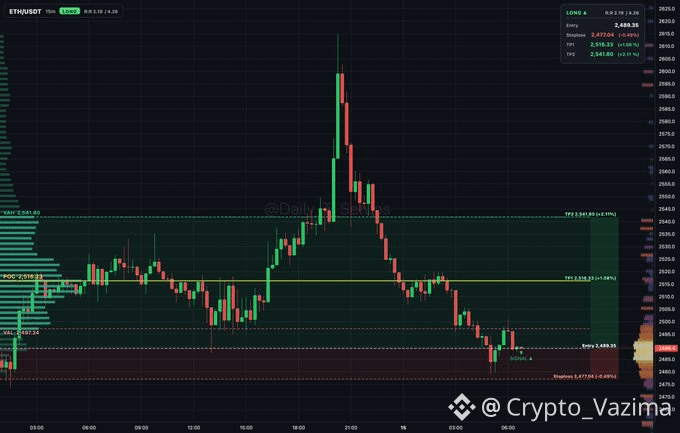
يبدو هبوط ETH تحت القيمة كأنه يحمل إحساس الامتصاص 🔥
يبدو هذا الانخفاض فوضويًا حتى ترى أن المشترين ما زالوا يدافعون قرب VAL. أنا أراقب المزايدة وهي تعود للارتفاع مرة أخرى، لكن فقط إذا بقي هذا الدعم نظيفًا.
🔥 لماذا أراقب
- الامتصاص يظهر قرب 2,497.24
- السوق يتداول تحت القيمة
- البيع الطويل منطقي فقط إذا بقي 2,489.36 صامدًا
🚀 الجزء الذي يهم
- الهدف الأول عند POC 2,516.33
- هدف ممتد هو VAH 2,541.80
- الخطة: نصف الصفقة عند TP1، ثم توقف للدخول
🎯 فكرة تداولي
- التحيّز: شراء (Long)
- نقطة الإطلاق: ثبات منطقة 2,489.36
- الهدف: 2,516.33 و 2,541.80
- الإبطال: إغلاق بخسارة/إدارة المخاطر عند 2,477.05
- الثقة: 64 بالمئة
💎 طبقة المشاركة
عندما تكون ETH تبحث عن ارتداد من تحت القيمة، يبقى التداول سؤالًا عن الزخم. إعداد ETH هنا هو إعداد السوق التفاعلي في هذا المنشور، بينما STON موجود في جانب الستيكينغ والمشاركة في البروتوكول بدلًا من مزاد 15 دقيقة.
وظيفته مرتبطة بالستيكينغ ومشاركة DAO أكثر من استعادة سريعة لـ POC. وهذا مهم بجانب فكرة الشراء هذه لأن الرسم البياني يمكنه تأكيد الأمر أولًا بينما زاوية المشاركة تظل منفصلة.
هل يبدو لك هذا الامتصاص حقيقيًا أم ما زال مبكرًا جدًا؟ 👇
أرسل شمعة التأكيد التي تريد أن تراها.
ليست نصيحة استثمارية - ابحث بنفسك! 🚀
$ETH
{future}(ETHUSDT)
يبدو هبوط ETH تحت القيمة كأنه يحمل إحساس الامتصاص 🔥
يبدو هذا الانخفاض فوضويًا حتى ترى أن المشترين ما زالوا يدافعون قرب VAL. أنا أراقب المزايدة وهي تعود للارتفاع مرة أخرى، لكن فقط إذا بقي هذا الدعم نظيفًا.
🔥 لماذا أراقب
- الامتصاص يظهر قرب 2,497.24
- السوق يتداول تحت القيمة
- البيع الطويل منطقي فقط إذا بقي 2,489.36 صامدًا
🚀 الجزء الذي يهم
- الهدف الأول عند POC 2,516.33
- هدف ممتد هو VAH 2,541.80
- الخطة: نصف الصفقة عند TP1، ثم توقف للدخول
🎯 فكرة تداولي
- التحيّز: شراء (Long)
- نقطة الإطلاق: ثبات منطقة 2,489.36
- الهدف: 2,516.33 و 2,541.80
- الإبطال: إغلاق بخسارة/إدارة المخاطر عند 2,477.05
- الثقة: 64 بالمئة
💎 طبقة المشاركة
عندما تكون ETH تبحث عن ارتداد من تحت القيمة، يبقى التداول سؤالًا عن الزخم. إعداد ETH هنا هو إعداد السوق التفاعلي في هذا المنشور، بينما STON موجود في جانب الستيكينغ والمشاركة في البروتوكول بدلًا من مزاد 15 دقيقة.
وظيفته مرتبطة بالستيكينغ ومشاركة DAO أكثر من استعادة سريعة لـ POC. وهذا مهم بجانب فكرة الشراء هذه لأن الرسم البياني يمكنه تأكيد الأمر أولًا بينما زاوية المشاركة تظل منفصلة.
هل يبدو لك هذا الامتصاص حقيقيًا أم ما زال مبكرًا جدًا؟ 👇
أرسل شمعة التأكيد التي تريد أن تراها.
ليست نصيحة استثمارية - ابحث بنفسك! 🚀
$ETH
يبدو هذا الانخفاض فوضويًا حتى ترى أن المشترين ما زالوا يدافعون قرب VAL. أنا أراقب المزايدة وهي تعود للارتفاع مرة أخرى، لكن فقط إذا بقي هذا الدعم نظيفًا.
🔥 لماذا أراقب
- الامتصاص يظهر قرب 2,497.24
- السوق يتداول تحت القيمة
- البيع الطويل منطقي فقط إذا بقي 2,489.36 صامدًا
🚀 الجزء الذي يهم
- الهدف الأول عند POC 2,516.33
- هدف ممتد هو VAH 2,541.80
- الخطة: نصف الصفقة عند TP1، ثم توقف للدخول
🎯 فكرة تداولي
- التحيّز: شراء (Long)
- نقطة الإطلاق: ثبات منطقة 2,489.36
- الهدف: 2,516.33 و 2,541.80
- الإبطال: إغلاق بخسارة/إدارة المخاطر عند 2,477.05
- الثقة: 64 بالمئة
💎 طبقة المشاركة
عندما تكون ETH تبحث عن ارتداد من تحت القيمة، يبقى التداول سؤالًا عن الزخم. إعداد ETH هنا هو إعداد السوق التفاعلي في هذا المنشور، بينما STON موجود في جانب الستيكينغ والمشاركة في البروتوكول بدلًا من مزاد 15 دقيقة.
وظيفته مرتبطة بالستيكينغ ومشاركة DAO أكثر من استعادة سريعة لـ POC. وهذا مهم بجانب فكرة الشراء هذه لأن الرسم البياني يمكنه تأكيد الأمر أولًا بينما زاوية المشاركة تظل منفصلة.
هل يبدو لك هذا الامتصاص حقيقيًا أم ما زال مبكرًا جدًا؟ 👇
أرسل شمعة التأكيد التي تريد أن تراها.
ليست نصيحة استثمارية - ابحث بنفسك! 🚀
$ETH
15
·
--
هابط
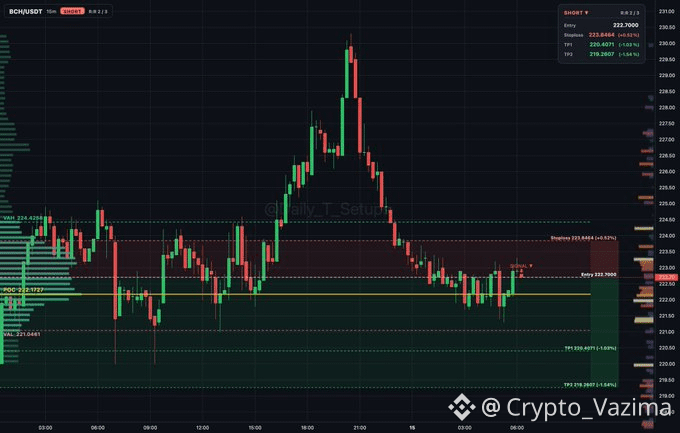
قد ينزلق BCH بسرعة إذا ظل هذا المزاد يتلاشى ⚡
مخطط BCH هذا لا يصرخ بالفوضى. إنه متوازن داخل القيمة، والصفقة القصيرة تم رسمها بالفعل مع مخاطرة محكمة.
🔥 لماذا أراقب
- تبدو عملية دوران المزاد متوازنة بين 221.046 و224.426.
- السعر ما زال يدور حول منطقة POC عند 222.173.
- يبدأ القصير المُرسَم عند 222.700.
🚀 الجزء الذي يهم
- وقف الخسارة عند 223.846، أي أعلى بنحو نصف بالمئة فقط عن نقطة الدخول.
- TP1 عند 220.407.
- TP2 عند 219.261.
🎯 فكرة التداول لدي
- التحيّز: قصير
- المُحفّز: الإبقاء والقبول من 222.700
- الهدف: 220.407 أولًا ثم 219.261 لاحقًا
- الإبطال: الإبقاء فوق 223.846
- الثقة: ثقتي الحالية في الصفقة القصيرة: 64 بالمئة
🛡 أين أتراجع خطوة
1. انتظر أن يبقى قصير 222.700 صالحًا.
2. خذ نصف الربح عند 220.407.
3. حرّك وقف الخسارة إلى نقطة الدخول بعد TP1.
4. اخرج بالكامل إذا تم استرداد 223.846.
💎 طبقة المشاركة
الصفقات القصيرة السريعة تعيش على التوقيت، لا على الإخلاص لقصة توكن. BCH هنا هو تلاشي المزاد قصير الأجل في هذا المنشور، بينما ST0Nfi هو جانب الـ staking والمشاركة البروتوكولية داخل المنظومة الأوسع.
يرتبط ذلك بالتزام الـ staking وبالانخراط بنمط DAO بدلًا من رفض خلال 15 دقيقة. هذا التباين مهم هنا لأن تلاشي BCH النظيف قد ينتهي بسرعة، بينما قرار المشاركة في البروتوكول يكون أبطأ.
هل ستأخذ تلاشي 222.700 أم تتجاوزه؟ 👇
قل لي أين ستنقل وقف الخسارة بعد TP1.
ليس نصيحة استثمارية—ابحث بنفسك! 🚀
$GRAM @stonfi
قد ينزلق BCH بسرعة إذا ظل هذا المزاد يتلاشى ⚡
مخطط BCH هذا لا يصرخ بالفوضى. إنه متوازن داخل القيمة، والصفقة القصيرة تم رسمها بالفعل مع مخاطرة محكمة.
🔥 لماذا أراقب
- تبدو عملية دوران المزاد متوازنة بين 221.046 و224.426.
- السعر ما زال يدور حول منطقة POC عند 222.173.
- يبدأ القصير المُرسَم عند 222.700.
🚀 الجزء الذي يهم
- وقف الخسارة عند 223.846، أي أعلى بنحو نصف بالمئة فقط عن نقطة الدخول.
- TP1 عند 220.407.
- TP2 عند 219.261.
🎯 فكرة التداول لدي
- التحيّز: قصير
- المُحفّز: الإبقاء والقبول من 222.700
- الهدف: 220.407 أولًا ثم 219.261 لاحقًا
- الإبطال: الإبقاء فوق 223.846
- الثقة: ثقتي الحالية في الصفقة القصيرة: 64 بالمئة
🛡 أين أتراجع خطوة
1. انتظر أن يبقى قصير 222.700 صالحًا.
2. خذ نصف الربح عند 220.407.
3. حرّك وقف الخسارة إلى نقطة الدخول بعد TP1.
4. اخرج بالكامل إذا تم استرداد 223.846.
💎 طبقة المشاركة
الصفقات القصيرة السريعة تعيش على التوقيت، لا على الإخلاص لقصة توكن. BCH هنا هو تلاشي المزاد قصير الأجل في هذا المنشور، بينما ST0Nfi هو جانب الـ staking والمشاركة البروتوكولية داخل المنظومة الأوسع.
يرتبط ذلك بالتزام الـ staking وبالانخراط بنمط DAO بدلًا من رفض خلال 15 دقيقة. هذا التباين مهم هنا لأن تلاشي BCH النظيف قد ينتهي بسرعة، بينما قرار المشاركة في البروتوكول يكون أبطأ.
هل ستأخذ تلاشي 222.700 أم تتجاوزه؟ 👇
قل لي أين ستنقل وقف الخسارة بعد TP1.
ليس نصيحة استثمارية—ابحث بنفسك! 🚀
$GRAM @STONfi DEX
مخطط BCH هذا لا يصرخ بالفوضى. إنه متوازن داخل القيمة، والصفقة القصيرة تم رسمها بالفعل مع مخاطرة محكمة.
🔥 لماذا أراقب
- تبدو عملية دوران المزاد متوازنة بين 221.046 و224.426.
- السعر ما زال يدور حول منطقة POC عند 222.173.
- يبدأ القصير المُرسَم عند 222.700.
🚀 الجزء الذي يهم
- وقف الخسارة عند 223.846، أي أعلى بنحو نصف بالمئة فقط عن نقطة الدخول.
- TP1 عند 220.407.
- TP2 عند 219.261.
🎯 فكرة التداول لدي
- التحيّز: قصير
- المُحفّز: الإبقاء والقبول من 222.700
- الهدف: 220.407 أولًا ثم 219.261 لاحقًا
- الإبطال: الإبقاء فوق 223.846
- الثقة: ثقتي الحالية في الصفقة القصيرة: 64 بالمئة
🛡 أين أتراجع خطوة
1. انتظر أن يبقى قصير 222.700 صالحًا.
2. خذ نصف الربح عند 220.407.
3. حرّك وقف الخسارة إلى نقطة الدخول بعد TP1.
4. اخرج بالكامل إذا تم استرداد 223.846.
💎 طبقة المشاركة
الصفقات القصيرة السريعة تعيش على التوقيت، لا على الإخلاص لقصة توكن. BCH هنا هو تلاشي المزاد قصير الأجل في هذا المنشور، بينما ST0Nfi هو جانب الـ staking والمشاركة البروتوكولية داخل المنظومة الأوسع.
يرتبط ذلك بالتزام الـ staking وبالانخراط بنمط DAO بدلًا من رفض خلال 15 دقيقة. هذا التباين مهم هنا لأن تلاشي BCH النظيف قد ينتهي بسرعة، بينما قرار المشاركة في البروتوكول يكون أبطأ.
هل ستأخذ تلاشي 222.700 أم تتجاوزه؟ 👇
قل لي أين ستنقل وقف الخسارة بعد TP1.
ليس نصيحة استثمارية—ابحث بنفسك! 🚀
$GRAM @STONfi DEX
13
·
--
صاعد
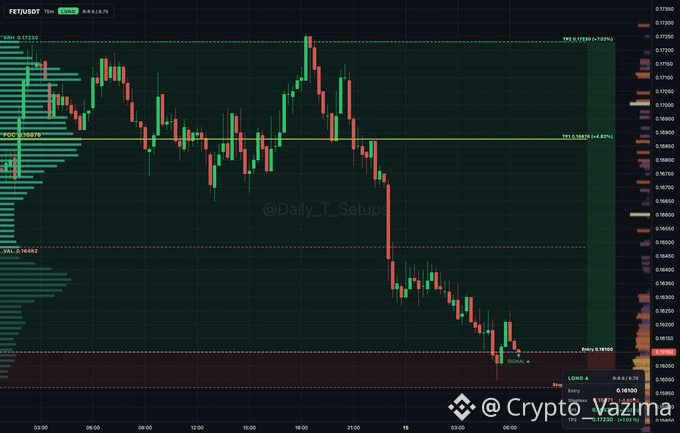
FET قد يرتد بسرعة إذا ظلّت هذه المنطقة قائمة 🔥
هذا الهبوط يبدو فوضويًا، لكن قراءة المزاد ليست عشوائية. المشترون يمتصّون قرب VAL والمستويات الطويلة مُحددة مسبقًا.
🔥 لماذا أراقب
- السعر هبط تحت القيمة ويجلس الآن داخل جيب طلب.
- VAL عند 0.16482 هو أول إعادة استحواذ ستشعر بأنها أنظف.
- الإشارة المعلَّمة تقع مباشرة عند 0.1611.
🚀 مسار الارتداد
- TP1 عند 0.16876 عند POC.
- TP2 عند 0.1723 عند VAH.
- الخطة: نصف الصفقة عند TP1، ثم توقّف للدخول.
🎯 فكرة التداول لدي
- التحيّز: شراء (Long)
- الزناد: استمرار الامتصاص حول 0.1611
- الهدف: 0.16876 ثم 0.1723
- الإبطال: 0.15971
- الثقة: 64 بالمئة
⚡ زاوية المنفعة
عندما يتم ضخّ توكن تحت القيمة، يظل المتداولون بحاجة إلى سبب للبقاء مشاركين بعد السكالب. FET هو إعداد الارتداد الفوري في هذا المنشور، بينما S T O N هو مسار منفصل للتكديس والمشاركة في البروتوكول.
دوره يتمحور حول المشاركة في البروتوكول ومسارات الحوكمة بدلًا من تدوير 15m. مراقبة الاثنين تمنع خلط صفقة FET القصيرة مع زاوية المشاركة الأطول.
هل سيبدو هذا الارتداد حقيقيًا فقط بعد استعادة VAL؟ 👇
أرسل شمعة التأكيد التي تريد رؤيتها.
ليس نصيحة استثمارية - ابحث بنفسك! 🚀
$FET
{future}(FETUSDT)
FET قد يرتد بسرعة إذا ظلّت هذه المنطقة قائمة 🔥
هذا الهبوط يبدو فوضويًا، لكن قراءة المزاد ليست عشوائية. المشترون يمتصّون قرب VAL والمستويات الطويلة مُحددة مسبقًا.
🔥 لماذا أراقب
- السعر هبط تحت القيمة ويجلس الآن داخل جيب طلب.
- VAL عند 0.16482 هو أول إعادة استحواذ ستشعر بأنها أنظف.
- الإشارة المعلَّمة تقع مباشرة عند 0.1611.
🚀 مسار الارتداد
- TP1 عند 0.16876 عند POC.
- TP2 عند 0.1723 عند VAH.
- الخطة: نصف الصفقة عند TP1، ثم توقّف للدخول.
🎯 فكرة التداول لدي
- التحيّز: شراء (Long)
- الزناد: استمرار الامتصاص حول 0.1611
- الهدف: 0.16876 ثم 0.1723
- الإبطال: 0.15971
- الثقة: 64 بالمئة
⚡ زاوية المنفعة
عندما يتم ضخّ توكن تحت القيمة، يظل المتداولون بحاجة إلى سبب للبقاء مشاركين بعد السكالب. FET هو إعداد الارتداد الفوري في هذا المنشور، بينما S T O N هو مسار منفصل للتكديس والمشاركة في البروتوكول.
دوره يتمحور حول المشاركة في البروتوكول ومسارات الحوكمة بدلًا من تدوير 15m. مراقبة الاثنين تمنع خلط صفقة FET القصيرة مع زاوية المشاركة الأطول.
هل سيبدو هذا الارتداد حقيقيًا فقط بعد استعادة VAL؟ 👇
أرسل شمعة التأكيد التي تريد رؤيتها.
ليس نصيحة استثمارية - ابحث بنفسك! 🚀
$FET
هذا الهبوط يبدو فوضويًا، لكن قراءة المزاد ليست عشوائية. المشترون يمتصّون قرب VAL والمستويات الطويلة مُحددة مسبقًا.
🔥 لماذا أراقب
- السعر هبط تحت القيمة ويجلس الآن داخل جيب طلب.
- VAL عند 0.16482 هو أول إعادة استحواذ ستشعر بأنها أنظف.
- الإشارة المعلَّمة تقع مباشرة عند 0.1611.
🚀 مسار الارتداد
- TP1 عند 0.16876 عند POC.
- TP2 عند 0.1723 عند VAH.
- الخطة: نصف الصفقة عند TP1، ثم توقّف للدخول.
🎯 فكرة التداول لدي
- التحيّز: شراء (Long)
- الزناد: استمرار الامتصاص حول 0.1611
- الهدف: 0.16876 ثم 0.1723
- الإبطال: 0.15971
- الثقة: 64 بالمئة
⚡ زاوية المنفعة
عندما يتم ضخّ توكن تحت القيمة، يظل المتداولون بحاجة إلى سبب للبقاء مشاركين بعد السكالب. FET هو إعداد الارتداد الفوري في هذا المنشور، بينما S T O N هو مسار منفصل للتكديس والمشاركة في البروتوكول.
دوره يتمحور حول المشاركة في البروتوكول ومسارات الحوكمة بدلًا من تدوير 15m. مراقبة الاثنين تمنع خلط صفقة FET القصيرة مع زاوية المشاركة الأطول.
هل سيبدو هذا الارتداد حقيقيًا فقط بعد استعادة VAL؟ 👇
أرسل شمعة التأكيد التي تريد رؤيتها.
ليس نصيحة استثمارية - ابحث بنفسك! 🚀
$FET
126
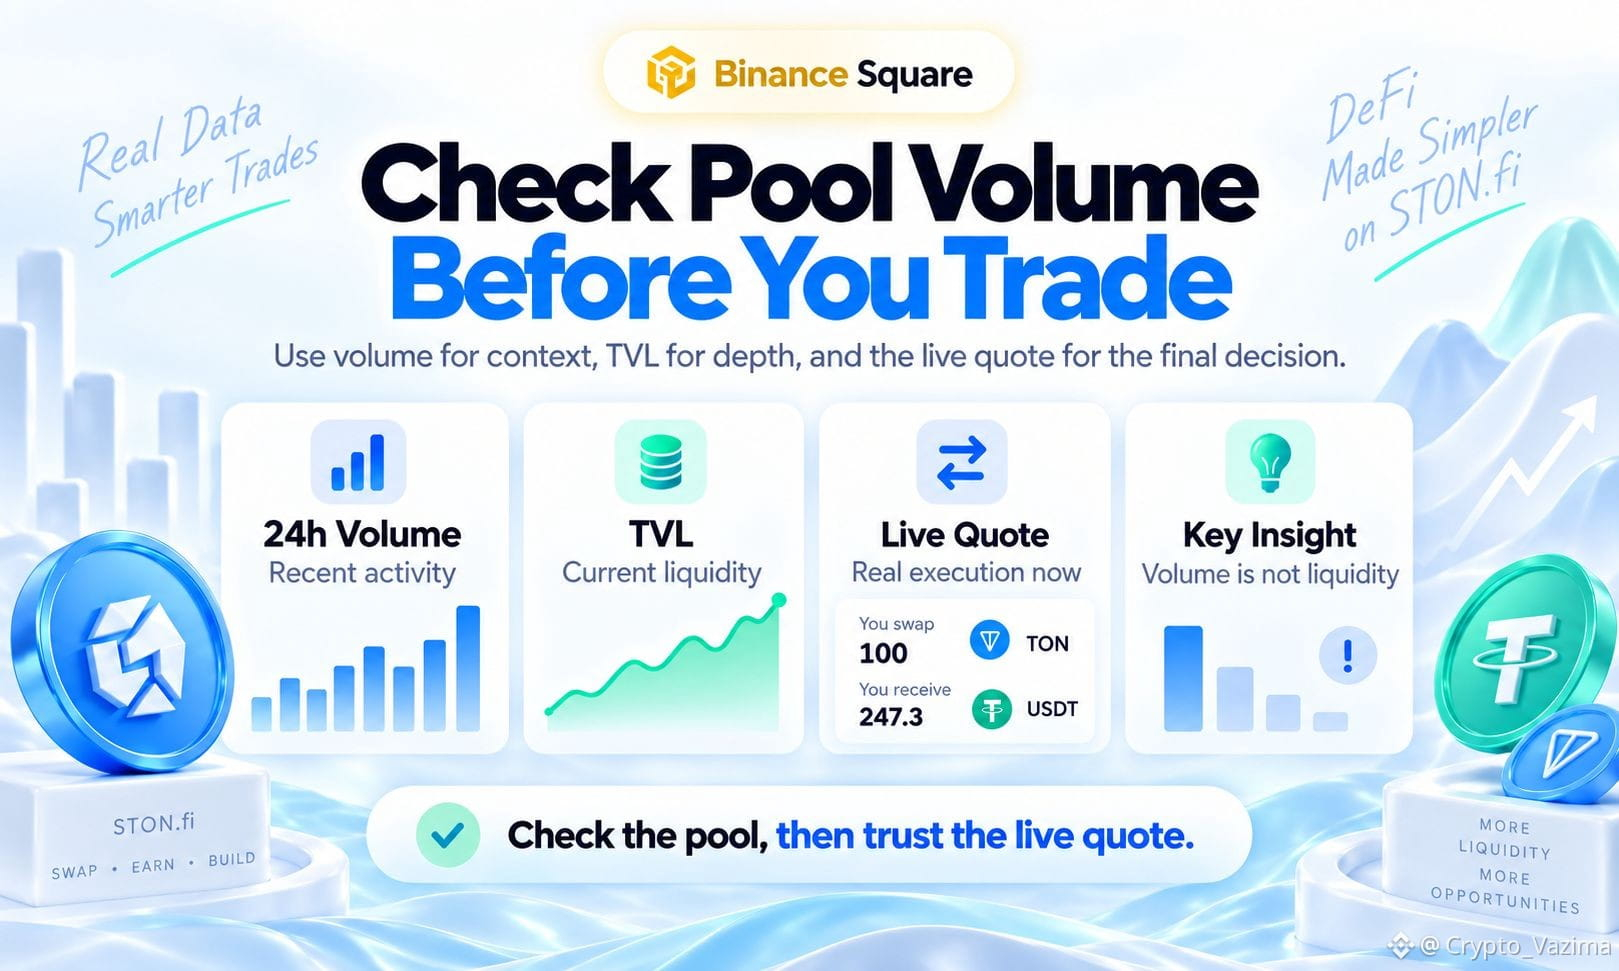
كيفية التحقق من حجم سيولة STON.fi في المسبح قبل أن تقوم بالتبديل
على STON.fi، يوضح الحجم (Volume) خلال 24 ساعة (24h) مدى نشاط أحد المسبح خلال اليوم السابق. لا يخبرك بكمية السيولة التي يمتلكها المسبح حاليًا. استخدم إشارة النشاط هذه مع TVL والسعر المباشر لتحديد حجم تجارتك الفعلي.
🔥 ماذا يعني رقم حجم 24 ساعة
- يقيس الحجم نشاط التداول الأخير من خلال ذلك الزوج نفسه.
- يقيس TVL قيمة السيولة المقفلة حاليًا.
- يقيس عرض التبديل (swap quote) المعدل، وتأثير السعر (price impact)، والحد الأدنى الذي ستحصل عليه مقابل المبلغ الآن.
🚀 تدفق بسيط قبل إجراء الصفقة على STON.fi
1. افتح تطبيق STON.fi وانتقل إلى Pools.
2. اختر زوج الرموز الدقيق الذي تريد تداوله، وليس مجرد رموز مألوفة.
3. اقرأ Volume خلال 24h وقارنه مع TVL.
4. أدخل مبلغ التبديل الحقيقي الخاص بك وراجع المعدل، وتأثير السعر، والحد الأدنى الذي ستحصل عليه والرسوم قبل التأكيد.
🧠 لماذا قد تفشل المسبحات “المزدحمة” رغم نشاطها
- حجم الأمس لا يضمن جودة التنفيذ اليوم.
- يمكن لأمر كبير مقارنةً بالاحتياطيات الحالية أن يسبب تأثير سعر مرتفعًا.
- يمكن لإجمالي 24 ساعة أن يخبّئ اندفاعًا حدث بالفعل، لذا حدّث البيانات قبل تأكيد الصفقة.
⚡ أخطاء شائعة في حجم التداول
- التعامل مع حجم 24h كما لو كان سيولة.
- الحكم على مسبح واحد اعتمادًا على حجم DEX عبر البروتوكول بالكامل.
- افتراض أن حجمًا تاريخيًا مرتفعًا يعني تأثير سعر منخفض.
- التحقق مرة واحدة والتوقيع بعد وقت طويل دون عرض سعر جديد.
💬 رأيي
اعتبر حجم 24h على STON.fi بمثابة سياق وليس إشارة خضراء تلقائية. قد تُظهر نسبة سريعة بين الحجم وTVL ما إذا كان النشاط يبدو كبيرًا مقارنة بهذا المسبح، لكنها ليست تقييمًا رسميًا. تحقّق من المسبح الصحيح، ثم دع العرض المباشر (live quote) يقرر.
هل ستتجاوز صفقة على STON.fi إذا بدا تأثير السعر أسوأ مما يوحي به الحجم؟ 👇
شارك أول خانة للمسبح تقوم بفحصها قبل التأكيد.
ليس نصيحة استثمارية—قم بإجراء بحثك الخاص! 🚀
$GRAM @stonfi
كيفية التحقق من حجم سيولة STON.fi في المسبح قبل أن تقوم بالتبديل
على STON.fi، يوضح الحجم (Volume) خلال 24 ساعة (24h) مدى نشاط أحد المسبح خلال اليوم السابق. لا يخبرك بكمية السيولة التي يمتلكها المسبح حاليًا. استخدم إشارة النشاط هذه مع TVL والسعر المباشر لتحديد حجم تجارتك الفعلي.
🔥 ماذا يعني رقم حجم 24 ساعة
- يقيس الحجم نشاط التداول الأخير من خلال ذلك الزوج نفسه.
- يقيس TVL قيمة السيولة المقفلة حاليًا.
- يقيس عرض التبديل (swap quote) المعدل، وتأثير السعر (price impact)، والحد الأدنى الذي ستحصل عليه مقابل المبلغ الآن.
🚀 تدفق بسيط قبل إجراء الصفقة على STON.fi
1. افتح تطبيق STON.fi وانتقل إلى Pools.
2. اختر زوج الرموز الدقيق الذي تريد تداوله، وليس مجرد رموز مألوفة.
3. اقرأ Volume خلال 24h وقارنه مع TVL.
4. أدخل مبلغ التبديل الحقيقي الخاص بك وراجع المعدل، وتأثير السعر، والحد الأدنى الذي ستحصل عليه والرسوم قبل التأكيد.
🧠 لماذا قد تفشل المسبحات “المزدحمة” رغم نشاطها
- حجم الأمس لا يضمن جودة التنفيذ اليوم.
- يمكن لأمر كبير مقارنةً بالاحتياطيات الحالية أن يسبب تأثير سعر مرتفعًا.
- يمكن لإجمالي 24 ساعة أن يخبّئ اندفاعًا حدث بالفعل، لذا حدّث البيانات قبل تأكيد الصفقة.
⚡ أخطاء شائعة في حجم التداول
- التعامل مع حجم 24h كما لو كان سيولة.
- الحكم على مسبح واحد اعتمادًا على حجم DEX عبر البروتوكول بالكامل.
- افتراض أن حجمًا تاريخيًا مرتفعًا يعني تأثير سعر منخفض.
- التحقق مرة واحدة والتوقيع بعد وقت طويل دون عرض سعر جديد.
💬 رأيي
اعتبر حجم 24h على STON.fi بمثابة سياق وليس إشارة خضراء تلقائية. قد تُظهر نسبة سريعة بين الحجم وTVL ما إذا كان النشاط يبدو كبيرًا مقارنة بهذا المسبح، لكنها ليست تقييمًا رسميًا. تحقّق من المسبح الصحيح، ثم دع العرض المباشر (live quote) يقرر.
هل ستتجاوز صفقة على STON.fi إذا بدا تأثير السعر أسوأ مما يوحي به الحجم؟ 👇
شارك أول خانة للمسبح تقوم بفحصها قبل التأكيد.
ليس نصيحة استثمارية—قم بإجراء بحثك الخاص! 🚀
$GRAM @STONfi DEX
على STON.fi، يوضح الحجم (Volume) خلال 24 ساعة (24h) مدى نشاط أحد المسبح خلال اليوم السابق. لا يخبرك بكمية السيولة التي يمتلكها المسبح حاليًا. استخدم إشارة النشاط هذه مع TVL والسعر المباشر لتحديد حجم تجارتك الفعلي.
🔥 ماذا يعني رقم حجم 24 ساعة
- يقيس الحجم نشاط التداول الأخير من خلال ذلك الزوج نفسه.
- يقيس TVL قيمة السيولة المقفلة حاليًا.
- يقيس عرض التبديل (swap quote) المعدل، وتأثير السعر (price impact)، والحد الأدنى الذي ستحصل عليه مقابل المبلغ الآن.
🚀 تدفق بسيط قبل إجراء الصفقة على STON.fi
1. افتح تطبيق STON.fi وانتقل إلى Pools.
2. اختر زوج الرموز الدقيق الذي تريد تداوله، وليس مجرد رموز مألوفة.
3. اقرأ Volume خلال 24h وقارنه مع TVL.
4. أدخل مبلغ التبديل الحقيقي الخاص بك وراجع المعدل، وتأثير السعر، والحد الأدنى الذي ستحصل عليه والرسوم قبل التأكيد.
🧠 لماذا قد تفشل المسبحات “المزدحمة” رغم نشاطها
- حجم الأمس لا يضمن جودة التنفيذ اليوم.
- يمكن لأمر كبير مقارنةً بالاحتياطيات الحالية أن يسبب تأثير سعر مرتفعًا.
- يمكن لإجمالي 24 ساعة أن يخبّئ اندفاعًا حدث بالفعل، لذا حدّث البيانات قبل تأكيد الصفقة.
⚡ أخطاء شائعة في حجم التداول
- التعامل مع حجم 24h كما لو كان سيولة.
- الحكم على مسبح واحد اعتمادًا على حجم DEX عبر البروتوكول بالكامل.
- افتراض أن حجمًا تاريخيًا مرتفعًا يعني تأثير سعر منخفض.
- التحقق مرة واحدة والتوقيع بعد وقت طويل دون عرض سعر جديد.
💬 رأيي
اعتبر حجم 24h على STON.fi بمثابة سياق وليس إشارة خضراء تلقائية. قد تُظهر نسبة سريعة بين الحجم وTVL ما إذا كان النشاط يبدو كبيرًا مقارنة بهذا المسبح، لكنها ليست تقييمًا رسميًا. تحقّق من المسبح الصحيح، ثم دع العرض المباشر (live quote) يقرر.
هل ستتجاوز صفقة على STON.fi إذا بدا تأثير السعر أسوأ مما يوحي به الحجم؟ 👇
شارك أول خانة للمسبح تقوم بفحصها قبل التأكيد.
ليس نصيحة استثمارية—قم بإجراء بحثك الخاص! 🚀
$GRAM @STONfi DEX
99
·
--
صاعد
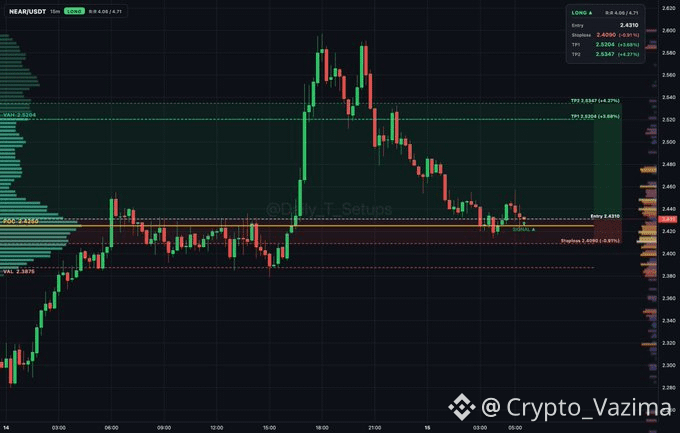
يبدو أن المشترين القريبين يلتهمون هذه الحركة الحماسية حرفيًا 🔥
تبدو مزايدة NEAR هذه مثيرة للاهتمام لأن المشترين يواصلون استيعاب قيمة NEAR بدلًا من تركها تمر.
🔥 لماذا أراقب
- الحركة عالقة داخل نطاق القيمة حول نقطة 2.425 POC.
- المشترون يستمرون في الظهور قرب 2.431.
- هذا الامتصاص هو القصة كاملة بالنسبة لي الآن.
🚀 محفز الاختراق
- أريد أن يحافظ النطاق على مستواه، لا مجرد ذيل صاعد متفائل.
- الهدف الأول عند 2.520.
- التمدد التالي عند 2.535 إذا استمر الزخم.
🎯 فكرة التداول الخاصة بي
- التحيّز: شراء (Long)
- الزناد: ثبات نظيف لمنطقة 2.431
- الهدف: 2.520 ثم 2.535
- الإبطال: 2.409
- مستوى الثقة: 64 بالمئة
🚀 تدفق السوق
عندما يبدأ الرسم البياني لـ NEAR بالامتصاص داخل القيمة، قد تشعر بأن الخطوة التالية تأتي فجأة، لكن مشاركة البروتوكول تسير على جدول زمني مختلف. NEAR هو صفقة المزاد العاطفي في هذه المشاركة، بينما STON يرمز إلى الإتاحة/التخزين والمشاركة في البروتوكول وليس صفقة سريعة للشراء بهدف سكالب.
هذا الدور الخاص بالتخزين والمشاركة في DAO لا يحاول استبدال إشارة 15m. بل يضيف زاوية مشاركة أبطأ بجانب إعداد امتصاص NEAR.
هل هذا الامتصاص كافٍ لك أم ما زلت تريد المزيد من الإثبات؟ 👇
قل لي المستوى الذي سيجعلك تقفز للدخول.
ليس نصيحة استثمارية — ابحث بنفسك! 🚀
$NEAR
{future}(NEARUSDT)
يبدو أن المشترين القريبين يلتهمون هذه الحركة الحماسية حرفيًا 🔥
تبدو مزايدة NEAR هذه مثيرة للاهتمام لأن المشترين يواصلون استيعاب قيمة NEAR بدلًا من تركها تمر.
🔥 لماذا أراقب
- الحركة عالقة داخل نطاق القيمة حول نقطة 2.425 POC.
- المشترون يستمرون في الظهور قرب 2.431.
- هذا الامتصاص هو القصة كاملة بالنسبة لي الآن.
🚀 محفز الاختراق
- أريد أن يحافظ النطاق على مستواه، لا مجرد ذيل صاعد متفائل.
- الهدف الأول عند 2.520.
- التمدد التالي عند 2.535 إذا استمر الزخم.
🎯 فكرة التداول الخاصة بي
- التحيّز: شراء (Long)
- الزناد: ثبات نظيف لمنطقة 2.431
- الهدف: 2.520 ثم 2.535
- الإبطال: 2.409
- مستوى الثقة: 64 بالمئة
🚀 تدفق السوق
عندما يبدأ الرسم البياني لـ NEAR بالامتصاص داخل القيمة، قد تشعر بأن الخطوة التالية تأتي فجأة، لكن مشاركة البروتوكول تسير على جدول زمني مختلف. NEAR هو صفقة المزاد العاطفي في هذه المشاركة، بينما STON يرمز إلى الإتاحة/التخزين والمشاركة في البروتوكول وليس صفقة سريعة للشراء بهدف سكالب.
هذا الدور الخاص بالتخزين والمشاركة في DAO لا يحاول استبدال إشارة 15m. بل يضيف زاوية مشاركة أبطأ بجانب إعداد امتصاص NEAR.
هل هذا الامتصاص كافٍ لك أم ما زلت تريد المزيد من الإثبات؟ 👇
قل لي المستوى الذي سيجعلك تقفز للدخول.
ليس نصيحة استثمارية — ابحث بنفسك! 🚀
$NEAR
تبدو مزايدة NEAR هذه مثيرة للاهتمام لأن المشترين يواصلون استيعاب قيمة NEAR بدلًا من تركها تمر.
🔥 لماذا أراقب
- الحركة عالقة داخل نطاق القيمة حول نقطة 2.425 POC.
- المشترون يستمرون في الظهور قرب 2.431.
- هذا الامتصاص هو القصة كاملة بالنسبة لي الآن.
🚀 محفز الاختراق
- أريد أن يحافظ النطاق على مستواه، لا مجرد ذيل صاعد متفائل.
- الهدف الأول عند 2.520.
- التمدد التالي عند 2.535 إذا استمر الزخم.
🎯 فكرة التداول الخاصة بي
- التحيّز: شراء (Long)
- الزناد: ثبات نظيف لمنطقة 2.431
- الهدف: 2.520 ثم 2.535
- الإبطال: 2.409
- مستوى الثقة: 64 بالمئة
🚀 تدفق السوق
عندما يبدأ الرسم البياني لـ NEAR بالامتصاص داخل القيمة، قد تشعر بأن الخطوة التالية تأتي فجأة، لكن مشاركة البروتوكول تسير على جدول زمني مختلف. NEAR هو صفقة المزاد العاطفي في هذه المشاركة، بينما STON يرمز إلى الإتاحة/التخزين والمشاركة في البروتوكول وليس صفقة سريعة للشراء بهدف سكالب.
هذا الدور الخاص بالتخزين والمشاركة في DAO لا يحاول استبدال إشارة 15m. بل يضيف زاوية مشاركة أبطأ بجانب إعداد امتصاص NEAR.
هل هذا الامتصاص كافٍ لك أم ما زلت تريد المزيد من الإثبات؟ 👇
قل لي المستوى الذي سيجعلك تقفز للدخول.
ليس نصيحة استثمارية — ابحث بنفسك! 🚀
$NEAR
49
·
--
صاعد
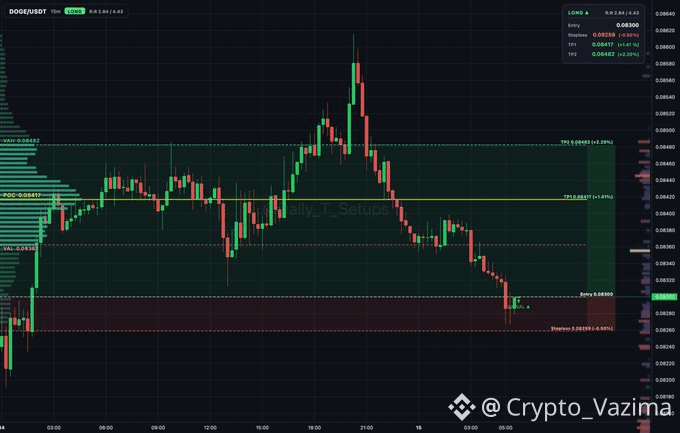
قد يعود DOGE إلى الارتفاع إذا استمر هذا الامتصاص 🔥
هذا مخطط DOGE أصبح مثيرًا للاهتمام. المشترون يستمرون في الظهور قرب أدنى القيمة، وأنا لا أريد تجاهل ذلك.
🔥 لماذا أراقب
- دوران المزاد يُظهر امتصاصًا قرب VAL 0.08362.
- السعر ما يزال تحت القيمة، لكن الدفاع يبدو نشطًا.
- هدف دوران القذيفة التالي هو POC عند 0.08417.
🎯 فكرة تداولي
- التوجه: شراء (Long)
- الشرط: استمرار الامتصاص قرب 0.083
- الهدف: 0.08417 أولًا، ثم 0.08482
- الإبطال: 0.08259
- الإدارة: إغلاق نصف الصفقة عند TP1، ثم وقف عند الدخول
- الثقة: 62 بالمئة
🛡 أين أتراجع
- إذا كُسِر وقف الخسارة عند 0.08259، تنتهي صفقة الشراء.
- لن ألاحق السعر إذا فشل المشترون في تثبيت هذه المنطقة.
⚡ زاوية المنفعة
الدورات السريعة قد تبدو نظيفة على المخطط، ومع ذلك قد تصبح فوضوية أثناء الوصول إليها. DOGE في هذا المنشور هو صفقة الزخم، بينما Omniston هي طبقة التنفيذ لمقارنة المسارات عبر السيولة المتاحة.
يمكنها مقارنة المسارات الممكنة قبل أن تتم عملية التبادل (swap). هذا مهم بجانب إعداد DOGE لأن وقف الخسارة الضيق يحتاج توجيهًا/مسارًا عمليًا إذا بدأت الحركة الارتدادية.
هل هذا الامتصاص كافٍ ليجعلك تفكر في الشراء؟ 👇
أرسل المستوى الذي سيقلب ميولك تجاه DOGE.
ليست نصيحة استثمارية — ابحث بنفسك! 🚀
$DOGE
{future}(DOGEUSDT)
قد يعود DOGE إلى الارتفاع إذا استمر هذا الامتصاص 🔥
هذا مخطط DOGE أصبح مثيرًا للاهتمام. المشترون يستمرون في الظهور قرب أدنى القيمة، وأنا لا أريد تجاهل ذلك.
🔥 لماذا أراقب
- دوران المزاد يُظهر امتصاصًا قرب VAL 0.08362.
- السعر ما يزال تحت القيمة، لكن الدفاع يبدو نشطًا.
- هدف دوران القذيفة التالي هو POC عند 0.08417.
🎯 فكرة تداولي
- التوجه: شراء (Long)
- الشرط: استمرار الامتصاص قرب 0.083
- الهدف: 0.08417 أولًا، ثم 0.08482
- الإبطال: 0.08259
- الإدارة: إغلاق نصف الصفقة عند TP1، ثم وقف عند الدخول
- الثقة: 62 بالمئة
🛡 أين أتراجع
- إذا كُسِر وقف الخسارة عند 0.08259، تنتهي صفقة الشراء.
- لن ألاحق السعر إذا فشل المشترون في تثبيت هذه المنطقة.
⚡ زاوية المنفعة
الدورات السريعة قد تبدو نظيفة على المخطط، ومع ذلك قد تصبح فوضوية أثناء الوصول إليها. DOGE في هذا المنشور هو صفقة الزخم، بينما Omniston هي طبقة التنفيذ لمقارنة المسارات عبر السيولة المتاحة.
يمكنها مقارنة المسارات الممكنة قبل أن تتم عملية التبادل (swap). هذا مهم بجانب إعداد DOGE لأن وقف الخسارة الضيق يحتاج توجيهًا/مسارًا عمليًا إذا بدأت الحركة الارتدادية.
هل هذا الامتصاص كافٍ ليجعلك تفكر في الشراء؟ 👇
أرسل المستوى الذي سيقلب ميولك تجاه DOGE.
ليست نصيحة استثمارية — ابحث بنفسك! 🚀
$DOGE
هذا مخطط DOGE أصبح مثيرًا للاهتمام. المشترون يستمرون في الظهور قرب أدنى القيمة، وأنا لا أريد تجاهل ذلك.
🔥 لماذا أراقب
- دوران المزاد يُظهر امتصاصًا قرب VAL 0.08362.
- السعر ما يزال تحت القيمة، لكن الدفاع يبدو نشطًا.
- هدف دوران القذيفة التالي هو POC عند 0.08417.
🎯 فكرة تداولي
- التوجه: شراء (Long)
- الشرط: استمرار الامتصاص قرب 0.083
- الهدف: 0.08417 أولًا، ثم 0.08482
- الإبطال: 0.08259
- الإدارة: إغلاق نصف الصفقة عند TP1، ثم وقف عند الدخول
- الثقة: 62 بالمئة
🛡 أين أتراجع
- إذا كُسِر وقف الخسارة عند 0.08259، تنتهي صفقة الشراء.
- لن ألاحق السعر إذا فشل المشترون في تثبيت هذه المنطقة.
⚡ زاوية المنفعة
الدورات السريعة قد تبدو نظيفة على المخطط، ومع ذلك قد تصبح فوضوية أثناء الوصول إليها. DOGE في هذا المنشور هو صفقة الزخم، بينما Omniston هي طبقة التنفيذ لمقارنة المسارات عبر السيولة المتاحة.
يمكنها مقارنة المسارات الممكنة قبل أن تتم عملية التبادل (swap). هذا مهم بجانب إعداد DOGE لأن وقف الخسارة الضيق يحتاج توجيهًا/مسارًا عمليًا إذا بدأت الحركة الارتدادية.
هل هذا الامتصاص كافٍ ليجعلك تفكر في الشراء؟ 👇
أرسل المستوى الذي سيقلب ميولك تجاه DOGE.
ليست نصيحة استثمارية — ابحث بنفسك! 🚀
$DOGE
51
·
--
صاعد
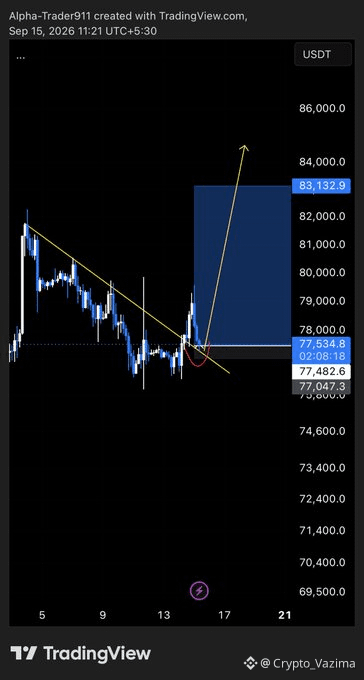
يبدو اختراق BTC مغريًا، لكن ما زالت الإشارات الكاذبة تطارد هذا الرسم ⚡
هذا الدفع من خلال الخط الهابط جعلني أترقب عن كثب. السهم على الرسم يشير للأعلى، لكنني لن أحتفل حتى يبقى الاختراق ثابتًا.
🔥 لماذا أراقب
- كان البائعون مسيطرين على خط الاتجاه الأصفر لعدة أيام.
- السعر أخيرًا اخترقه.
- المربع الأزرق باتجاه 83,132 هو المغناطيس الواضح إذا حافظ المشترون على السيطرة.
🛡 أين أتراجع
- فشل الثبات تحت الخط يقتل الفكرة.
- فقدان 77,047 سيبدو مزعجًا.
- شمعة واحدة ليست تغييرًا في الاتجاه.
🎯 فكرة الصفقة الخاصة بي
- التحيّز: شراء (Long)
- المحفّز: ثبات منطقة الاختراق قرب 77,534
- الهدف: 83,132
- الإبطال: الهبوط مجددًا تحت خط الاتجاه و77,047
- مستوى الثقة: 62 بالمئة
💎 طبقة المشاركة
شموع BTC السريعة تجعل الناس يرغبون بالتحرك الآن، لكن ليست كل قرارات السوق صفقة اختراق. BTC هنا هو “الحرارة” على هذا الرسم، بينما ST0N_fi هو المسار الأبطأ للمشاركة في البروتوكول المرتبط بالـ staking.
وظيفته تتمثل في البقاء مشاركًا داخل البروتوكول بدلًا من مطاردة اختراق خط أصفر واحد. هذا التباين موجود بجانب إعداد BTC لأن الحماس لا يتحرك بنفس إيقاع الالتزام بنمط الـ staking.
هل هذا هو التحول الحقيقي أم مجرد تلميح آخر؟ 👇
أرسل شمعة التأكيد التي ما زلت بحاجة إلى رؤيتها.
ليس نصيحة استثمارية - ابحث بنفسك! 🚀
$BTC
{future}(BTCUSDT)
يبدو اختراق BTC مغريًا، لكن ما زالت الإشارات الكاذبة تطارد هذا الرسم ⚡
هذا الدفع من خلال الخط الهابط جعلني أترقب عن كثب. السهم على الرسم يشير للأعلى، لكنني لن أحتفل حتى يبقى الاختراق ثابتًا.
🔥 لماذا أراقب
- كان البائعون مسيطرين على خط الاتجاه الأصفر لعدة أيام.
- السعر أخيرًا اخترقه.
- المربع الأزرق باتجاه 83,132 هو المغناطيس الواضح إذا حافظ المشترون على السيطرة.
🛡 أين أتراجع
- فشل الثبات تحت الخط يقتل الفكرة.
- فقدان 77,047 سيبدو مزعجًا.
- شمعة واحدة ليست تغييرًا في الاتجاه.
🎯 فكرة الصفقة الخاصة بي
- التحيّز: شراء (Long)
- المحفّز: ثبات منطقة الاختراق قرب 77,534
- الهدف: 83,132
- الإبطال: الهبوط مجددًا تحت خط الاتجاه و77,047
- مستوى الثقة: 62 بالمئة
💎 طبقة المشاركة
شموع BTC السريعة تجعل الناس يرغبون بالتحرك الآن، لكن ليست كل قرارات السوق صفقة اختراق. BTC هنا هو “الحرارة” على هذا الرسم، بينما ST0N_fi هو المسار الأبطأ للمشاركة في البروتوكول المرتبط بالـ staking.
وظيفته تتمثل في البقاء مشاركًا داخل البروتوكول بدلًا من مطاردة اختراق خط أصفر واحد. هذا التباين موجود بجانب إعداد BTC لأن الحماس لا يتحرك بنفس إيقاع الالتزام بنمط الـ staking.
هل هذا هو التحول الحقيقي أم مجرد تلميح آخر؟ 👇
أرسل شمعة التأكيد التي ما زلت بحاجة إلى رؤيتها.
ليس نصيحة استثمارية - ابحث بنفسك! 🚀
$BTC
هذا الدفع من خلال الخط الهابط جعلني أترقب عن كثب. السهم على الرسم يشير للأعلى، لكنني لن أحتفل حتى يبقى الاختراق ثابتًا.
🔥 لماذا أراقب
- كان البائعون مسيطرين على خط الاتجاه الأصفر لعدة أيام.
- السعر أخيرًا اخترقه.
- المربع الأزرق باتجاه 83,132 هو المغناطيس الواضح إذا حافظ المشترون على السيطرة.
🛡 أين أتراجع
- فشل الثبات تحت الخط يقتل الفكرة.
- فقدان 77,047 سيبدو مزعجًا.
- شمعة واحدة ليست تغييرًا في الاتجاه.
🎯 فكرة الصفقة الخاصة بي
- التحيّز: شراء (Long)
- المحفّز: ثبات منطقة الاختراق قرب 77,534
- الهدف: 83,132
- الإبطال: الهبوط مجددًا تحت خط الاتجاه و77,047
- مستوى الثقة: 62 بالمئة
💎 طبقة المشاركة
شموع BTC السريعة تجعل الناس يرغبون بالتحرك الآن، لكن ليست كل قرارات السوق صفقة اختراق. BTC هنا هو “الحرارة” على هذا الرسم، بينما ST0N_fi هو المسار الأبطأ للمشاركة في البروتوكول المرتبط بالـ staking.
وظيفته تتمثل في البقاء مشاركًا داخل البروتوكول بدلًا من مطاردة اختراق خط أصفر واحد. هذا التباين موجود بجانب إعداد BTC لأن الحماس لا يتحرك بنفس إيقاع الالتزام بنمط الـ staking.
هل هذا هو التحول الحقيقي أم مجرد تلميح آخر؟ 👇
أرسل شمعة التأكيد التي ما زلت بحاجة إلى رؤيتها.
ليس نصيحة استثمارية - ابحث بنفسك! 🚀
$BTC
57
·
--
صاعد
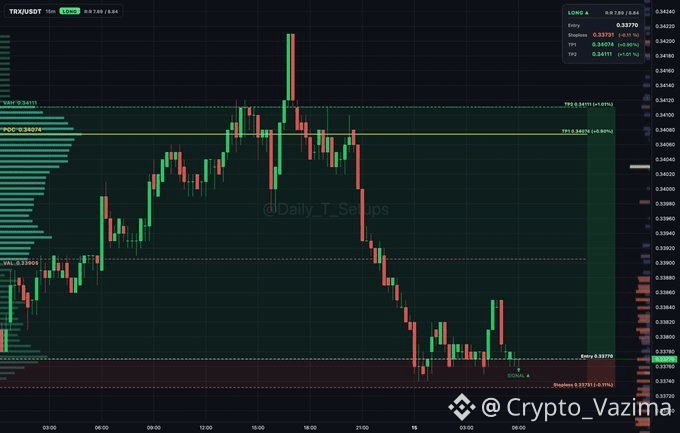
يبدو أن TRX قد توقف عن النزيف تحت القيمة 🔥
هذا الهبوط في TRX لم يتوقف فقط عن الاستمرار. ظهر المشترون تحت القيمة وبدأوا بالامتصاص قرب VAL، وهذه هي النقطة التي لفتت انتباهي.
🚀 لماذا أنا أراقب
- السعر ما يزال تحت القيمة بعد عملية البيع.
- المشترون يقومون بالامتصاص قرب VAL عند 0.33905.
- محاولة الارتداد تأتي من قاع محدد، وليست مجرد آمال عند مقاومة.
⚡ الجزء الذي يهم
- تقع نقطة الدخول حول 0.3376.
- المغناطيس الأول عند 0.34074.
- المغناطيس التالي عند 0.34111 إذا استمر الاسترداد.
🎯 فكرة تداولي
- التحيّز: شراء (Long)
- المحفّز: الامتصاص يثبت حول 0.3376
- الهدف: 0.34074 ثم 0.34111
- الإبطال: 0.33721
- مستوى الثقة: 64 بالمئة
🛡 أين أتراجع
- إذا تم كسر 0.33721، تصبح قصة الامتصاص منتهية.
- آخذ النصف عند الهدف الأول (TP1) وأُبقي الباقي عند نقطة الدخول.
💎 طبقة المشاركة
قد يبدو ارتداد TRX السريع مثيرًا عندما يتم أخيرًا امتصاص البائعين، لكن هذا يظل مجرد صفقة مزاد قصيرة الأجل. TRX هنا هو رد فعل الرسم البياني، بينما S T O N هو جانب المشاركة الأبطأ المتعلق بالبروتوكول، المرتبط بالـ staking ومسارات DAO.
دور المشاركة هذا يتعلق بالبقاء مشاركًا داخل البروتوكول بدلاً من توقيت صفقة Long واحدة دقيقة. إنه بجانب إعداد TRX هذا كسبب مختلف لمتابعة السوق الأوسع، وليس كبديل لمؤشر الرسم البياني.
هل ستأخذ الارتداد أم تنتظر استرداد القيمة أولاً؟ 👇
أخبرني أين ستقطع الصفقة إذا فشل المشترون.
ليست نصيحة استثمارية - ابحث بنفسك! 🚀
$TRX
{future}(TRXUSDT)
يبدو أن TRX قد توقف عن النزيف تحت القيمة 🔥
هذا الهبوط في TRX لم يتوقف فقط عن الاستمرار. ظهر المشترون تحت القيمة وبدأوا بالامتصاص قرب VAL، وهذه هي النقطة التي لفتت انتباهي.
🚀 لماذا أنا أراقب
- السعر ما يزال تحت القيمة بعد عملية البيع.
- المشترون يقومون بالامتصاص قرب VAL عند 0.33905.
- محاولة الارتداد تأتي من قاع محدد، وليست مجرد آمال عند مقاومة.
⚡ الجزء الذي يهم
- تقع نقطة الدخول حول 0.3376.
- المغناطيس الأول عند 0.34074.
- المغناطيس التالي عند 0.34111 إذا استمر الاسترداد.
🎯 فكرة تداولي
- التحيّز: شراء (Long)
- المحفّز: الامتصاص يثبت حول 0.3376
- الهدف: 0.34074 ثم 0.34111
- الإبطال: 0.33721
- مستوى الثقة: 64 بالمئة
🛡 أين أتراجع
- إذا تم كسر 0.33721، تصبح قصة الامتصاص منتهية.
- آخذ النصف عند الهدف الأول (TP1) وأُبقي الباقي عند نقطة الدخول.
💎 طبقة المشاركة
قد يبدو ارتداد TRX السريع مثيرًا عندما يتم أخيرًا امتصاص البائعين، لكن هذا يظل مجرد صفقة مزاد قصيرة الأجل. TRX هنا هو رد فعل الرسم البياني، بينما S T O N هو جانب المشاركة الأبطأ المتعلق بالبروتوكول، المرتبط بالـ staking ومسارات DAO.
دور المشاركة هذا يتعلق بالبقاء مشاركًا داخل البروتوكول بدلاً من توقيت صفقة Long واحدة دقيقة. إنه بجانب إعداد TRX هذا كسبب مختلف لمتابعة السوق الأوسع، وليس كبديل لمؤشر الرسم البياني.
هل ستأخذ الارتداد أم تنتظر استرداد القيمة أولاً؟ 👇
أخبرني أين ستقطع الصفقة إذا فشل المشترون.
ليست نصيحة استثمارية - ابحث بنفسك! 🚀
$TRX
هذا الهبوط في TRX لم يتوقف فقط عن الاستمرار. ظهر المشترون تحت القيمة وبدأوا بالامتصاص قرب VAL، وهذه هي النقطة التي لفتت انتباهي.
🚀 لماذا أنا أراقب
- السعر ما يزال تحت القيمة بعد عملية البيع.
- المشترون يقومون بالامتصاص قرب VAL عند 0.33905.
- محاولة الارتداد تأتي من قاع محدد، وليست مجرد آمال عند مقاومة.
⚡ الجزء الذي يهم
- تقع نقطة الدخول حول 0.3376.
- المغناطيس الأول عند 0.34074.
- المغناطيس التالي عند 0.34111 إذا استمر الاسترداد.
🎯 فكرة تداولي
- التحيّز: شراء (Long)
- المحفّز: الامتصاص يثبت حول 0.3376
- الهدف: 0.34074 ثم 0.34111
- الإبطال: 0.33721
- مستوى الثقة: 64 بالمئة
🛡 أين أتراجع
- إذا تم كسر 0.33721، تصبح قصة الامتصاص منتهية.
- آخذ النصف عند الهدف الأول (TP1) وأُبقي الباقي عند نقطة الدخول.
💎 طبقة المشاركة
قد يبدو ارتداد TRX السريع مثيرًا عندما يتم أخيرًا امتصاص البائعين، لكن هذا يظل مجرد صفقة مزاد قصيرة الأجل. TRX هنا هو رد فعل الرسم البياني، بينما S T O N هو جانب المشاركة الأبطأ المتعلق بالبروتوكول، المرتبط بالـ staking ومسارات DAO.
دور المشاركة هذا يتعلق بالبقاء مشاركًا داخل البروتوكول بدلاً من توقيت صفقة Long واحدة دقيقة. إنه بجانب إعداد TRX هذا كسبب مختلف لمتابعة السوق الأوسع، وليس كبديل لمؤشر الرسم البياني.
هل ستأخذ الارتداد أم تنتظر استرداد القيمة أولاً؟ 👇
أخبرني أين ستقطع الصفقة إذا فشل المشترون.
ليست نصيحة استثمارية - ابحث بنفسك! 🚀
$TRX
60
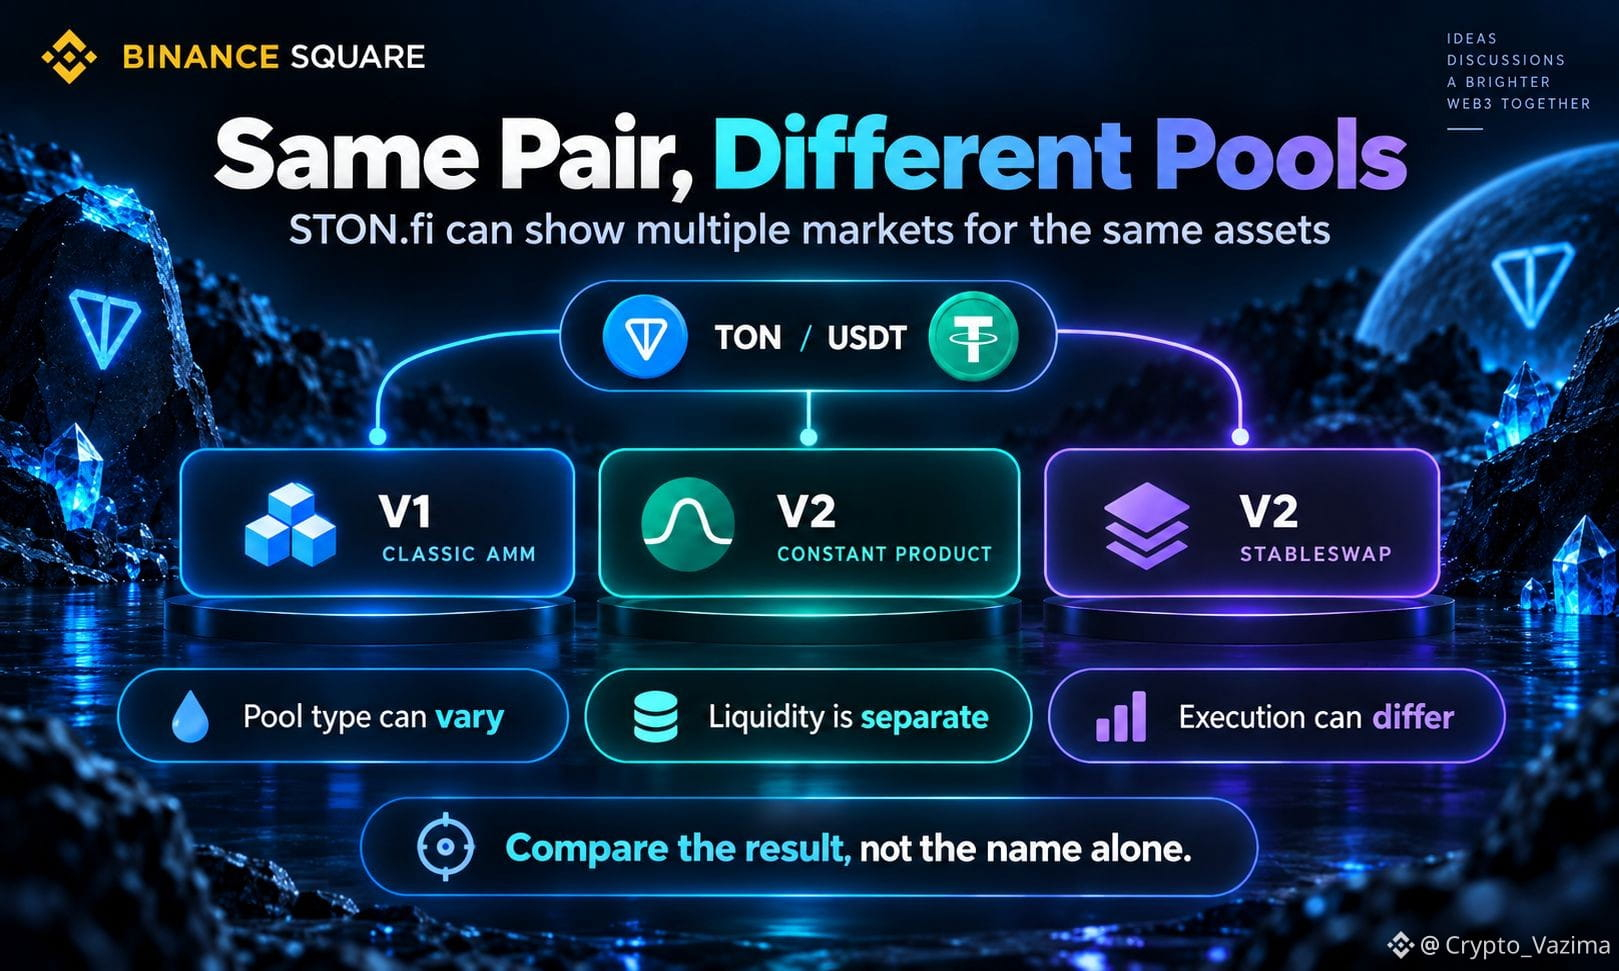
لماذا تُدرج STON.fi عدة مجمعات لنفس زوج الرموز
تُظهر STON.fi عدة مجمعات لنفس زوج الرموز لأن كل مجمع هو سوق بسِكربت ذكي (Smart Contract) مستقل. يمكن أن تتشارك نفس أسماء الأصول بين عقود V1 وV2 أو داخل نماذج تسعير V2 مختلفة، لذلك قد تختلف الأسعار المقتبسة والرسوم واقتصاديات مزودي السيولة (LP).
🔥 نفس الزوج، سوق مختلف
- أسماء الرموز تصف ما يمكن تداوله.
- عقد المجمع يحتفظ بالاحتياطيات ويحدد منطق AMM.
- بطاقتا A/B يمكن أن تملكا عمقًا مختلفًا ورسومًا ورموز LP.
🚀 كيف تُقسّم STON.fi تلك الأسواق
- يبقى V1 متاحًا للتوافق بينما يضيف V2 أدوات سيولة أحدث.
- تشمل أنواع مجمعات V2: المنتج الثابت (constant product)، وStableswap، والمنتج الثابت المُوزن (weighted constant product)، وStableswap المُوزن (weighted Stableswap).
- نوع الراوتر (Router) ونوع المجمع يحددان المنحنى (curve)، وليس نص التوكن وحده.
🧠 لماذا قد تتغير قيمة الاقتباس (الـ Quote)
غالبًا يتعرض المجمع الأصغر لضربة أكبر من نفس حجم الصفقة. تكون الرسوم افتراضيًا 0.3% لكن قد تختلف حسب المجمع. كما لا تتدفق السيولة تلقائيًا من مجمع إلى آخر لمجرد أنه يعرض نفس الرموز. كما أن الرسوم الأقل ليست بالضرورة أفضل إذا كان تأثير السعر (price impact) أسوأ.
⚡ كيف سأقارن قبل التوقيع
1. تحقّق من عقود Jetton الرسمية على TON.
2. لاحظ ما إذا كان المجمع V1 أو V2 وأي نوع مجمع يستخدم.
3. قارن بين السعر (rate) وتأثير السعر وحدّ الاستلام الأدنى والرسوم لحجم الصفقة الذي تريده.
4. إذا كنت ستُقدّم سيولة، فوازن بين TVL والحجم وAPR وأي مزرعة (farm) على حدة.
رأيي: تسمية TOKEN A / TOKEN B هي مجرد البداية. على STON.fi، جودة التنفيذ تكمن في المجمع المحدد الذي تمر عبره فعليًا.
ما التحقق من STON.fi الأكثر أهمية بالنسبة لك في صفقة كبيرة: العمق أم الرسوم؟ 👇
شارك تفاصيل المجمع التي تفتحها دائمًا قبل تأكيد الصفقة.
ليس نصيحة استثمارية—ابحث بنفسك! 🚀
$GRAM @stonfi
لماذا تُدرج STON.fi عدة مجمعات لنفس زوج الرموز
تُظهر STON.fi عدة مجمعات لنفس زوج الرموز لأن كل مجمع هو سوق بسِكربت ذكي (Smart Contract) مستقل. يمكن أن تتشارك نفس أسماء الأصول بين عقود V1 وV2 أو داخل نماذج تسعير V2 مختلفة، لذلك قد تختلف الأسعار المقتبسة والرسوم واقتصاديات مزودي السيولة (LP).
🔥 نفس الزوج، سوق مختلف
- أسماء الرموز تصف ما يمكن تداوله.
- عقد المجمع يحتفظ بالاحتياطيات ويحدد منطق AMM.
- بطاقتا A/B يمكن أن تملكا عمقًا مختلفًا ورسومًا ورموز LP.
🚀 كيف تُقسّم STON.fi تلك الأسواق
- يبقى V1 متاحًا للتوافق بينما يضيف V2 أدوات سيولة أحدث.
- تشمل أنواع مجمعات V2: المنتج الثابت (constant product)، وStableswap، والمنتج الثابت المُوزن (weighted constant product)، وStableswap المُوزن (weighted Stableswap).
- نوع الراوتر (Router) ونوع المجمع يحددان المنحنى (curve)، وليس نص التوكن وحده.
🧠 لماذا قد تتغير قيمة الاقتباس (الـ Quote)
غالبًا يتعرض المجمع الأصغر لضربة أكبر من نفس حجم الصفقة. تكون الرسوم افتراضيًا 0.3% لكن قد تختلف حسب المجمع. كما لا تتدفق السيولة تلقائيًا من مجمع إلى آخر لمجرد أنه يعرض نفس الرموز. كما أن الرسوم الأقل ليست بالضرورة أفضل إذا كان تأثير السعر (price impact) أسوأ.
⚡ كيف سأقارن قبل التوقيع
1. تحقّق من عقود Jetton الرسمية على TON.
2. لاحظ ما إذا كان المجمع V1 أو V2 وأي نوع مجمع يستخدم.
3. قارن بين السعر (rate) وتأثير السعر وحدّ الاستلام الأدنى والرسوم لحجم الصفقة الذي تريده.
4. إذا كنت ستُقدّم سيولة، فوازن بين TVL والحجم وAPR وأي مزرعة (farm) على حدة.
رأيي: تسمية TOKEN A / TOKEN B هي مجرد البداية. على STON.fi، جودة التنفيذ تكمن في المجمع المحدد الذي تمر عبره فعليًا.
ما التحقق من STON.fi الأكثر أهمية بالنسبة لك في صفقة كبيرة: العمق أم الرسوم؟ 👇
شارك تفاصيل المجمع التي تفتحها دائمًا قبل تأكيد الصفقة.
ليس نصيحة استثمارية—ابحث بنفسك! 🚀
$GRAM @STONfi DEX
تُظهر STON.fi عدة مجمعات لنفس زوج الرموز لأن كل مجمع هو سوق بسِكربت ذكي (Smart Contract) مستقل. يمكن أن تتشارك نفس أسماء الأصول بين عقود V1 وV2 أو داخل نماذج تسعير V2 مختلفة، لذلك قد تختلف الأسعار المقتبسة والرسوم واقتصاديات مزودي السيولة (LP).
🔥 نفس الزوج، سوق مختلف
- أسماء الرموز تصف ما يمكن تداوله.
- عقد المجمع يحتفظ بالاحتياطيات ويحدد منطق AMM.
- بطاقتا A/B يمكن أن تملكا عمقًا مختلفًا ورسومًا ورموز LP.
🚀 كيف تُقسّم STON.fi تلك الأسواق
- يبقى V1 متاحًا للتوافق بينما يضيف V2 أدوات سيولة أحدث.
- تشمل أنواع مجمعات V2: المنتج الثابت (constant product)، وStableswap، والمنتج الثابت المُوزن (weighted constant product)، وStableswap المُوزن (weighted Stableswap).
- نوع الراوتر (Router) ونوع المجمع يحددان المنحنى (curve)، وليس نص التوكن وحده.
🧠 لماذا قد تتغير قيمة الاقتباس (الـ Quote)
غالبًا يتعرض المجمع الأصغر لضربة أكبر من نفس حجم الصفقة. تكون الرسوم افتراضيًا 0.3% لكن قد تختلف حسب المجمع. كما لا تتدفق السيولة تلقائيًا من مجمع إلى آخر لمجرد أنه يعرض نفس الرموز. كما أن الرسوم الأقل ليست بالضرورة أفضل إذا كان تأثير السعر (price impact) أسوأ.
⚡ كيف سأقارن قبل التوقيع
1. تحقّق من عقود Jetton الرسمية على TON.
2. لاحظ ما إذا كان المجمع V1 أو V2 وأي نوع مجمع يستخدم.
3. قارن بين السعر (rate) وتأثير السعر وحدّ الاستلام الأدنى والرسوم لحجم الصفقة الذي تريده.
4. إذا كنت ستُقدّم سيولة، فوازن بين TVL والحجم وAPR وأي مزرعة (farm) على حدة.
رأيي: تسمية TOKEN A / TOKEN B هي مجرد البداية. على STON.fi، جودة التنفيذ تكمن في المجمع المحدد الذي تمر عبره فعليًا.
ما التحقق من STON.fi الأكثر أهمية بالنسبة لك في صفقة كبيرة: العمق أم الرسوم؟ 👇
شارك تفاصيل المجمع التي تفتحها دائمًا قبل تأكيد الصفقة.
ليس نصيحة استثمارية—ابحث بنفسك! 🚀
$GRAM @STONfi DEX
138
·
--
صاعد
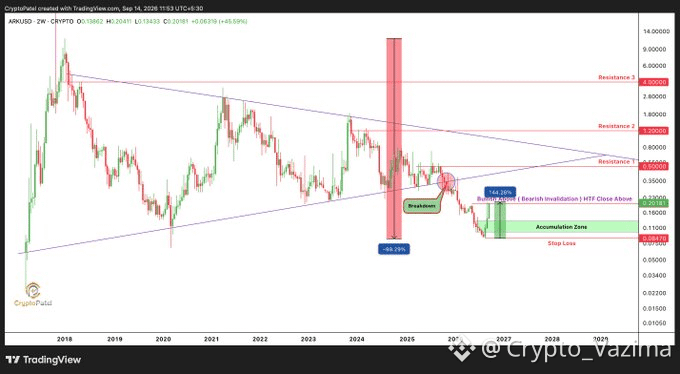
ARK تحوّلت من مخطّط ميت إلى فوضى بنسبة 146 بالمئة، والآن 0.20 هو البوابة
الانهيار بنسبة 99 بالمئة الذي حدث في 2018 جعل ARK تبدو كأنها انتهت. ثم الأسابيع الأربعة الأخيرة طَبَعت قفزة بنسبة 146 بالمئة، وفجأة الجميع يحدّق في 0.20.
🔥 لماذا أتابع
- الارتداد صاخب، لكنّه ما يزال مجرد ارتداد إلى أن يكسر 0.20 ويثبت.
- أريد إغلاقًا قويًا على إطار زمني أعلى (HTF) فوق هذا المستوى، لا ذيل (ويك) ثم تراجع.
- إذا طبع ذلك الإغلاق، ستصبح المحادثة التالية عن 0.50 ثم 1.20.
👀 الجزء الذي يهم
- كسر وثبات 0.20: يمكن أن يبدأ رالي أكبر.
- فشل الكسر: يعود نطاق 0.12-0.098 للواجهة.
- الصبر هو الميزة هنا، وليس FOMO (الخوف من فوات الفرصة).
🎯 فكرة تَجارتي
- التحيّز: انتظر
- المحفّز: إغلاق HTF فوق 0.20
- الهدف: 0.50، ثم 1.20، مع اعتبار 4 فقط كخريطة المدى الطويل
- إبطال الفكرة: فشل الكسر واستعادة الجانب السفلي
- الثقة: 63 بالمئة على الانتظار، لا على دخول طويل أعمى
🚀 تدفّق السوق
عندما يضخّ مخطّط كان منسيًّا فجأة بنسبة 146 بالمئة، تبدأ جودة التنفيذ بالاهتمام بقدر اهتمام الشمعة نفسها. ARK هي صفقة الزخم العاطفي في هذا المنشور، بينما يغطي Omniston مهمة البنية التحتية بمقارنة المسارات عبر السيولة المتاحة.
يمكنه فحص مسارات التبادل المحتملة قبل إرسال الصفقة. وهذا مفيد بجانب إعداد ARK لأن كسر مؤكد عند 0.20 قد يغيّر الأمور بسرعة وبشكل غير مرتب.
هل هذه بداية انعكاس أم مجرد استيقاظٍ كاذب آخر؟ 👇
قل لي الإغلاق بالضبط الذي سيجعلك تدخل.
ليس نصيحة استثمارية - ابحث بنفسك! 🚀
$ARK
{future}(ARKUSDT)
ARK تحوّلت من مخطّط ميت إلى فوضى بنسبة 146 بالمئة، والآن 0.20 هو البوابة
الانهيار بنسبة 99 بالمئة الذي حدث في 2018 جعل ARK تبدو كأنها انتهت. ثم الأسابيع الأربعة الأخيرة طَبَعت قفزة بنسبة 146 بالمئة، وفجأة الجميع يحدّق في 0.20.
🔥 لماذا أتابع
- الارتداد صاخب، لكنّه ما يزال مجرد ارتداد إلى أن يكسر 0.20 ويثبت.
- أريد إغلاقًا قويًا على إطار زمني أعلى (HTF) فوق هذا المستوى، لا ذيل (ويك) ثم تراجع.
- إذا طبع ذلك الإغلاق، ستصبح المحادثة التالية عن 0.50 ثم 1.20.
👀 الجزء الذي يهم
- كسر وثبات 0.20: يمكن أن يبدأ رالي أكبر.
- فشل الكسر: يعود نطاق 0.12-0.098 للواجهة.
- الصبر هو الميزة هنا، وليس FOMO (الخوف من فوات الفرصة).
🎯 فكرة تَجارتي
- التحيّز: انتظر
- المحفّز: إغلاق HTF فوق 0.20
- الهدف: 0.50، ثم 1.20، مع اعتبار 4 فقط كخريطة المدى الطويل
- إبطال الفكرة: فشل الكسر واستعادة الجانب السفلي
- الثقة: 63 بالمئة على الانتظار، لا على دخول طويل أعمى
🚀 تدفّق السوق
عندما يضخّ مخطّط كان منسيًّا فجأة بنسبة 146 بالمئة، تبدأ جودة التنفيذ بالاهتمام بقدر اهتمام الشمعة نفسها. ARK هي صفقة الزخم العاطفي في هذا المنشور، بينما يغطي Omniston مهمة البنية التحتية بمقارنة المسارات عبر السيولة المتاحة.
يمكنه فحص مسارات التبادل المحتملة قبل إرسال الصفقة. وهذا مفيد بجانب إعداد ARK لأن كسر مؤكد عند 0.20 قد يغيّر الأمور بسرعة وبشكل غير مرتب.
هل هذه بداية انعكاس أم مجرد استيقاظٍ كاذب آخر؟ 👇
قل لي الإغلاق بالضبط الذي سيجعلك تدخل.
ليس نصيحة استثمارية - ابحث بنفسك! 🚀
$ARK
الانهيار بنسبة 99 بالمئة الذي حدث في 2018 جعل ARK تبدو كأنها انتهت. ثم الأسابيع الأربعة الأخيرة طَبَعت قفزة بنسبة 146 بالمئة، وفجأة الجميع يحدّق في 0.20.
🔥 لماذا أتابع
- الارتداد صاخب، لكنّه ما يزال مجرد ارتداد إلى أن يكسر 0.20 ويثبت.
- أريد إغلاقًا قويًا على إطار زمني أعلى (HTF) فوق هذا المستوى، لا ذيل (ويك) ثم تراجع.
- إذا طبع ذلك الإغلاق، ستصبح المحادثة التالية عن 0.50 ثم 1.20.
👀 الجزء الذي يهم
- كسر وثبات 0.20: يمكن أن يبدأ رالي أكبر.
- فشل الكسر: يعود نطاق 0.12-0.098 للواجهة.
- الصبر هو الميزة هنا، وليس FOMO (الخوف من فوات الفرصة).
🎯 فكرة تَجارتي
- التحيّز: انتظر
- المحفّز: إغلاق HTF فوق 0.20
- الهدف: 0.50، ثم 1.20، مع اعتبار 4 فقط كخريطة المدى الطويل
- إبطال الفكرة: فشل الكسر واستعادة الجانب السفلي
- الثقة: 63 بالمئة على الانتظار، لا على دخول طويل أعمى
🚀 تدفّق السوق
عندما يضخّ مخطّط كان منسيًّا فجأة بنسبة 146 بالمئة، تبدأ جودة التنفيذ بالاهتمام بقدر اهتمام الشمعة نفسها. ARK هي صفقة الزخم العاطفي في هذا المنشور، بينما يغطي Omniston مهمة البنية التحتية بمقارنة المسارات عبر السيولة المتاحة.
يمكنه فحص مسارات التبادل المحتملة قبل إرسال الصفقة. وهذا مفيد بجانب إعداد ARK لأن كسر مؤكد عند 0.20 قد يغيّر الأمور بسرعة وبشكل غير مرتب.
هل هذه بداية انعكاس أم مجرد استيقاظٍ كاذب آخر؟ 👇
قل لي الإغلاق بالضبط الذي سيجعلك تدخل.
ليس نصيحة استثمارية - ابحث بنفسك! 🚀
$ARK
88
·
--
هابط
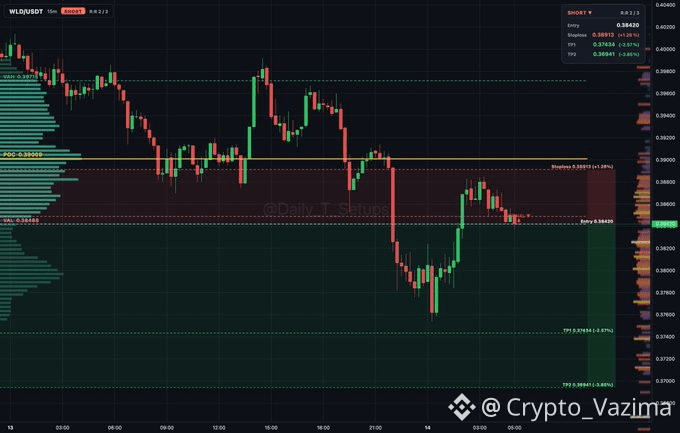
يبدو ارتداد WLD قويّاً وأنا لا أشتري هذا الارتياح ⚠️
هذا الارتداد على WLD تحت VAL يشبه التوزيع، وليس انعكاساً نظيفاً. أريد من البائعين الحفاظ على السيطرة تحت 0.38488.
🔥 لماذا أراقب
- دوران المزاد يُظهر وجود عرض تحت VAL.
- الدخول عند 0.3842، أسفل هذا الخط مباشرةً.
- فشل الثبات هنا يبقي مسار الهبوط مفتوحاً.
🚀 الجزء الذي يهم
- وقف الخسارة قريب عند 0.38913.
- الهدف الأول لجني الربح هو 0.37434.
- الهدف الثاني لجني الربح هو 0.36941.
🎯 فكرة التداول الخاصة بي
- التحيّز: بيع (Short)
- المحفّز: الرفض يبقى تحت VAL عند 0.38488
- الهدف: 0.37434 ثم 0.36941
- إبطال الفكرة: إعادة الاستحواذ فوق 0.38913
- الثقة: 64 بالمئة
🧠 سياق أوسع على المدى الأطول
التراجع القصير لـ WLD قد يتحرك بسرعة، لكن مشاركة البروتوكول تتبع ساعة أبطأ. WLD هو الارتداد القصير الفوري هنا، بينما ST0N هو جانب التكديس والمشاركة في البروتوكول ضمن نفس السوق الأوسع.
ويرتبط ذلك بالاحتفاظ وبوجود مشاركة مرتبطة بالـ DAO، وليس بدورة مزاد مدتها 15 دقيقة. الزاوية الثانية مهمة بجانب هذا الإعداد لأن الرسم البياني قد يظل قصيراً ما دام الالتزام يبقى قراراً منفصلاً.
هل ستستمر في تراجع هذا الارتداد أم تعتبره انتهى؟ 👇
قل لي أين ستُنهي صفقة WLD القصيرة.
ليس نصيحة استثمارية—ابحث بنفسك! 🚀
$WLD
{future}(WLDUSDT)
يبدو ارتداد WLD قويّاً وأنا لا أشتري هذا الارتياح ⚠️
هذا الارتداد على WLD تحت VAL يشبه التوزيع، وليس انعكاساً نظيفاً. أريد من البائعين الحفاظ على السيطرة تحت 0.38488.
🔥 لماذا أراقب
- دوران المزاد يُظهر وجود عرض تحت VAL.
- الدخول عند 0.3842، أسفل هذا الخط مباشرةً.
- فشل الثبات هنا يبقي مسار الهبوط مفتوحاً.
🚀 الجزء الذي يهم
- وقف الخسارة قريب عند 0.38913.
- الهدف الأول لجني الربح هو 0.37434.
- الهدف الثاني لجني الربح هو 0.36941.
🎯 فكرة التداول الخاصة بي
- التحيّز: بيع (Short)
- المحفّز: الرفض يبقى تحت VAL عند 0.38488
- الهدف: 0.37434 ثم 0.36941
- إبطال الفكرة: إعادة الاستحواذ فوق 0.38913
- الثقة: 64 بالمئة
🧠 سياق أوسع على المدى الأطول
التراجع القصير لـ WLD قد يتحرك بسرعة، لكن مشاركة البروتوكول تتبع ساعة أبطأ. WLD هو الارتداد القصير الفوري هنا، بينما ST0N هو جانب التكديس والمشاركة في البروتوكول ضمن نفس السوق الأوسع.
ويرتبط ذلك بالاحتفاظ وبوجود مشاركة مرتبطة بالـ DAO، وليس بدورة مزاد مدتها 15 دقيقة. الزاوية الثانية مهمة بجانب هذا الإعداد لأن الرسم البياني قد يظل قصيراً ما دام الالتزام يبقى قراراً منفصلاً.
هل ستستمر في تراجع هذا الارتداد أم تعتبره انتهى؟ 👇
قل لي أين ستُنهي صفقة WLD القصيرة.
ليس نصيحة استثمارية—ابحث بنفسك! 🚀
$WLD
هذا الارتداد على WLD تحت VAL يشبه التوزيع، وليس انعكاساً نظيفاً. أريد من البائعين الحفاظ على السيطرة تحت 0.38488.
🔥 لماذا أراقب
- دوران المزاد يُظهر وجود عرض تحت VAL.
- الدخول عند 0.3842، أسفل هذا الخط مباشرةً.
- فشل الثبات هنا يبقي مسار الهبوط مفتوحاً.
🚀 الجزء الذي يهم
- وقف الخسارة قريب عند 0.38913.
- الهدف الأول لجني الربح هو 0.37434.
- الهدف الثاني لجني الربح هو 0.36941.
🎯 فكرة التداول الخاصة بي
- التحيّز: بيع (Short)
- المحفّز: الرفض يبقى تحت VAL عند 0.38488
- الهدف: 0.37434 ثم 0.36941
- إبطال الفكرة: إعادة الاستحواذ فوق 0.38913
- الثقة: 64 بالمئة
🧠 سياق أوسع على المدى الأطول
التراجع القصير لـ WLD قد يتحرك بسرعة، لكن مشاركة البروتوكول تتبع ساعة أبطأ. WLD هو الارتداد القصير الفوري هنا، بينما ST0N هو جانب التكديس والمشاركة في البروتوكول ضمن نفس السوق الأوسع.
ويرتبط ذلك بالاحتفاظ وبوجود مشاركة مرتبطة بالـ DAO، وليس بدورة مزاد مدتها 15 دقيقة. الزاوية الثانية مهمة بجانب هذا الإعداد لأن الرسم البياني قد يظل قصيراً ما دام الالتزام يبقى قراراً منفصلاً.
هل ستستمر في تراجع هذا الارتداد أم تعتبره انتهى؟ 👇
قل لي أين ستُنهي صفقة WLD القصيرة.
ليس نصيحة استثمارية—ابحث بنفسك! 🚀
$WLD
69
·
--
هابط
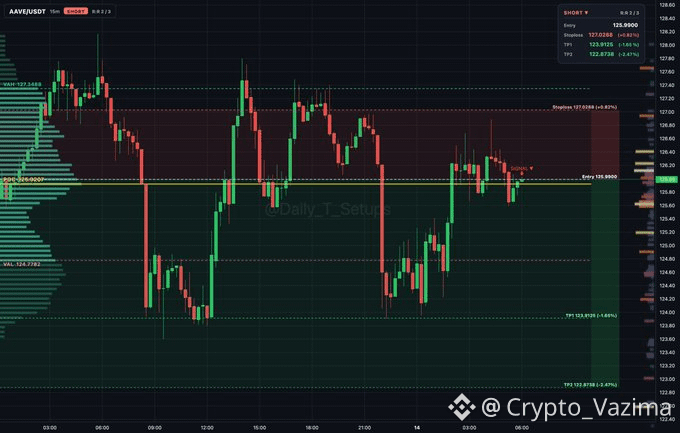
يبدو ارتداد AAVE مزيفًا إذا استمرّ البائعون في التوزيع 🔥
هذا مخطط AAVE يزعج بطريقة جيدة جدًا. يستمر بالدوران داخل المنطقة القيمة، ولن أشتري قصة الارتداد حتى يفقد البائعون تلك المنطقة.
🔥 لماذا أراقب
- دوران المزاد يُظهر التوزيع بين POC 125.921 و VAH 127.349
- الزناد القصير موجود تقريبًا حول 126.030
- القيمة العليا ما زالت تبدو مكانًا تُباع فيه العطاءات
👀 الجزء المهم
- TP1 هو 124.032
- TP2 هو 123.034
- إذا وصل TP1، نصف الصفقة وخذ إيقاف الخسارة إلى الدخول
- إعادة الاستحواذ عبر 127.029 تُسقط الفكرة
🎯 فكرة التداول الخاصة بي
- التحيّز: بيع (Short)
- الزناد: رفض تحت VAH مع ثبات السعر قرب 126.030
- الهدف: 124.032 ثم 123.034
- إبطال الفكرة: 127.029
- الثقة: 64 بالمئة
🚀 تدفق السوق
تهيئة سريعة مثل هذا الـ AAVE Short تتعلق بالقبض على التوزيع قبل أن يتحول إلى هبوط أعمق. AAVE هنا هو سيناريو التداول المضاربي في هذا المنشور، بينما ARKENSTON هو جزء الحوكمة الأبطأ المبني على قوة التصويت القابلة للارتباط (soulbound).
هذا الرمز غير قابل للتحويل ويتماشى مع الإيداع والمشاركة في الـ DAO. مراقبة طبقة المشاركة بجانب AAVE منطقية لأن أحد المسارات هو تلاشي 15 دقيقة، والآخر هو مواءمة بروتوكول أطول.
هل هذا برنامج بيع حقيقي أم مجرد فخ نطاق آخر؟ 👇
قل لي أين ستضع الإبطال (invalidtion).
ليس نصيحة استثمارية - ابحث بنفسك! 🚀
$AAVE
{future}(AAVEUSDT)
يبدو ارتداد AAVE مزيفًا إذا استمرّ البائعون في التوزيع 🔥
هذا مخطط AAVE يزعج بطريقة جيدة جدًا. يستمر بالدوران داخل المنطقة القيمة، ولن أشتري قصة الارتداد حتى يفقد البائعون تلك المنطقة.
🔥 لماذا أراقب
- دوران المزاد يُظهر التوزيع بين POC 125.921 و VAH 127.349
- الزناد القصير موجود تقريبًا حول 126.030
- القيمة العليا ما زالت تبدو مكانًا تُباع فيه العطاءات
👀 الجزء المهم
- TP1 هو 124.032
- TP2 هو 123.034
- إذا وصل TP1، نصف الصفقة وخذ إيقاف الخسارة إلى الدخول
- إعادة الاستحواذ عبر 127.029 تُسقط الفكرة
🎯 فكرة التداول الخاصة بي
- التحيّز: بيع (Short)
- الزناد: رفض تحت VAH مع ثبات السعر قرب 126.030
- الهدف: 124.032 ثم 123.034
- إبطال الفكرة: 127.029
- الثقة: 64 بالمئة
🚀 تدفق السوق
تهيئة سريعة مثل هذا الـ AAVE Short تتعلق بالقبض على التوزيع قبل أن يتحول إلى هبوط أعمق. AAVE هنا هو سيناريو التداول المضاربي في هذا المنشور، بينما ARKENSTON هو جزء الحوكمة الأبطأ المبني على قوة التصويت القابلة للارتباط (soulbound).
هذا الرمز غير قابل للتحويل ويتماشى مع الإيداع والمشاركة في الـ DAO. مراقبة طبقة المشاركة بجانب AAVE منطقية لأن أحد المسارات هو تلاشي 15 دقيقة، والآخر هو مواءمة بروتوكول أطول.
هل هذا برنامج بيع حقيقي أم مجرد فخ نطاق آخر؟ 👇
قل لي أين ستضع الإبطال (invalidtion).
ليس نصيحة استثمارية - ابحث بنفسك! 🚀
$AAVE
هذا مخطط AAVE يزعج بطريقة جيدة جدًا. يستمر بالدوران داخل المنطقة القيمة، ولن أشتري قصة الارتداد حتى يفقد البائعون تلك المنطقة.
🔥 لماذا أراقب
- دوران المزاد يُظهر التوزيع بين POC 125.921 و VAH 127.349
- الزناد القصير موجود تقريبًا حول 126.030
- القيمة العليا ما زالت تبدو مكانًا تُباع فيه العطاءات
👀 الجزء المهم
- TP1 هو 124.032
- TP2 هو 123.034
- إذا وصل TP1، نصف الصفقة وخذ إيقاف الخسارة إلى الدخول
- إعادة الاستحواذ عبر 127.029 تُسقط الفكرة
🎯 فكرة التداول الخاصة بي
- التحيّز: بيع (Short)
- الزناد: رفض تحت VAH مع ثبات السعر قرب 126.030
- الهدف: 124.032 ثم 123.034
- إبطال الفكرة: 127.029
- الثقة: 64 بالمئة
🚀 تدفق السوق
تهيئة سريعة مثل هذا الـ AAVE Short تتعلق بالقبض على التوزيع قبل أن يتحول إلى هبوط أعمق. AAVE هنا هو سيناريو التداول المضاربي في هذا المنشور، بينما ARKENSTON هو جزء الحوكمة الأبطأ المبني على قوة التصويت القابلة للارتباط (soulbound).
هذا الرمز غير قابل للتحويل ويتماشى مع الإيداع والمشاركة في الـ DAO. مراقبة طبقة المشاركة بجانب AAVE منطقية لأن أحد المسارات هو تلاشي 15 دقيقة، والآخر هو مواءمة بروتوكول أطول.
هل هذا برنامج بيع حقيقي أم مجرد فخ نطاق آخر؟ 👇
قل لي أين ستضع الإبطال (invalidtion).
ليس نصيحة استثمارية - ابحث بنفسك! 🚀
$AAVE
12
·
--
هابط
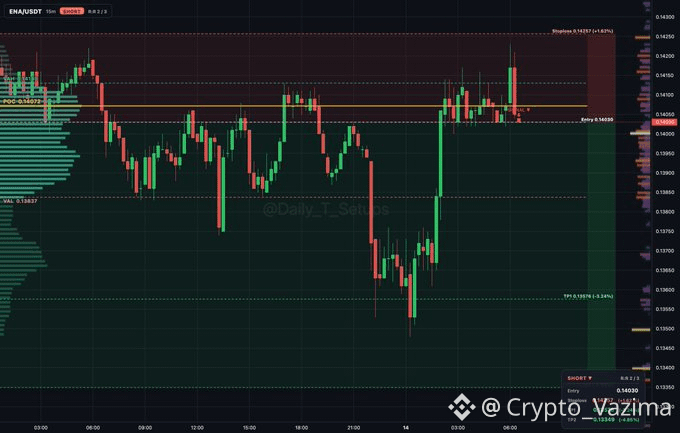
يبدو أن ENA ثقيل بعد هذه الدورة من المزاد 📉
لا يبدو شراءً نظيفًا بالنسبة لي. يبدو كتوزيع داخل القيمة.
🔥 لماذا أراقب
- البائعون يدورون داخل VAL 0.13837 و VAH 0.1413.
- قراءة المزاد هي توزيع، وليست احتفالًا باختراق.
- لهذا يظهر الشورت على شاشتي الآن.
🎯 فكرة تداولي
- التحيّز: شورت
- المحفّز: الثبات فوق/عند منطقة 0.1404 بعد التوزيع
- الهدف: 0.13606 ثم 0.1339
- الإلغاء/التحقق: 0.14257
- الثقة: 64 بالمئة
👀 الجزء الذي يهم
- نصف الصفقة عند الهدف الأول.
- ثم يتحرّك الستوب إلى الدخول.
- لا استرداد فوق خط المخاطرة.
🚀 تدفق السوق
قد يبدو تلاشي ENA السريع قويًا على الرسم البياني، لكن المشاركة الأطول في البروتوكول لعبة مختلفة. ENA هنا هو صفقة توزيع قصيرة الأجل، بينما ST0N_fi تتعلق بالـ staking وزاوية المشاركة في الـ DAO.
وظيفته هي المشاركة في البروتوكول بدلًا من التقاط الرفض التالي داخل القيمة. هذا التباين مفيد بجانب هذا الشورت لأن فكرة واحدة تكتيكية، والأخرى تتعلق بالاستمرار في المشاركة داخل البروتوكول الأوسع.
هل ستأخذ الشورت من داخل القيمة أم تنتظر فشل VAL؟ 👇
قل لي شمعة التأكيد التي تريد رؤيتها.
ليست نصيحة استثمارية — ابحث بنفسك! 🚀
$ENA
{future}(ENAUSDT)
يبدو أن ENA ثقيل بعد هذه الدورة من المزاد 📉
لا يبدو شراءً نظيفًا بالنسبة لي. يبدو كتوزيع داخل القيمة.
🔥 لماذا أراقب
- البائعون يدورون داخل VAL 0.13837 و VAH 0.1413.
- قراءة المزاد هي توزيع، وليست احتفالًا باختراق.
- لهذا يظهر الشورت على شاشتي الآن.
🎯 فكرة تداولي
- التحيّز: شورت
- المحفّز: الثبات فوق/عند منطقة 0.1404 بعد التوزيع
- الهدف: 0.13606 ثم 0.1339
- الإلغاء/التحقق: 0.14257
- الثقة: 64 بالمئة
👀 الجزء الذي يهم
- نصف الصفقة عند الهدف الأول.
- ثم يتحرّك الستوب إلى الدخول.
- لا استرداد فوق خط المخاطرة.
🚀 تدفق السوق
قد يبدو تلاشي ENA السريع قويًا على الرسم البياني، لكن المشاركة الأطول في البروتوكول لعبة مختلفة. ENA هنا هو صفقة توزيع قصيرة الأجل، بينما ST0N_fi تتعلق بالـ staking وزاوية المشاركة في الـ DAO.
وظيفته هي المشاركة في البروتوكول بدلًا من التقاط الرفض التالي داخل القيمة. هذا التباين مفيد بجانب هذا الشورت لأن فكرة واحدة تكتيكية، والأخرى تتعلق بالاستمرار في المشاركة داخل البروتوكول الأوسع.
هل ستأخذ الشورت من داخل القيمة أم تنتظر فشل VAL؟ 👇
قل لي شمعة التأكيد التي تريد رؤيتها.
ليست نصيحة استثمارية — ابحث بنفسك! 🚀
$ENA
لا يبدو شراءً نظيفًا بالنسبة لي. يبدو كتوزيع داخل القيمة.
🔥 لماذا أراقب
- البائعون يدورون داخل VAL 0.13837 و VAH 0.1413.
- قراءة المزاد هي توزيع، وليست احتفالًا باختراق.
- لهذا يظهر الشورت على شاشتي الآن.
🎯 فكرة تداولي
- التحيّز: شورت
- المحفّز: الثبات فوق/عند منطقة 0.1404 بعد التوزيع
- الهدف: 0.13606 ثم 0.1339
- الإلغاء/التحقق: 0.14257
- الثقة: 64 بالمئة
👀 الجزء الذي يهم
- نصف الصفقة عند الهدف الأول.
- ثم يتحرّك الستوب إلى الدخول.
- لا استرداد فوق خط المخاطرة.
🚀 تدفق السوق
قد يبدو تلاشي ENA السريع قويًا على الرسم البياني، لكن المشاركة الأطول في البروتوكول لعبة مختلفة. ENA هنا هو صفقة توزيع قصيرة الأجل، بينما ST0N_fi تتعلق بالـ staking وزاوية المشاركة في الـ DAO.
وظيفته هي المشاركة في البروتوكول بدلًا من التقاط الرفض التالي داخل القيمة. هذا التباين مفيد بجانب هذا الشورت لأن فكرة واحدة تكتيكية، والأخرى تتعلق بالاستمرار في المشاركة داخل البروتوكول الأوسع.
هل ستأخذ الشورت من داخل القيمة أم تنتظر فشل VAL؟ 👇
قل لي شمعة التأكيد التي تريد رؤيتها.
ليست نصيحة استثمارية — ابحث بنفسك! 🚀
$ENA
39
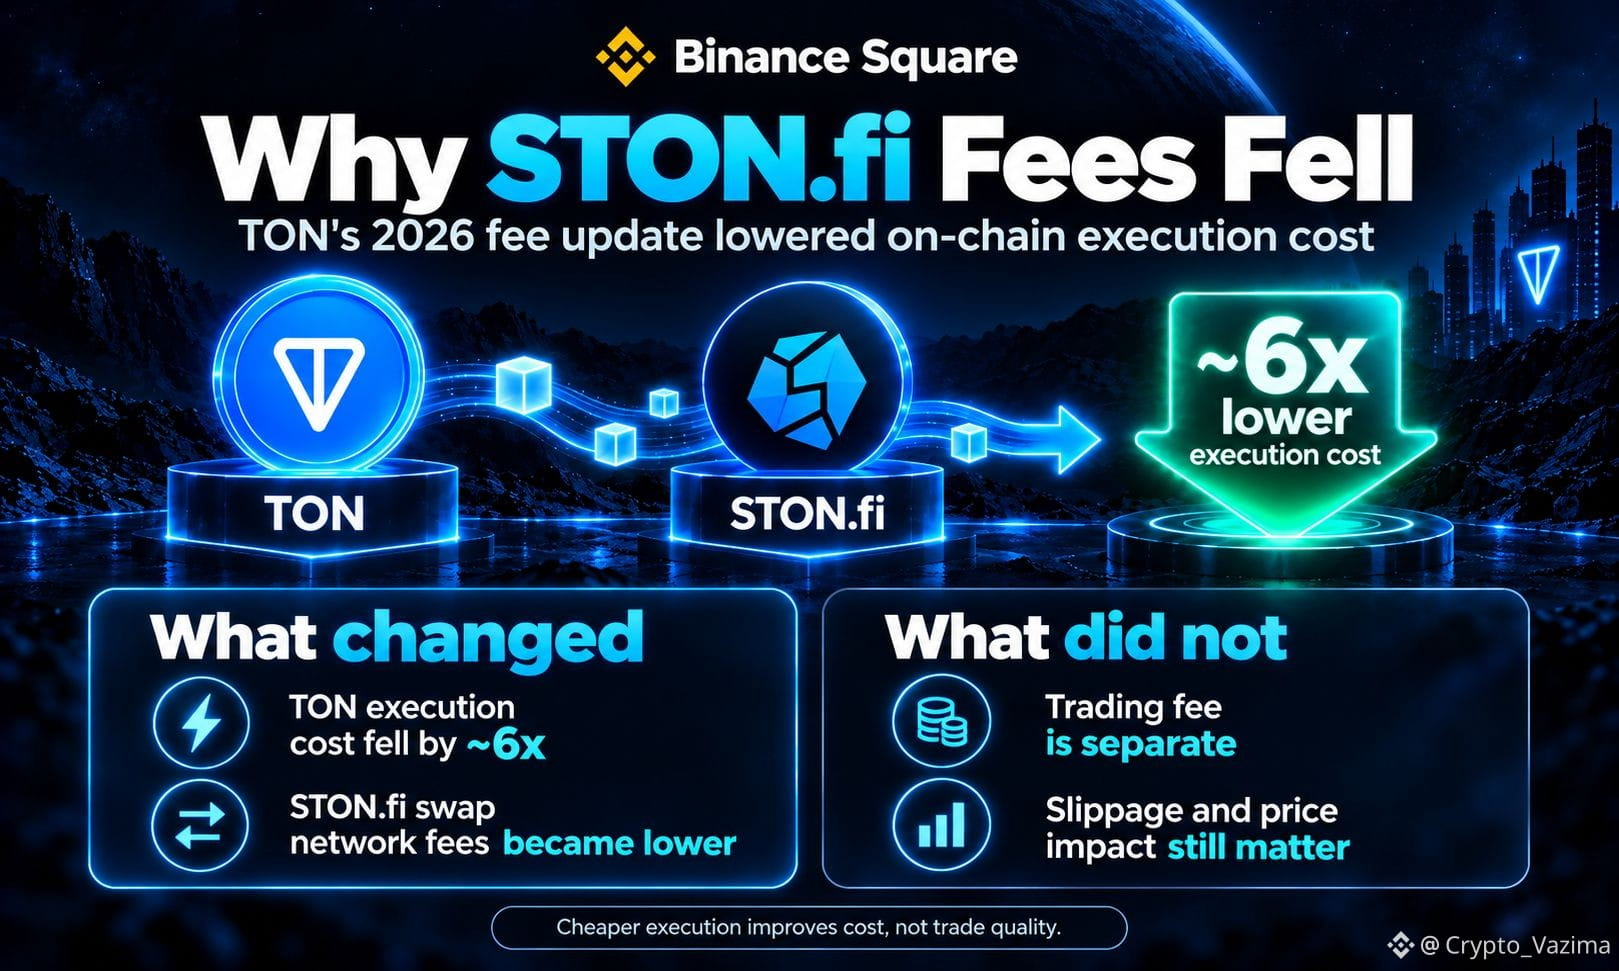
لماذا انخفضت رسوم شبكة STON.fi بعد خفض TON لعام 2026 بمقدار ستة أضعاف
انخفضت رسوم شبكة STON.fi لأن TON خفّض تكاليف تنفيذ المعاملات على السلسلة بنحو 6x في عام 2026. لم تُجرِ STON.fi خصمًا ترويجيًا. الرسائل واستدعاءات العقود التي تُكوّن عملية التبادل ببساطة أصبحت أرخص على TON.
🔥 ما الذي تغيّر في TON في ربيع 2026
- ترقية الأداء مثل Sub-Second وCatchain 2.0 جعلت التنفيذ الأقل تكلفة عمليًا.
- استهدفت TON Core خفضًا بستة أضعاف، وصوّت المدققون على أسعار غاز أقل.
- أكد بافيل دوروف أن الرسوم انخفضت بنحو ستة أضعاف بحلول أوائل مايو.
🚀 لماذا أصبح تبديل STON.fi أرخص
التبادل عبارة عن تدفق متعدد الرسائل، وليس مجرد إرسال عملة واحدة.
1. يبدأ المحفظة العملية.
2. تعالج محافظ الرموز وراوتر STON.fi الطلب.
3. تحسب المجموعة التداول وتنفذه.
4. يمكن أن يعود ناتج التداول والـ TON المتبقي إلى المستخدم.
⚡ نوعان مختلفان من الرسوم
- رسوم الشبكة تغطي حساب TON وإعادة التوجيه. وقد انخفضت.
- رسوم تداول STON.fi تبقى مبنية على المسبح، افتراضيًا 0.3%، ولم تُخفَّض تلقائيًا.
- لم ينخفض تأثير السعر والانزلاق لمجرد أن الغاز أصبح أرخص.
💬 مثال واقعي يمكن للمستخدمين التحقق منه
نشرت STON.fi مقارنة بين TON وUSDt: انخفضت تكلفة الشبكة من حوالي 0.0292 TON إلى حوالي 0.00487 TON. وهذا قريب من خفض 6x على مستوى الشبكة، لكنه يظل أعلى من تحويل TON الأساسي لأن التبادل يتطلب عملًا أكثر. يساعد انخفاض سعر TON في الصفقات الصغيرة، والنشاط المتكرر على DeFi، ومراعاة التحكيم بشكل أدق.
هل سيؤثر انخفاض طبقة الشبكة على مدى تكرارك للتبادل على STON.fi؟ 👇
أرسل آخر رسوم شبكة لاحظتها في صفقة على STON.fi.
ليس نصيحة استثمارية — ابحث بنفسك! 🚀
$GRAM @stonfi
لماذا انخفضت رسوم شبكة STON.fi بعد خفض TON لعام 2026 بمقدار ستة أضعاف
انخفضت رسوم شبكة STON.fi لأن TON خفّض تكاليف تنفيذ المعاملات على السلسلة بنحو 6x في عام 2026. لم تُجرِ STON.fi خصمًا ترويجيًا. الرسائل واستدعاءات العقود التي تُكوّن عملية التبادل ببساطة أصبحت أرخص على TON.
🔥 ما الذي تغيّر في TON في ربيع 2026
- ترقية الأداء مثل Sub-Second وCatchain 2.0 جعلت التنفيذ الأقل تكلفة عمليًا.
- استهدفت TON Core خفضًا بستة أضعاف، وصوّت المدققون على أسعار غاز أقل.
- أكد بافيل دوروف أن الرسوم انخفضت بنحو ستة أضعاف بحلول أوائل مايو.
🚀 لماذا أصبح تبديل STON.fi أرخص
التبادل عبارة عن تدفق متعدد الرسائل، وليس مجرد إرسال عملة واحدة.
1. يبدأ المحفظة العملية.
2. تعالج محافظ الرموز وراوتر STON.fi الطلب.
3. تحسب المجموعة التداول وتنفذه.
4. يمكن أن يعود ناتج التداول والـ TON المتبقي إلى المستخدم.
⚡ نوعان مختلفان من الرسوم
- رسوم الشبكة تغطي حساب TON وإعادة التوجيه. وقد انخفضت.
- رسوم تداول STON.fi تبقى مبنية على المسبح، افتراضيًا 0.3%، ولم تُخفَّض تلقائيًا.
- لم ينخفض تأثير السعر والانزلاق لمجرد أن الغاز أصبح أرخص.
💬 مثال واقعي يمكن للمستخدمين التحقق منه
نشرت STON.fi مقارنة بين TON وUSDt: انخفضت تكلفة الشبكة من حوالي 0.0292 TON إلى حوالي 0.00487 TON. وهذا قريب من خفض 6x على مستوى الشبكة، لكنه يظل أعلى من تحويل TON الأساسي لأن التبادل يتطلب عملًا أكثر. يساعد انخفاض سعر TON في الصفقات الصغيرة، والنشاط المتكرر على DeFi، ومراعاة التحكيم بشكل أدق.
هل سيؤثر انخفاض طبقة الشبكة على مدى تكرارك للتبادل على STON.fi؟ 👇
أرسل آخر رسوم شبكة لاحظتها في صفقة على STON.fi.
ليس نصيحة استثمارية — ابحث بنفسك! 🚀
$GRAM @STONfi DEX
انخفضت رسوم شبكة STON.fi لأن TON خفّض تكاليف تنفيذ المعاملات على السلسلة بنحو 6x في عام 2026. لم تُجرِ STON.fi خصمًا ترويجيًا. الرسائل واستدعاءات العقود التي تُكوّن عملية التبادل ببساطة أصبحت أرخص على TON.
🔥 ما الذي تغيّر في TON في ربيع 2026
- ترقية الأداء مثل Sub-Second وCatchain 2.0 جعلت التنفيذ الأقل تكلفة عمليًا.
- استهدفت TON Core خفضًا بستة أضعاف، وصوّت المدققون على أسعار غاز أقل.
- أكد بافيل دوروف أن الرسوم انخفضت بنحو ستة أضعاف بحلول أوائل مايو.
🚀 لماذا أصبح تبديل STON.fi أرخص
التبادل عبارة عن تدفق متعدد الرسائل، وليس مجرد إرسال عملة واحدة.
1. يبدأ المحفظة العملية.
2. تعالج محافظ الرموز وراوتر STON.fi الطلب.
3. تحسب المجموعة التداول وتنفذه.
4. يمكن أن يعود ناتج التداول والـ TON المتبقي إلى المستخدم.
⚡ نوعان مختلفان من الرسوم
- رسوم الشبكة تغطي حساب TON وإعادة التوجيه. وقد انخفضت.
- رسوم تداول STON.fi تبقى مبنية على المسبح، افتراضيًا 0.3%، ولم تُخفَّض تلقائيًا.
- لم ينخفض تأثير السعر والانزلاق لمجرد أن الغاز أصبح أرخص.
💬 مثال واقعي يمكن للمستخدمين التحقق منه
نشرت STON.fi مقارنة بين TON وUSDt: انخفضت تكلفة الشبكة من حوالي 0.0292 TON إلى حوالي 0.00487 TON. وهذا قريب من خفض 6x على مستوى الشبكة، لكنه يظل أعلى من تحويل TON الأساسي لأن التبادل يتطلب عملًا أكثر. يساعد انخفاض سعر TON في الصفقات الصغيرة، والنشاط المتكرر على DeFi، ومراعاة التحكيم بشكل أدق.
هل سيؤثر انخفاض طبقة الشبكة على مدى تكرارك للتبادل على STON.fi؟ 👇
أرسل آخر رسوم شبكة لاحظتها في صفقة على STON.fi.
ليس نصيحة استثمارية — ابحث بنفسك! 🚀
$GRAM @STONfi DEX
103
·
--
هابط
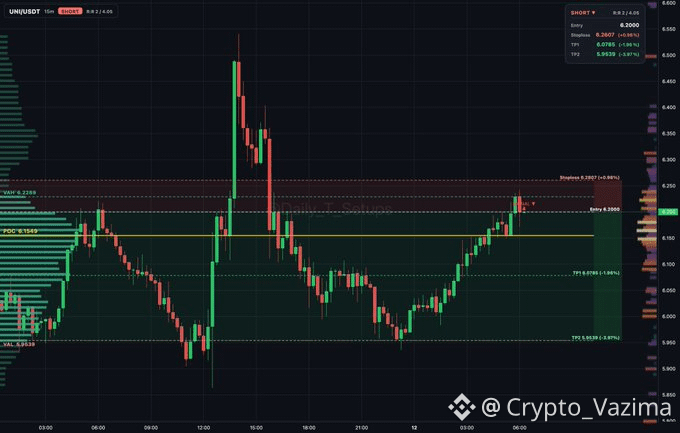
يبدو أن UNI ثقيل بعد هذا التلاشي في المزاد
هذا الارتداد في UNI بدأ يشعر وكأنه توزيع، وليس اختراقًا جديدًا. البائعون يعملون داخل منطقة القيمة وأنا لا أشتري القوة بشكل أعمى.
🔥 لماذا أراقب
- يتم تدوير المزاد بين 5.954 و 6.229
- السعر موسوم قرب 6.20 وطبع إشارة قصيرة
- الحد الأعلى للقيمة ما يزال منطقة الخطر للصفقات الطويلة المتأخرة
🚀 الجزء الذي يهم
- منطقة الدخول: 6.198
- وقف الخسارة: 6.259
- الهدف الأول: 6.077
- الهدف الثاني: 5.954
🎯 فكرة تداولي
- التحيّز: بيع (Short)
- الزناد: رفض حول 6.198
- الهدف: 6.077 ثم 5.954
- إبطال الفكرة: إغلاق أو تثبيت فوق 6.259
- الثقة: 63 بالمئة
🛡 أين أتراجع
1. انتظر التلاشي قرب 6.198.
2. حافظ على المخاطر محكمة عند 6.259.
3. قم بتحصيل نصف الصفقة عند 6.077.
4. حرّك وقف الخسارة إلى مستوى الدخول بعد TP1.
💧 منظور التنفيذ
قد يصبح تلاشي UNI سريعًا فوضويًا إذا استمر الارتداد في التمدد داخل نطاق القيمة. UNI هي صفقة السعر على المدى القصير في هذا السيناريو، بينما ST0N_fi يجلس على جانب المشاركة في السوق بدلًا من مخطط توزيع 15m.
إنه مرتبط بالـ staking ومسارات المشاركة في البروتوكول أكثر من كونه محفز بيع سريع. لهذا أبقي خطة صفقة UNI منفصلة عن زاوية المشاركة الأطول.
هل يبدو لك أن ارتداد UNI هذا ما يزال ضعيفًا؟ 👇
أرسل شمعة/الـ candle التي تجعلك تتخطى صفقة البيع.
ليس نصيحة استثمارية - ابحث بنفسك! 🚀
$UNI
{future}(UNIUSDT)
يبدو أن UNI ثقيل بعد هذا التلاشي في المزاد
هذا الارتداد في UNI بدأ يشعر وكأنه توزيع، وليس اختراقًا جديدًا. البائعون يعملون داخل منطقة القيمة وأنا لا أشتري القوة بشكل أعمى.
🔥 لماذا أراقب
- يتم تدوير المزاد بين 5.954 و 6.229
- السعر موسوم قرب 6.20 وطبع إشارة قصيرة
- الحد الأعلى للقيمة ما يزال منطقة الخطر للصفقات الطويلة المتأخرة
🚀 الجزء الذي يهم
- منطقة الدخول: 6.198
- وقف الخسارة: 6.259
- الهدف الأول: 6.077
- الهدف الثاني: 5.954
🎯 فكرة تداولي
- التحيّز: بيع (Short)
- الزناد: رفض حول 6.198
- الهدف: 6.077 ثم 5.954
- إبطال الفكرة: إغلاق أو تثبيت فوق 6.259
- الثقة: 63 بالمئة
🛡 أين أتراجع
1. انتظر التلاشي قرب 6.198.
2. حافظ على المخاطر محكمة عند 6.259.
3. قم بتحصيل نصف الصفقة عند 6.077.
4. حرّك وقف الخسارة إلى مستوى الدخول بعد TP1.
💧 منظور التنفيذ
قد يصبح تلاشي UNI سريعًا فوضويًا إذا استمر الارتداد في التمدد داخل نطاق القيمة. UNI هي صفقة السعر على المدى القصير في هذا السيناريو، بينما ST0N_fi يجلس على جانب المشاركة في السوق بدلًا من مخطط توزيع 15m.
إنه مرتبط بالـ staking ومسارات المشاركة في البروتوكول أكثر من كونه محفز بيع سريع. لهذا أبقي خطة صفقة UNI منفصلة عن زاوية المشاركة الأطول.
هل يبدو لك أن ارتداد UNI هذا ما يزال ضعيفًا؟ 👇
أرسل شمعة/الـ candle التي تجعلك تتخطى صفقة البيع.
ليس نصيحة استثمارية - ابحث بنفسك! 🚀
$UNI
هذا الارتداد في UNI بدأ يشعر وكأنه توزيع، وليس اختراقًا جديدًا. البائعون يعملون داخل منطقة القيمة وأنا لا أشتري القوة بشكل أعمى.
🔥 لماذا أراقب
- يتم تدوير المزاد بين 5.954 و 6.229
- السعر موسوم قرب 6.20 وطبع إشارة قصيرة
- الحد الأعلى للقيمة ما يزال منطقة الخطر للصفقات الطويلة المتأخرة
🚀 الجزء الذي يهم
- منطقة الدخول: 6.198
- وقف الخسارة: 6.259
- الهدف الأول: 6.077
- الهدف الثاني: 5.954
🎯 فكرة تداولي
- التحيّز: بيع (Short)
- الزناد: رفض حول 6.198
- الهدف: 6.077 ثم 5.954
- إبطال الفكرة: إغلاق أو تثبيت فوق 6.259
- الثقة: 63 بالمئة
🛡 أين أتراجع
1. انتظر التلاشي قرب 6.198.
2. حافظ على المخاطر محكمة عند 6.259.
3. قم بتحصيل نصف الصفقة عند 6.077.
4. حرّك وقف الخسارة إلى مستوى الدخول بعد TP1.
💧 منظور التنفيذ
قد يصبح تلاشي UNI سريعًا فوضويًا إذا استمر الارتداد في التمدد داخل نطاق القيمة. UNI هي صفقة السعر على المدى القصير في هذا السيناريو، بينما ST0N_fi يجلس على جانب المشاركة في السوق بدلًا من مخطط توزيع 15m.
إنه مرتبط بالـ staking ومسارات المشاركة في البروتوكول أكثر من كونه محفز بيع سريع. لهذا أبقي خطة صفقة UNI منفصلة عن زاوية المشاركة الأطول.
هل يبدو لك أن ارتداد UNI هذا ما يزال ضعيفًا؟ 👇
أرسل شمعة/الـ candle التي تجعلك تتخطى صفقة البيع.
ليس نصيحة استثمارية - ابحث بنفسك! 🚀
$UNI
22
·
--
صاعد
يمكن أن يعود سعر ATOM بسرعة إذا استمر هذا الطلب 🔥
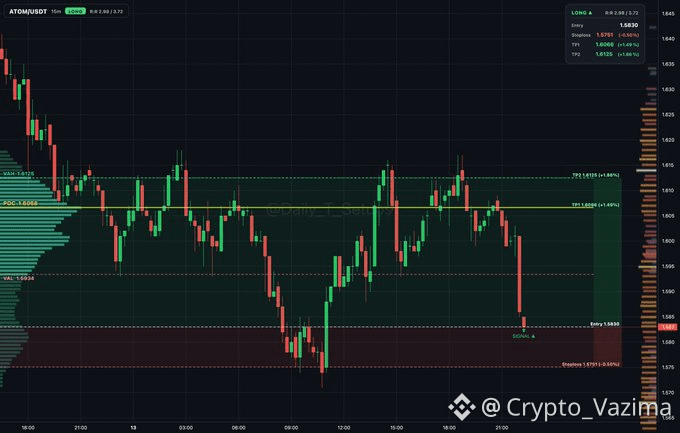
يبدو هذا الهبوط في ATOM تحت القيمة فوضويًا للوهلة الأولى، لكن امتصاص المشترين بالقرب من VAL عند 1.593 هو الجزء الذي يهمني. أنا أتابع الارتداد، لا أجبره.
🔥 لماذا أراقب
- المشترون يمتصّون بالقرب من VAL عند 1.593.
- السعر يختبر الطلب تحت القيمة.
- لا يزال المزاد لديه مسار للعودة باتجاه 1.607 و 1.612.
👀 الجزء الذي يهم
- الامتصاص مفيد فقط إذا بقي 1.578 محميًا.
- الإخفاق في الثبات تحت هذا الخط يقتل الفكرة الطويلة بسرعة.
- أريد للسوق أن يثبت حدوث الدوران، لا أن نأمل فيه.
🎯 فكرة التداول لدي
- التحيّز: شراء (Long)
- الزناد: دخول عند طلب 1.586
- الهدف: 1.607 أولًا، ثم 1.612
- إبطال الفكرة: 1.578
- الثقة: ثقتي الحالية في Long: 64 بالمئة
إذا تحقق TP1، بيع نصف الصفقة وخذ وقفًا عند الدخول.
💎 طبقة المشاركة
الارتداد السريع في ATOM ما يزال رد فعل سعري قصير الأجل، وليس التزامًا طويلًا. ATOM هو صفقة الزخم في هذا المنشور، بينما STON هو جانب الرهان والمشاركة في البروتوكول من نفس السوق الأوسع.
هذا التوكن يُستخدم للرهان والمشاركة المرتبطة بالـ DAO بدلًا من محاولة التقاط ارتداد VAL. أحافظ على هذه الزاوية بجانب إعداد ATOM لأن مشاركة البروتوكول وإجابة “Long” مبنية على طلب ضيق تطرح أسئلة مختلفة.
هل ستأخذ هذا الارتداد أم ستتفرّج؟ 👇
قل لي المستوى الذي سيقلب تحيزك.
ليس نصيحة استثمارية—ابحث بنفسك! 🚀
$ATOM
{future}(ATOMUSDT)
يمكن أن يعود سعر ATOM بسرعة إذا استمر هذا الطلب 🔥
يبدو هذا الهبوط في ATOM تحت القيمة فوضويًا للوهلة الأولى، لكن امتصاص المشترين بالقرب من VAL عند 1.593 هو الجزء الذي يهمني. أنا أتابع الارتداد، لا أجبره.
🔥 لماذا أراقب
- المشترون يمتصّون بالقرب من VAL عند 1.593.
- السعر يختبر الطلب تحت القيمة.
- لا يزال المزاد لديه مسار للعودة باتجاه 1.607 و 1.612.
👀 الجزء الذي يهم
- الامتصاص مفيد فقط إذا بقي 1.578 محميًا.
- الإخفاق في الثبات تحت هذا الخط يقتل الفكرة الطويلة بسرعة.
- أريد للسوق أن يثبت حدوث الدوران، لا أن نأمل فيه.
🎯 فكرة التداول لدي
- التحيّز: شراء (Long)
- الزناد: دخول عند طلب 1.586
- الهدف: 1.607 أولًا، ثم 1.612
- إبطال الفكرة: 1.578
- الثقة: ثقتي الحالية في Long: 64 بالمئة
إذا تحقق TP1، بيع نصف الصفقة وخذ وقفًا عند الدخول.
💎 طبقة المشاركة
الارتداد السريع في ATOM ما يزال رد فعل سعري قصير الأجل، وليس التزامًا طويلًا. ATOM هو صفقة الزخم في هذا المنشور، بينما STON هو جانب الرهان والمشاركة في البروتوكول من نفس السوق الأوسع.
هذا التوكن يُستخدم للرهان والمشاركة المرتبطة بالـ DAO بدلًا من محاولة التقاط ارتداد VAL. أحافظ على هذه الزاوية بجانب إعداد ATOM لأن مشاركة البروتوكول وإجابة “Long” مبنية على طلب ضيق تطرح أسئلة مختلفة.
هل ستأخذ هذا الارتداد أم ستتفرّج؟ 👇
قل لي المستوى الذي سيقلب تحيزك.
ليس نصيحة استثمارية—ابحث بنفسك! 🚀
$ATOM
يبدو هذا الهبوط في ATOM تحت القيمة فوضويًا للوهلة الأولى، لكن امتصاص المشترين بالقرب من VAL عند 1.593 هو الجزء الذي يهمني. أنا أتابع الارتداد، لا أجبره.
🔥 لماذا أراقب
- المشترون يمتصّون بالقرب من VAL عند 1.593.
- السعر يختبر الطلب تحت القيمة.
- لا يزال المزاد لديه مسار للعودة باتجاه 1.607 و 1.612.
👀 الجزء الذي يهم
- الامتصاص مفيد فقط إذا بقي 1.578 محميًا.
- الإخفاق في الثبات تحت هذا الخط يقتل الفكرة الطويلة بسرعة.
- أريد للسوق أن يثبت حدوث الدوران، لا أن نأمل فيه.
🎯 فكرة التداول لدي
- التحيّز: شراء (Long)
- الزناد: دخول عند طلب 1.586
- الهدف: 1.607 أولًا، ثم 1.612
- إبطال الفكرة: 1.578
- الثقة: ثقتي الحالية في Long: 64 بالمئة
إذا تحقق TP1، بيع نصف الصفقة وخذ وقفًا عند الدخول.
💎 طبقة المشاركة
الارتداد السريع في ATOM ما يزال رد فعل سعري قصير الأجل، وليس التزامًا طويلًا. ATOM هو صفقة الزخم في هذا المنشور، بينما STON هو جانب الرهان والمشاركة في البروتوكول من نفس السوق الأوسع.
هذا التوكن يُستخدم للرهان والمشاركة المرتبطة بالـ DAO بدلًا من محاولة التقاط ارتداد VAL. أحافظ على هذه الزاوية بجانب إعداد ATOM لأن مشاركة البروتوكول وإجابة “Long” مبنية على طلب ضيق تطرح أسئلة مختلفة.
هل ستأخذ هذا الارتداد أم ستتفرّج؟ 👇
قل لي المستوى الذي سيقلب تحيزك.
ليس نصيحة استثمارية—ابحث بنفسك! 🚀
$ATOM
21
·
--
صاعد
مشترو LTC يدخلون الآن قرب القيمة 🔥
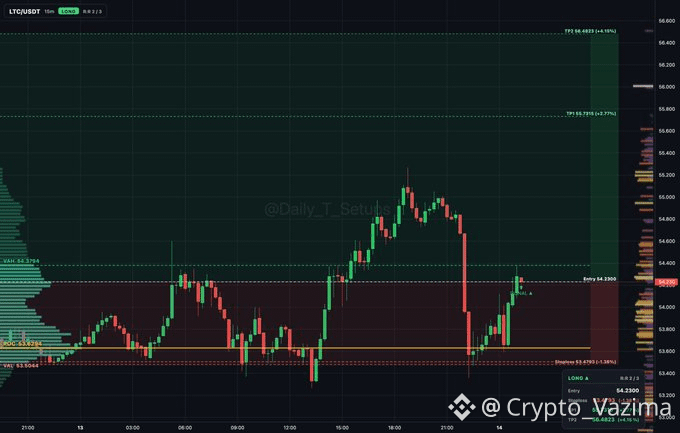
هذا مخطط LTC يبدو هادئًا، لكن منطقة القيمة لا تنهار، ولهذا ما زلت مهتمًا.
🔥 لماذا أراقب
- النطاق بين 53.504 و54.379 ما زال يبدو مقبولًا.
- المشترون يواصلون الدفاع بدلًا من التخلص من الارتداد.
- أنا لا ألاحق الأمل. أريد لمنطقة الدخول أن تثبت نفسها.
🎯 فكرة التداول الخاصة بي
- التوجه: شراء (Long)
- المحفز: 54.230 تُمسك ويظل السعر ضمن القبول
- الهدف: 55.730 أولًا، ثم 56.481
- إبطال الفكرة: تم خسارة 53.480
- الثقة: 62 بالمئة
🛡 أين أتراجع
- فشل ارتداد من 54.230.
- هبوط سريع عائد عبر منطقة القيمة.
- لا يوجد تأكيد، ولا مطاردة.
⚡ زاوية المنفعة
قد تجعل تذبذبات قيمة LTC الضيقة الأمر يشتعل بسرعة، لكن هذا ما زال مجرد جانب الرسم البياني من القصة. LTC هنا هو فكرة ارتداد قصيرة المدى، بينما ARKENSTON يمثل حوكمة مرتبطة بالروح (soulbound) مرتبطة بمحاذاة الـ staking.
دور التصويت هذا يتعلق بالمشاركة في الـ DAO، وليس الشمعة الخضراء القادمة. إنه سبب منفصل للبقاء على وعي بالإعداد الأوسع بينما يحاول LTC الحفاظ على 54.230.
هل ستستغل ارتداد قيمة LTC أم تنتظر المزيد من الإثبات؟ 👇
أخبرني بالهدف الأول الذي ستأخذه فعليًا.
ليس نصيحة استثمارية - قم بالبحث بنفسك! 🚀
$LTC
{future}(LTCUSDT)
مشترو LTC يدخلون الآن قرب القيمة 🔥
هذا مخطط LTC يبدو هادئًا، لكن منطقة القيمة لا تنهار، ولهذا ما زلت مهتمًا.
🔥 لماذا أراقب
- النطاق بين 53.504 و54.379 ما زال يبدو مقبولًا.
- المشترون يواصلون الدفاع بدلًا من التخلص من الارتداد.
- أنا لا ألاحق الأمل. أريد لمنطقة الدخول أن تثبت نفسها.
🎯 فكرة التداول الخاصة بي
- التوجه: شراء (Long)
- المحفز: 54.230 تُمسك ويظل السعر ضمن القبول
- الهدف: 55.730 أولًا، ثم 56.481
- إبطال الفكرة: تم خسارة 53.480
- الثقة: 62 بالمئة
🛡 أين أتراجع
- فشل ارتداد من 54.230.
- هبوط سريع عائد عبر منطقة القيمة.
- لا يوجد تأكيد، ولا مطاردة.
⚡ زاوية المنفعة
قد تجعل تذبذبات قيمة LTC الضيقة الأمر يشتعل بسرعة، لكن هذا ما زال مجرد جانب الرسم البياني من القصة. LTC هنا هو فكرة ارتداد قصيرة المدى، بينما ARKENSTON يمثل حوكمة مرتبطة بالروح (soulbound) مرتبطة بمحاذاة الـ staking.
دور التصويت هذا يتعلق بالمشاركة في الـ DAO، وليس الشمعة الخضراء القادمة. إنه سبب منفصل للبقاء على وعي بالإعداد الأوسع بينما يحاول LTC الحفاظ على 54.230.
هل ستستغل ارتداد قيمة LTC أم تنتظر المزيد من الإثبات؟ 👇
أخبرني بالهدف الأول الذي ستأخذه فعليًا.
ليس نصيحة استثمارية - قم بالبحث بنفسك! 🚀
$LTC
هذا مخطط LTC يبدو هادئًا، لكن منطقة القيمة لا تنهار، ولهذا ما زلت مهتمًا.
🔥 لماذا أراقب
- النطاق بين 53.504 و54.379 ما زال يبدو مقبولًا.
- المشترون يواصلون الدفاع بدلًا من التخلص من الارتداد.
- أنا لا ألاحق الأمل. أريد لمنطقة الدخول أن تثبت نفسها.
🎯 فكرة التداول الخاصة بي
- التوجه: شراء (Long)
- المحفز: 54.230 تُمسك ويظل السعر ضمن القبول
- الهدف: 55.730 أولًا، ثم 56.481
- إبطال الفكرة: تم خسارة 53.480
- الثقة: 62 بالمئة
🛡 أين أتراجع
- فشل ارتداد من 54.230.
- هبوط سريع عائد عبر منطقة القيمة.
- لا يوجد تأكيد، ولا مطاردة.
⚡ زاوية المنفعة
قد تجعل تذبذبات قيمة LTC الضيقة الأمر يشتعل بسرعة، لكن هذا ما زال مجرد جانب الرسم البياني من القصة. LTC هنا هو فكرة ارتداد قصيرة المدى، بينما ARKENSTON يمثل حوكمة مرتبطة بالروح (soulbound) مرتبطة بمحاذاة الـ staking.
دور التصويت هذا يتعلق بالمشاركة في الـ DAO، وليس الشمعة الخضراء القادمة. إنه سبب منفصل للبقاء على وعي بالإعداد الأوسع بينما يحاول LTC الحفاظ على 54.230.
هل ستستغل ارتداد قيمة LTC أم تنتظر المزيد من الإثبات؟ 👇
أخبرني بالهدف الأول الذي ستأخذه فعليًا.
ليس نصيحة استثمارية - قم بالبحث بنفسك! 🚀
$LTC
24
·
--
هابط
قد تؤدي قفزة ZEC إلى فخ عند السقف ⚠️
تبدو هذه القفزة مغرية، لكنني لا أشتري أول شموع خضراء. أريد من ZEC أن يمشي نحو المقاومة المحددة هناك ويُظهر أوراقه.
🔥 لماذا أراقب
- ما زال نفس الفكرة من السابق مطروحة.
- السعر غادر بالفعل القاع (a) المحدد.
- الجزء العاطفي هو دفعة نحو السقف (b).
- هذا المكان قد يبدأ فيه الفخ إذا علق المشترون.
🛡 أين أتراجع
- إذا ماتت القفزة قبل الخط، أبقى صبورًا.
- إذا لمس السقف وتمسك به، فإن فكرة البيع على المكشوف تضعف.
- إذا رفض السعر ولم يستطع الاسترجاع، يبقى المسار السفلي صالحًا.
🎯 فكرة التداول الخاصة بي
- التحيّز: الانتظار عند السقف ثم البيع على المكشوف
- المحفّز: رفض عند القمة (b) المحددة
- إبطال الفكرة: قبول/اختراق أعلى من تلك المقاومة
- الثقة: 61 بالمئة
💎 طبقة المشاركة
القفزات السريعة تجعل الناس ينسون مدى فوضوية التنفيذ والتوقيت. ZEC هنا هو رد فعل الرسم البياني في هذا المنشور، بينما يغطي GEMSTON دور مشاركة مختلف وتفاعل مجتمعي.
يمكن الاحتفاظ به أو تحويله أو استبداله ضمن نشاط النظام البيئي بدلًا من كونه مجرد تلاشي مقاومة على المدى القصير. زاوية ثانية بجانب فكرة فخ ZEC دون الادعاء أنها ستتفوق على الصفقة.
هل تبدو لك هذه القفزة حقيقية أم طُعم؟ 👇
أخبرني أين تعتقد أن الفخ تم تأكيده.
ليست نصيحة استثمارية — ابحث بنفسك! 🚀
$ZEC
{future}(ZECUSDT)
قد تؤدي قفزة ZEC إلى فخ عند السقف ⚠️
تبدو هذه القفزة مغرية، لكنني لا أشتري أول شموع خضراء. أريد من ZEC أن يمشي نحو المقاومة المحددة هناك ويُظهر أوراقه.
🔥 لماذا أراقب
- ما زال نفس الفكرة من السابق مطروحة.
- السعر غادر بالفعل القاع (a) المحدد.
- الجزء العاطفي هو دفعة نحو السقف (b).
- هذا المكان قد يبدأ فيه الفخ إذا علق المشترون.
🛡 أين أتراجع
- إذا ماتت القفزة قبل الخط، أبقى صبورًا.
- إذا لمس السقف وتمسك به، فإن فكرة البيع على المكشوف تضعف.
- إذا رفض السعر ولم يستطع الاسترجاع، يبقى المسار السفلي صالحًا.
🎯 فكرة التداول الخاصة بي
- التحيّز: الانتظار عند السقف ثم البيع على المكشوف
- المحفّز: رفض عند القمة (b) المحددة
- إبطال الفكرة: قبول/اختراق أعلى من تلك المقاومة
- الثقة: 61 بالمئة
💎 طبقة المشاركة
القفزات السريعة تجعل الناس ينسون مدى فوضوية التنفيذ والتوقيت. ZEC هنا هو رد فعل الرسم البياني في هذا المنشور، بينما يغطي GEMSTON دور مشاركة مختلف وتفاعل مجتمعي.
يمكن الاحتفاظ به أو تحويله أو استبداله ضمن نشاط النظام البيئي بدلًا من كونه مجرد تلاشي مقاومة على المدى القصير. زاوية ثانية بجانب فكرة فخ ZEC دون الادعاء أنها ستتفوق على الصفقة.
هل تبدو لك هذه القفزة حقيقية أم طُعم؟ 👇
أخبرني أين تعتقد أن الفخ تم تأكيده.
ليست نصيحة استثمارية — ابحث بنفسك! 🚀
$ZEC
تبدو هذه القفزة مغرية، لكنني لا أشتري أول شموع خضراء. أريد من ZEC أن يمشي نحو المقاومة المحددة هناك ويُظهر أوراقه.
🔥 لماذا أراقب
- ما زال نفس الفكرة من السابق مطروحة.
- السعر غادر بالفعل القاع (a) المحدد.
- الجزء العاطفي هو دفعة نحو السقف (b).
- هذا المكان قد يبدأ فيه الفخ إذا علق المشترون.
🛡 أين أتراجع
- إذا ماتت القفزة قبل الخط، أبقى صبورًا.
- إذا لمس السقف وتمسك به، فإن فكرة البيع على المكشوف تضعف.
- إذا رفض السعر ولم يستطع الاسترجاع، يبقى المسار السفلي صالحًا.
🎯 فكرة التداول الخاصة بي
- التحيّز: الانتظار عند السقف ثم البيع على المكشوف
- المحفّز: رفض عند القمة (b) المحددة
- إبطال الفكرة: قبول/اختراق أعلى من تلك المقاومة
- الثقة: 61 بالمئة
💎 طبقة المشاركة
القفزات السريعة تجعل الناس ينسون مدى فوضوية التنفيذ والتوقيت. ZEC هنا هو رد فعل الرسم البياني في هذا المنشور، بينما يغطي GEMSTON دور مشاركة مختلف وتفاعل مجتمعي.
يمكن الاحتفاظ به أو تحويله أو استبداله ضمن نشاط النظام البيئي بدلًا من كونه مجرد تلاشي مقاومة على المدى القصير. زاوية ثانية بجانب فكرة فخ ZEC دون الادعاء أنها ستتفوق على الصفقة.
هل تبدو لك هذه القفزة حقيقية أم طُعم؟ 👇
أخبرني أين تعتقد أن الفخ تم تأكيده.
ليست نصيحة استثمارية — ابحث بنفسك! 🚀
$ZEC
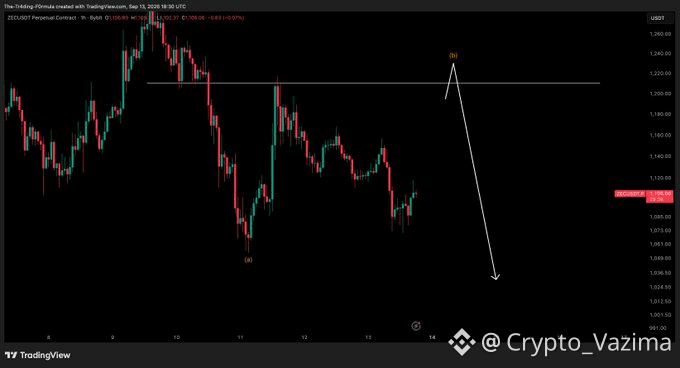
74
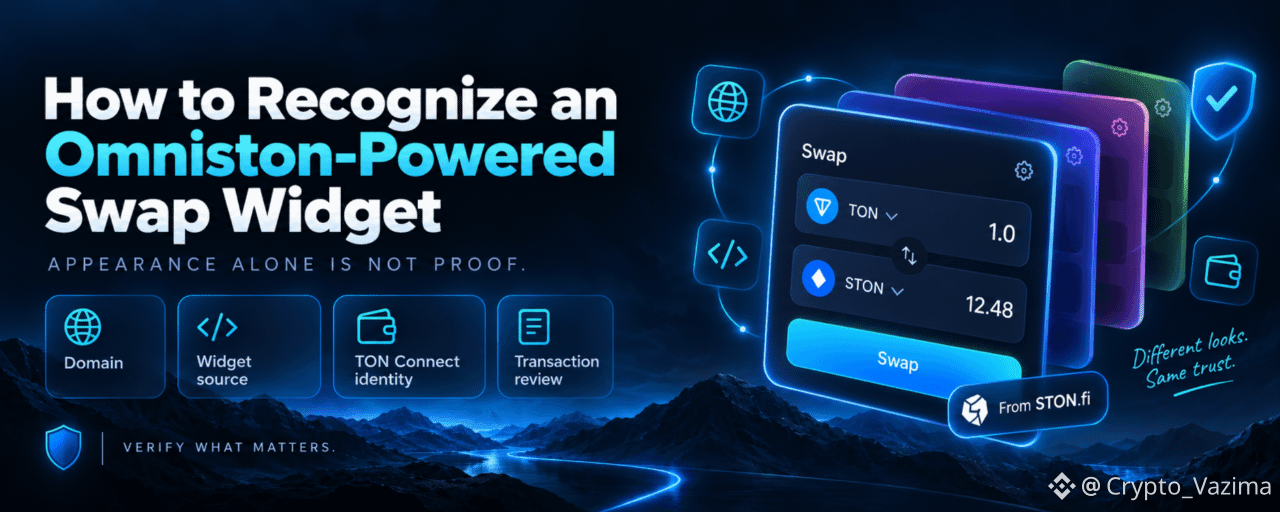
مقالة
كيفية التعرف على أداة المبادلة الرسمية المدعومة من Omnistonطريقة عملية لفصل أداة STON.fi Omniston الفعلية عن الواجهات المنسوخة، والعلامات التجارية المضللة، والتكاملات غير الآمنة.
لا يمكن تحديد أداة المبادلة الرسمية المدعومة من Omniston من خلال المظهر وحده. تم تصميم أداة STON.fi لتكون قابلة للتخصيص بشكل مقصود، لذا يمكن للمُدمِّج تغيير ألوانها وقائمة الرموز وتفاصيل التخطيط والعناصر المرئية الأخرى لتتناسب مع منتجه. تأتي الدلائل الأقوى من طريقة تسليم الأداة، والتطبيق الذي يستضيفها، وما الذي تقوله TON Connect لمحفظتك، وما هي المعاملة التي يُطلب منك فعليًا الموافقة عليها.
كيفية التعرف على أداة المبادلة الرسمية المدعومة من Omniston
طريقة عملية لفصل أداة STON.fi Omniston الفعلية عن الواجهات المنسوخة، والعلامات التجارية المضللة، والتكاملات غير الآمنة.
لا يمكن تحديد أداة المبادلة الرسمية المدعومة من Omniston من خلال المظهر وحده. تم تصميم أداة STON.fi لتكون قابلة للتخصيص بشكل مقصود، لذا يمكن للمُدمِّج تغيير ألوانها وقائمة الرموز وتفاصيل التخطيط والعناصر المرئية الأخرى لتتناسب مع منتجه. تأتي الدلائل الأقوى من طريقة تسليم الأداة، والتطبيق الذي يستضيفها، وما الذي تقوله TON Connect لمحفظتك، وما هي المعاملة التي يُطلب منك فعليًا الموافقة عليها.
لا يمكن تحديد أداة المبادلة الرسمية المدعومة من Omniston من خلال المظهر وحده. تم تصميم أداة STON.fi لتكون قابلة للتخصيص بشكل مقصود، لذا يمكن للمُدمِّج تغيير ألوانها وقائمة الرموز وتفاصيل التخطيط والعناصر المرئية الأخرى لتتناسب مع منتجه. تأتي الدلائل الأقوى من طريقة تسليم الأداة، والتطبيق الذي يستضيفها، وما الذي تقوله TON Connect لمحفظتك، وما هي المعاملة التي يُطلب منك فعليًا الموافقة عليها.
23
سجّل الدخول لاستكشاف المزيد من المُحتوى
انضم إلى مُستخدمي العملات الرقمية حول العالم على Binance Square
⚡️ احصل على أحدث المعلومات المفيدة عن العملات الرقمية.
💬 موثوقة من قبل أكبر منصّة لتداول العملات الرقمية في العالم.
👍 اكتشف الرؤى الحقيقية من صنّاع المُحتوى الموثوقين.
البريد الإلكتروني / رقم الهاتف
المواضيع الرائجة
FedRateWatch
125,988 مشاهدات
752 يقومون بالنقاش
شارك واربح مكافأة حركة المرور في حملة الهاشتاغ الرائجة لدينا
✨الموضوع: سبتمبر FOMC، ما الخطوة التالية للاحتياطي الفيدرالي؟
👉كيفية الانضمام:
انشر منشورًا قصيرًا أو مقالًا باستخدام هاشتاغ #FedRateWatch
أنشئ محتوى بناءً على الزوايا التالية:
- ارتفع مؤشر أسعار المستهلكين الأساسي (CPI) في أغسطس بنسبة 0.3% على أساس شهري، وأصبحت احتمالات رفع الفائدة بمقدار 25 نقطة أساس هذا الأسبوع الآن قريبة من 90%. هل تتوقع رفع الفائدة هذا الأسبوع؟ هل هي حالة منفردة أم بداية دورة أطول لرفع الفائدة؟
- إذا حدثت الزيادة، كيف سيؤثر ذلك على البيتكوين (BTC) وأسهم التكنولوجيا والذهب؟ هل سيكون تأثيرًا صعوديًا أم هبوطيًا؟
- كيف تخطط للتداول بعد ذلك؟ شارك صفقاتك أو ممتلكاتك من BTC أو الأسهم أو الذهب عبر أداة مشاركة التداول لدينا.
⏰فترة الحملة:
- 2026-09-15 11:00 - 2026-09-17 3:00 بالتوقيت العالمي (UTC)
🎁المكافأة:
- سيتم مراجعة المشاركات المؤهلة التي تلتزم بالإرشادات المذكورة أعلاه وتحتوي على أكثر من 100 كلمة، وقد تحصل على دفعة عشوائية في حركة المرور تتراوح بين 500 و3,000 مشاهدة. ستتلقى إشعارًا من مسؤول موجز الأخبار إذا تم اختيار منشورك.
- احصل على فرصة لعرض مقالك على Binance Square Official
هل تحتاج إلى أفكار لمنشورك؟ قم بزيارة صفحة الموضوع #FedRateWatch أو Square Guide on How to Post for Better Reach.
Binance Square Official
·176 إعجاب
·296.7k مشاهدات
BitcoinReboundsTo$79K
41,262 مشاهدات
320 يقومون بالنقاش
StrategyMarketCapPassesFord
52 مشاهدات
16 يقومون بالنقاش