
Muhamamd Adeel
634 منشورات

Muhamamd Adeel
إبلاغ
حظر المُستخدم
Daily provide Latest News.
10 تتابع
52 المتابعون
59 إعجاب
منشورات
الكل
اقتباسات
مقالة
عرض الترجمة
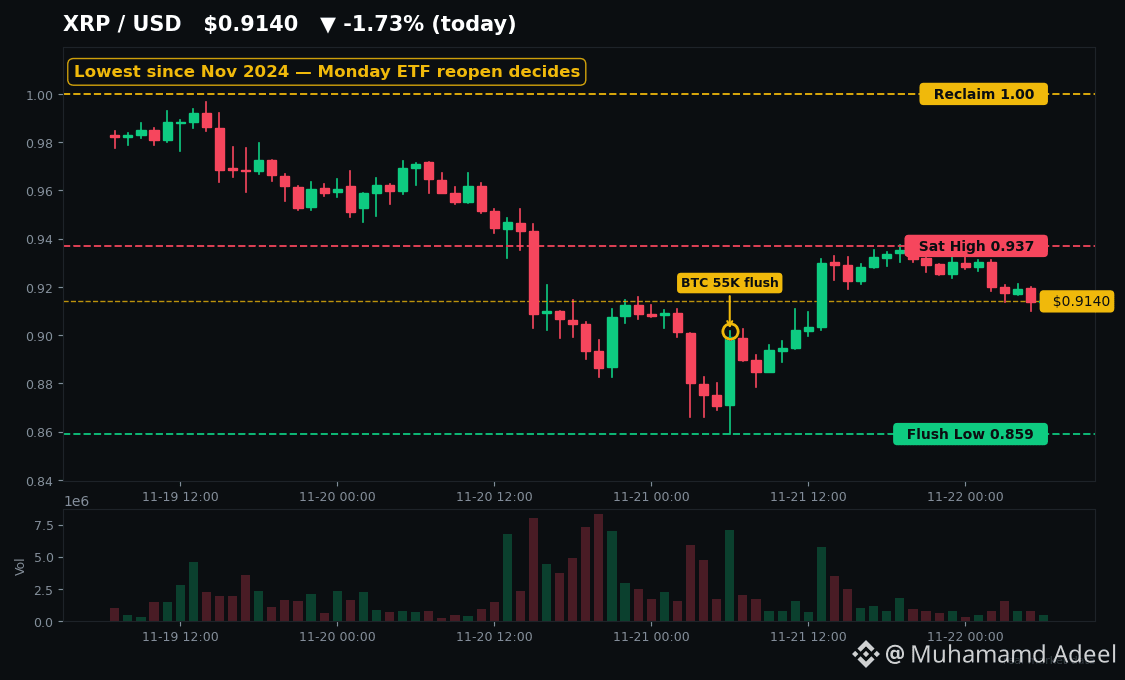
XRP Hit $0.859, Its Lowest Since 2024 — Monday Decides Everything$XRP just printed $0.859 — its lowest price since November 2024.
And here's the twist nobody's pricing in: while you were panic-selling, the biggest wallets didn't dump. They moved.
Saturday was a bloodbath. $BTC flushed to $55,100 — a two-year low — and XRP undercut its own 14 November low of $0.89, wicking to $0.859 before buyers stepped in. About $18M in XRP longs got liquidated in 24 hours, 94% of them longs (CoinGlass via CoinDesk). Then came the V: XRP bounced roughly 8% off the low into Saturday's close near $0.93. It's sitting around $0.91 now, with Fear & Greed at 11 — Extreme Fear.
So why didn't it keep falling? Look at what the whales actually did. On 15 November, 240M XRP moved between wallets at the two-year low. On 17 November, another 140M XRP moved. CoinDesk checked: neither batch went to an exchange. Meanwhile, Binance's XRP supply is the tightest in five months (CryptoQuant's Supply Shortage Index hit 2.4 on 19 November), and whales pulled more than $127M off Binance between 10–16 November. Retail is selling at a loss — the 90-day realized profit-to-loss ratio is 0.38 — while wallets holding 10,000+ XRP climbed past 343,500. That's not distribution. That's absorption.
Now the honest part. The ETF bid is gone. US spot XRP ETFs have bled $30.76M in November with zero inflow days — nearly the worst month since launch — and total assets slipped below $1B. The crowd is still 72% long by accounts, which means there's still fuel for another flush. And history is brutal here: November is on track to be XRP's worst November on record (down about 25%), and after XRP's five worst Novembers, December was red every single time. In 2022 and 2024, real bottoms took months to build, not one weekend.
So Monday decides everything. The levels are clean: $0.859 is the line — lose it on a closing basis and analysts like Ali Martinez see $0.80, then $0.64. Reclaim $0.937 (Saturday's high) and then $1.00, and the whole "dead coin" narrative flips. Tap $XRP and pull up the chart — that $0.859 low versus the $1.00 reclaim is the entire trade right now, and Monday's ETF reopen tells you which side has real money behind it.
Capitulation low or bull trap — which one are you calling?
#XRP #Crypto
Not financial advice. DYOR.
XRP Hit $0.859, Its Lowest Since 2024 — Monday Decides Everything
$XRP just printed $0.859 — its lowest price since November 2024.
And here's the twist nobody's pricing in: while you were panic-selling, the biggest wallets didn't dump. They moved.
Saturday was a bloodbath. $BTC flushed to $55,100 — a two-year low — and XRP undercut its own 14 November low of $0.89, wicking to $0.859 before buyers stepped in. About $18M in XRP longs got liquidated in 24 hours, 94% of them longs (CoinGlass via CoinDesk). Then came the V: XRP bounced roughly 8% off the low into Saturday's close near $0.93. It's sitting around $0.91 now, with Fear & Greed at 11 — Extreme Fear.
So why didn't it keep falling? Look at what the whales actually did. On 15 November, 240M XRP moved between wallets at the two-year low. On 17 November, another 140M XRP moved. CoinDesk checked: neither batch went to an exchange. Meanwhile, Binance's XRP supply is the tightest in five months (CryptoQuant's Supply Shortage Index hit 2.4 on 19 November), and whales pulled more than $127M off Binance between 10–16 November. Retail is selling at a loss — the 90-day realized profit-to-loss ratio is 0.38 — while wallets holding 10,000+ XRP climbed past 343,500. That's not distribution. That's absorption.
Now the honest part. The ETF bid is gone. US spot XRP ETFs have bled $30.76M in November with zero inflow days — nearly the worst month since launch — and total assets slipped below $1B. The crowd is still 72% long by accounts, which means there's still fuel for another flush. And history is brutal here: November is on track to be XRP's worst November on record (down about 25%), and after XRP's five worst Novembers, December was red every single time. In 2022 and 2024, real bottoms took months to build, not one weekend.
So Monday decides everything. The levels are clean: $0.859 is the line — lose it on a closing basis and analysts like Ali Martinez see $0.80, then $0.64. Reclaim $0.937 (Saturday's high) and then $1.00, and the whole "dead coin" narrative flips. Tap $XRP and pull up the chart — that $0.859 low versus the $1.00 reclaim is the entire trade right now, and Monday's ETF reopen tells you which side has real money behind it.
Capitulation low or bull trap — which one are you calling?
#XRP #Crypto
Not financial advice. DYOR.
And here's the twist nobody's pricing in: while you were panic-selling, the biggest wallets didn't dump. They moved.
Saturday was a bloodbath. $BTC flushed to $55,100 — a two-year low — and XRP undercut its own 14 November low of $0.89, wicking to $0.859 before buyers stepped in. About $18M in XRP longs got liquidated in 24 hours, 94% of them longs (CoinGlass via CoinDesk). Then came the V: XRP bounced roughly 8% off the low into Saturday's close near $0.93. It's sitting around $0.91 now, with Fear & Greed at 11 — Extreme Fear.
So why didn't it keep falling? Look at what the whales actually did. On 15 November, 240M XRP moved between wallets at the two-year low. On 17 November, another 140M XRP moved. CoinDesk checked: neither batch went to an exchange. Meanwhile, Binance's XRP supply is the tightest in five months (CryptoQuant's Supply Shortage Index hit 2.4 on 19 November), and whales pulled more than $127M off Binance between 10–16 November. Retail is selling at a loss — the 90-day realized profit-to-loss ratio is 0.38 — while wallets holding 10,000+ XRP climbed past 343,500. That's not distribution. That's absorption.
Now the honest part. The ETF bid is gone. US spot XRP ETFs have bled $30.76M in November with zero inflow days — nearly the worst month since launch — and total assets slipped below $1B. The crowd is still 72% long by accounts, which means there's still fuel for another flush. And history is brutal here: November is on track to be XRP's worst November on record (down about 25%), and after XRP's five worst Novembers, December was red every single time. In 2022 and 2024, real bottoms took months to build, not one weekend.
So Monday decides everything. The levels are clean: $0.859 is the line — lose it on a closing basis and analysts like Ali Martinez see $0.80, then $0.64. Reclaim $0.937 (Saturday's high) and then $1.00, and the whole "dead coin" narrative flips. Tap $XRP and pull up the chart — that $0.859 low versus the $1.00 reclaim is the entire trade right now, and Monday's ETF reopen tells you which side has real money behind it.
Capitulation low or bull trap — which one are you calling?
#XRP #Crypto
Not financial advice. DYOR.
14
مقالة
بيتكوين تخسر مستوى 60 ألف دولار. و$AAVE يخوض اختبار الضغط الحقيقي للتو$BTC فقد للتو مستوى 60 ألف دولار. مؤشر الخوف عند 12. لكن اختبار الضغط الحقيقي ليس على مخطط بيتكوين، بل على $AAVE.
في الإقراض، تبدأ الانهيارات بالتحول إلى الأسوأ. لذا إليك السؤال الذي لا يطرحه أحد: لماذا لم يتصدع أكبر مُقرض في عالم التمويل اللامركزي (DeFi)؟
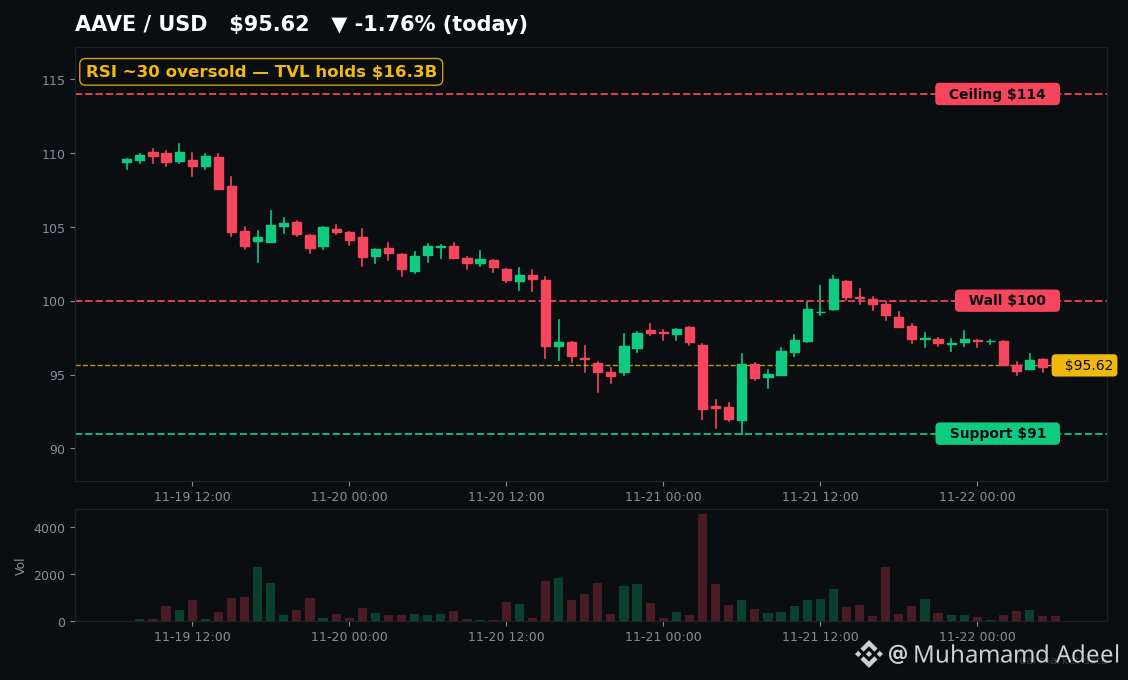
العملة تنهار. $AAVE يتداول عند نحو 96 دولارًا، منخفضًا قرابة 35% خلال شهر، وأقل بنحو 85% من أعلى مستوى له على الإطلاق عند 661.69 دولارًا في مايو 2021. يحوم مؤشر القوة النسبية (RSI) قرب 30، أي في منطقة التشبع البيعي. والسعر أدنى من جميع المتوسطات المتحركة الرئيسية. على الورق، يبدو هذا كاستسلام.
بيتكوين تخسر مستوى 60 ألف دولار. و$AAVE يخوض اختبار الضغط الحقيقي للتو
$BTC فقد للتو مستوى 60 ألف دولار. مؤشر الخوف عند 12. لكن اختبار الضغط الحقيقي ليس على مخطط بيتكوين، بل على $AAVE .
في الإقراض، تبدأ الانهيارات بالتحول إلى الأسوأ. لذا إليك السؤال الذي لا يطرحه أحد: لماذا لم يتصدع أكبر مُقرض في عالم التمويل اللامركزي (DeFi)؟
العملة تنهار. $AAVE يتداول عند نحو 96 دولارًا، منخفضًا قرابة 35% خلال شهر، وأقل بنحو 85% من أعلى مستوى له على الإطلاق عند 661.69 دولارًا في مايو 2021. يحوم مؤشر القوة النسبية (RSI) قرب 30، أي في منطقة التشبع البيعي. والسعر أدنى من جميع المتوسطات المتحركة الرئيسية. على الورق، يبدو هذا كاستسلام.
في الإقراض، تبدأ الانهيارات بالتحول إلى الأسوأ. لذا إليك السؤال الذي لا يطرحه أحد: لماذا لم يتصدع أكبر مُقرض في عالم التمويل اللامركزي (DeFi)؟
العملة تنهار. $AAVE يتداول عند نحو 96 دولارًا، منخفضًا قرابة 35% خلال شهر، وأقل بنحو 85% من أعلى مستوى له على الإطلاق عند 661.69 دولارًا في مايو 2021. يحوم مؤشر القوة النسبية (RSI) قرب 30، أي في منطقة التشبع البيعي. والسعر أدنى من جميع المتوسطات المتحركة الرئيسية. على الورق، يبدو هذا كاستسلام.
34
مقالة
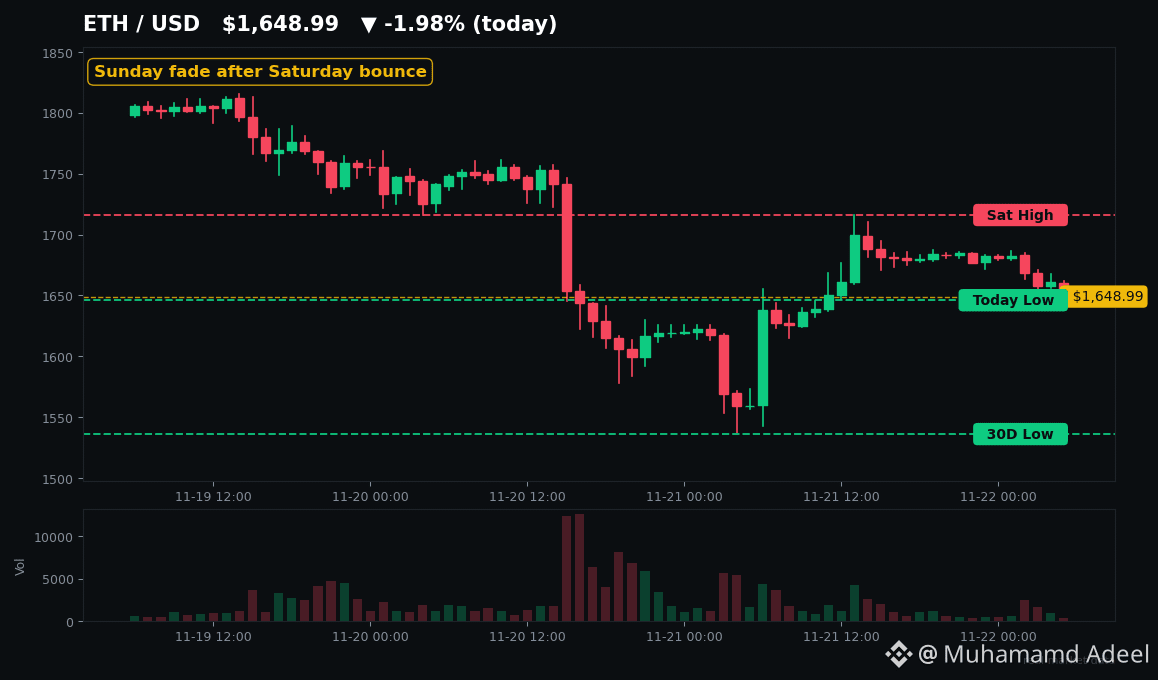
ETH بعد كسر BTC حاجز 60 ألف دولار: المستويات التي ستحسم اتجاه الاثنين$ETH ارتد من 1,536 دولارًا يوم السبت. ويوم الأحد يعيد بالفعل خسائره.
إليكم ما لا يريد أحد قوله بصراحة: كان الارتداد نتيجة تغطية مراكز البيع على المكشوف، لا دخول مشترين إلى السوق. وسيوضح افتتاح التداول يوم الاثنين أيهما سيفوز.
**ما الذي حدث فعليًا**
يوم الجمعة، $BTC خسر 60,000 دولار للمرة الأولى منذ يوليو. وتراجع يوم السبت إلى 55,100 دولار — وهو أدنى مستوى منذ سبتمبر 2024 — ثم ارتد سريعًا باتجاه 60,300 دولار.
الخسائر: تصفية مراكز بقيمة 1.57 مليار دولار خلال 24 ساعة (CoinGlass، خلال فترة 20 نوفمبر). بلغت حصة BTC منها 554 مليون دولار، وكانت 91% من مراكز الشراء. أما ETH، فبلغت خسائره 331 مليون دولار. وكانت أكبر تصفية منفردة لمركز شراء في ETH بقيمة 11.98 مليون دولار على Binance.
ETH بعد كسر BTC حاجز 60 ألف دولار: المستويات التي ستحسم اتجاه الاثنين
$ETH ارتد من 1,536 دولارًا يوم السبت. ويوم الأحد يعيد بالفعل خسائره.
إليكم ما لا يريد أحد قوله بصراحة: كان الارتداد نتيجة تغطية مراكز البيع على المكشوف، لا دخول مشترين إلى السوق. وسيوضح افتتاح التداول يوم الاثنين أيهما سيفوز.
**ما الذي حدث فعليًا**
يوم الجمعة، $BTC خسر 60,000 دولار للمرة الأولى منذ يوليو. وتراجع يوم السبت إلى 55,100 دولار — وهو أدنى مستوى منذ سبتمبر 2024 — ثم ارتد سريعًا باتجاه 60,300 دولار.
الخسائر: تصفية مراكز بقيمة 1.57 مليار دولار خلال 24 ساعة (CoinGlass، خلال فترة 20 نوفمبر). بلغت حصة BTC منها 554 مليون دولار، وكانت 91% من مراكز الشراء. أما ETH، فبلغت خسائره 331 مليون دولار. وكانت أكبر تصفية منفردة لمركز شراء في ETH بقيمة 11.98 مليون دولار على Binance.
إليكم ما لا يريد أحد قوله بصراحة: كان الارتداد نتيجة تغطية مراكز البيع على المكشوف، لا دخول مشترين إلى السوق. وسيوضح افتتاح التداول يوم الاثنين أيهما سيفوز.
**ما الذي حدث فعليًا**
يوم الجمعة، $BTC خسر 60,000 دولار للمرة الأولى منذ يوليو. وتراجع يوم السبت إلى 55,100 دولار — وهو أدنى مستوى منذ سبتمبر 2024 — ثم ارتد سريعًا باتجاه 60,300 دولار.
الخسائر: تصفية مراكز بقيمة 1.57 مليار دولار خلال 24 ساعة (CoinGlass، خلال فترة 20 نوفمبر). بلغت حصة BTC منها 554 مليون دولار، وكانت 91% من مراكز الشراء. أما ETH، فبلغت خسائره 331 مليون دولار. وكانت أكبر تصفية منفردة لمركز شراء في ETH بقيمة 11.98 مليون دولار على Binance.
51
مقالة
عرض الترجمة
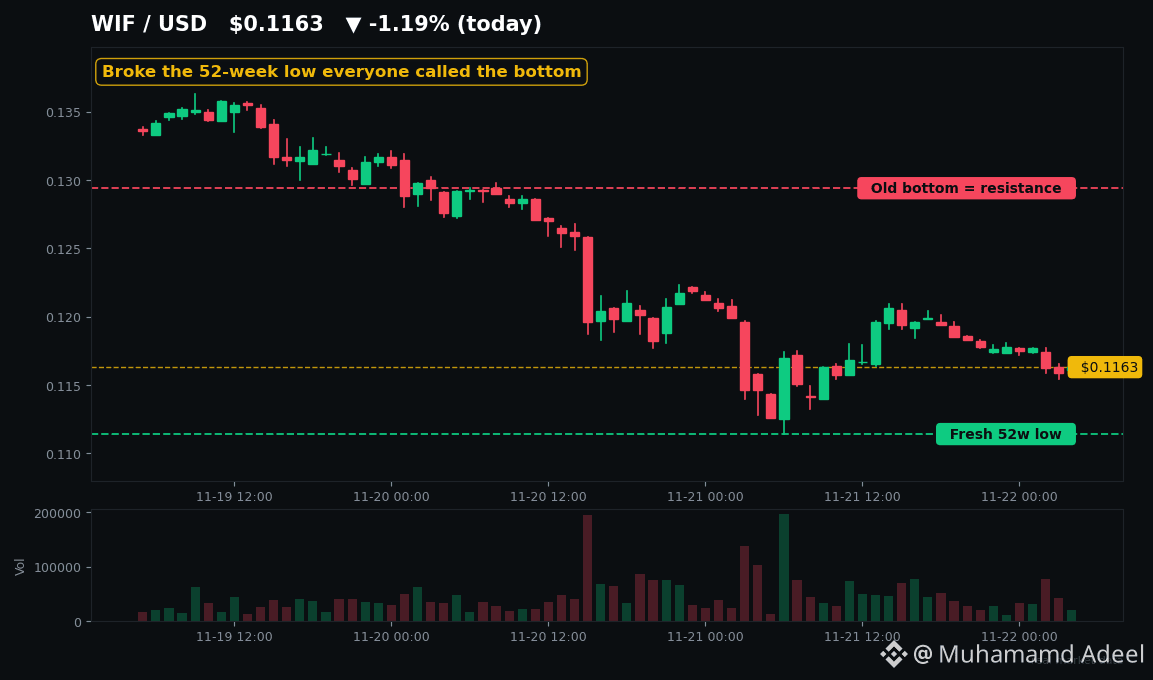
WIF Just Broke the "Bottom" Everyone TrustedEveryone called $0.1294 the bottom last week. $WIF just smashed through it.
WIF is trading near $0.116 today — a fresh 52-week low, down roughly 40% in 30 days, and 97.6% below its $4.83 all-time high from March 2024. Of the six big memes, it's the weakest performer this month. Even today's bounce tells the story: $WIF is up about 1.5% while DOGE and SHIB are up 5%. The dog in the hat is lagging its own bounce.
Here's what this really means. Last week, $0.1294 was the line everyone pointed at — "52-week low, RSI oversold, this is the floor." The floor didn't hold. Price stepped down through it to $0.111, and that old low is now resistance. That's how downtrends work: every "bottom" becomes the next ceiling until buyers actually prove otherwise.
The oversold case is real, though. Daily RSI is near 23 — deeply oversold territory. History says WIF bounces violently from extremes like this: +90% in two weeks in August 2024, +350% in spring 2025. But here's the catch nobody mentions — since December 2024, every single bounce made a lower high and rolled over. Oversold describes the downtrend. It doesn't end it.
And the structure underneath is ugly. There's no WIF-specific bad news — this is pure market drag after BTC flushed to $55.1K on Saturday, with Fear & Greed at 11. But WIF has extra problems: Binance put it on the Monitoring Tag back in March and it's still there nine months later, Bitfinex already delisted it, and the top 10 wallets hold somewhere between a third and nearly half of all supply. On-chain liquidity is only about $3.8M. $BONK — its Solana rival — is now worth roughly 50% more. The rotation left the hat behind.
So what matters now? Two levels. Support is $0.111, the fresh low — lose that and $0.10 is next, with nothing much below. Resistance is $0.124 first, then the $0.129-$0.132 zone that just broke. A reclaim of $0.124 is the first hint the bleeding is stopping; until then, every bounce is guilty until proven innocent. Watch $SOL too — WIF doesn't move alone, it moves with Solana risk appetite.
Tap $WIF and look at that $0.111 level yourself — capitulation bottom, or one more leg down?
#WIF #Solana
Not financial advice. DYOR.
WIF Just Broke the "Bottom" Everyone Trusted
Everyone called $0.1294 the bottom last week. $WIF just smashed through it.
WIF is trading near $0.116 today — a fresh 52-week low, down roughly 40% in 30 days, and 97.6% below its $4.83 all-time high from March 2024. Of the six big memes, it's the weakest performer this month. Even today's bounce tells the story: $WIF is up about 1.5% while DOGE and SHIB are up 5%. The dog in the hat is lagging its own bounce.
Here's what this really means. Last week, $0.1294 was the line everyone pointed at — "52-week low, RSI oversold, this is the floor." The floor didn't hold. Price stepped down through it to $0.111, and that old low is now resistance. That's how downtrends work: every "bottom" becomes the next ceiling until buyers actually prove otherwise.
The oversold case is real, though. Daily RSI is near 23 — deeply oversold territory. History says WIF bounces violently from extremes like this: +90% in two weeks in August 2024, +350% in spring 2025. But here's the catch nobody mentions — since December 2024, every single bounce made a lower high and rolled over. Oversold describes the downtrend. It doesn't end it.
And the structure underneath is ugly. There's no WIF-specific bad news — this is pure market drag after BTC flushed to $55.1K on Saturday, with Fear & Greed at 11. But WIF has extra problems: Binance put it on the Monitoring Tag back in March and it's still there nine months later, Bitfinex already delisted it, and the top 10 wallets hold somewhere between a third and nearly half of all supply. On-chain liquidity is only about $3.8M. $BONK — its Solana rival — is now worth roughly 50% more. The rotation left the hat behind.
So what matters now? Two levels. Support is $0.111, the fresh low — lose that and $0.10 is next, with nothing much below. Resistance is $0.124 first, then the $0.129-$0.132 zone that just broke. A reclaim of $0.124 is the first hint the bleeding is stopping; until then, every bounce is guilty until proven innocent. Watch $SOL too — WIF doesn't move alone, it moves with Solana risk appetite.
Tap $WIF and look at that $0.111 level yourself — capitulation bottom, or one more leg down?
#WIF #Solana
Not financial advice. DYOR.
WIF is trading near $0.116 today — a fresh 52-week low, down roughly 40% in 30 days, and 97.6% below its $4.83 all-time high from March 2024. Of the six big memes, it's the weakest performer this month. Even today's bounce tells the story: $WIF is up about 1.5% while DOGE and SHIB are up 5%. The dog in the hat is lagging its own bounce.
Here's what this really means. Last week, $0.1294 was the line everyone pointed at — "52-week low, RSI oversold, this is the floor." The floor didn't hold. Price stepped down through it to $0.111, and that old low is now resistance. That's how downtrends work: every "bottom" becomes the next ceiling until buyers actually prove otherwise.
The oversold case is real, though. Daily RSI is near 23 — deeply oversold territory. History says WIF bounces violently from extremes like this: +90% in two weeks in August 2024, +350% in spring 2025. But here's the catch nobody mentions — since December 2024, every single bounce made a lower high and rolled over. Oversold describes the downtrend. It doesn't end it.
And the structure underneath is ugly. There's no WIF-specific bad news — this is pure market drag after BTC flushed to $55.1K on Saturday, with Fear & Greed at 11. But WIF has extra problems: Binance put it on the Monitoring Tag back in March and it's still there nine months later, Bitfinex already delisted it, and the top 10 wallets hold somewhere between a third and nearly half of all supply. On-chain liquidity is only about $3.8M. $BONK — its Solana rival — is now worth roughly 50% more. The rotation left the hat behind.
So what matters now? Two levels. Support is $0.111, the fresh low — lose that and $0.10 is next, with nothing much below. Resistance is $0.124 first, then the $0.129-$0.132 zone that just broke. A reclaim of $0.124 is the first hint the bleeding is stopping; until then, every bounce is guilty until proven innocent. Watch $SOL too — WIF doesn't move alone, it moves with Solana risk appetite.
Tap $WIF and look at that $0.111 level yourself — capitulation bottom, or one more leg down?
#WIF #Solana
Not financial advice. DYOR.
52
مقالة
تجاوزت BTC حاجز 60 ألف دولار — والآن يبدأ الاختبار الحقيقي يوم الاثنين$BTC هبطت إلى 55,100 دولار يوم السبت — وهو أدنى سعر مسجل لها منذ سبتمبر 2024.
ثم قفزت نحو 9% عائدةً باتجاه 60 ألف دولار. هل حُسم الأمر؟ ليس حتى قريبًا. الاختبار الحقيقي يبدأ يوم الاثنين.
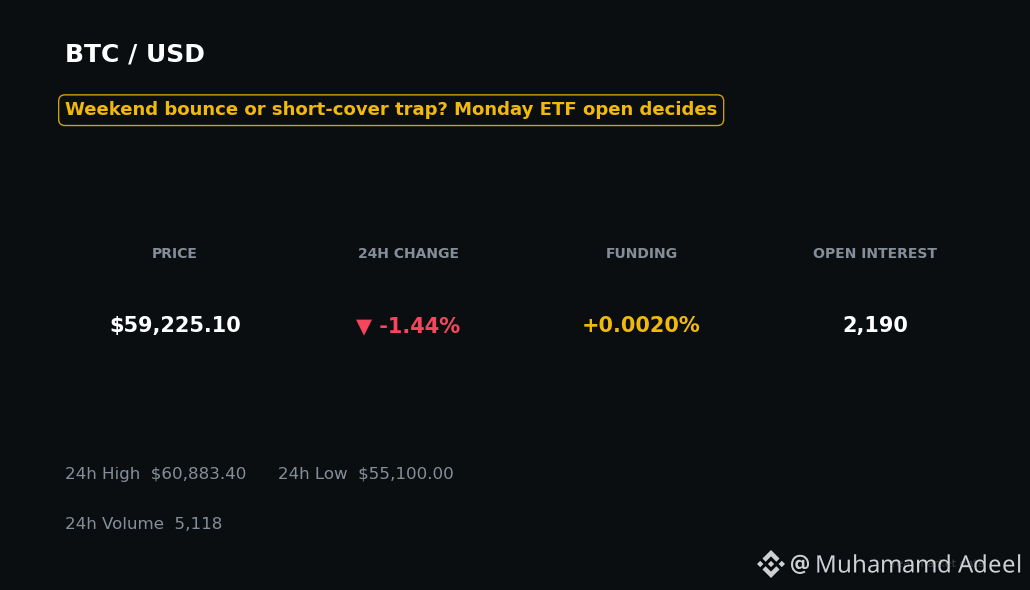
إليك ما حدث فعليًا في عطلة نهاية الأسبوع هذه. يوم الجمعة، تجاوزت بيتكوين حاجز 60,000 دولار للمرة الأولى منذ يوليو. وصباح السبت، واصلت التراجع إلى 55,130–55,251 دولارًا — وهو أدنى مستوى لها منذ عامين، وأقل بنحو 52% من الرقم القياسي المسجل في أكتوبر 2025، قرب 126,000 دولار. ثم ظهر المشترون ودفعوا بها مجددًا إلى نحو 60,000 دولار بحلول مساء السبت. وبينما أكتب هذا يوم الأحد، تحوم العملة دون 60 ألف دولار بقليل، عند نحو 59.2 ألف دولار على منصة كراكن.
تجاوزت BTC حاجز 60 ألف دولار — والآن يبدأ الاختبار الحقيقي يوم الاثنين
$BTC هبطت إلى 55,100 دولار يوم السبت — وهو أدنى سعر مسجل لها منذ سبتمبر 2024.
ثم قفزت نحو 9% عائدةً باتجاه 60 ألف دولار. هل حُسم الأمر؟ ليس حتى قريبًا. الاختبار الحقيقي يبدأ يوم الاثنين.
إليك ما حدث فعليًا في عطلة نهاية الأسبوع هذه. يوم الجمعة، تجاوزت بيتكوين حاجز 60,000 دولار للمرة الأولى منذ يوليو. وصباح السبت، واصلت التراجع إلى 55,130–55,251 دولارًا — وهو أدنى مستوى لها منذ عامين، وأقل بنحو 52% من الرقم القياسي المسجل في أكتوبر 2025، قرب 126,000 دولار. ثم ظهر المشترون ودفعوا بها مجددًا إلى نحو 60,000 دولار بحلول مساء السبت. وبينما أكتب هذا يوم الأحد، تحوم العملة دون 60 ألف دولار بقليل، عند نحو 59.2 ألف دولار على منصة كراكن.
ثم قفزت نحو 9% عائدةً باتجاه 60 ألف دولار. هل حُسم الأمر؟ ليس حتى قريبًا. الاختبار الحقيقي يبدأ يوم الاثنين.
إليك ما حدث فعليًا في عطلة نهاية الأسبوع هذه. يوم الجمعة، تجاوزت بيتكوين حاجز 60,000 دولار للمرة الأولى منذ يوليو. وصباح السبت، واصلت التراجع إلى 55,130–55,251 دولارًا — وهو أدنى مستوى لها منذ عامين، وأقل بنحو 52% من الرقم القياسي المسجل في أكتوبر 2025، قرب 126,000 دولار. ثم ظهر المشترون ودفعوا بها مجددًا إلى نحو 60,000 دولار بحلول مساء السبت. وبينما أكتب هذا يوم الأحد، تحوم العملة دون 60 ألف دولار بقليل، عند نحو 59.2 ألف دولار على منصة كراكن.
73
مقالة
عرض الترجمة
Whales Are Fighting at $55K — $343M Out, $239M In. Who Wins?One whale pulled $343M of Bitcoin off exchanges today. Another pushed $239M back onto Binance. Same day. Same low. Opposite bets.
That's the story right now — whales are fighting at the bottom, and nobody has won yet. Tap $BTC and look at the $55.1K wick yourself.
**The split, in plain numbers**
On-chain trackers linked Abraxas Capital-labeled wallets to a withdrawal of 5,856 BTC (~$343M) from Binance and Kraken over roughly 8 hours today. Hours later, Lookonchain reported two unknown wallets depositing 4,069 BTC (~$239M) into Binance.
Withdrawals are not confirmed buys, and deposits are not confirmed sells. Abraxas also cleared its holdings on Nov 18 after a leaked API key cost it ~$10.39M — so today's move could be re-accumulation, custody reshuffling, or hedged positioning. Anyone claiming to know which is guessing.
**Underneath, the big wallets disagree with each other**
CryptoQuant data through Nov 19 shows wallets holding 1,000+ BTC accumulated 35,000 BTC over 30 days, including 11,500 BTC in the last 7 days. That's real accumulation while price was falling.
But Glassnode's Nov 15 report says the same whale cohort was still net-depositing ~$55M/day more to exchanges than it withdrew, on a 30-day average. Both things are true at once. That's not a market bottoming in unison — that's a market arguing with itself.
Meanwhile, long-term holders are now spending at a loss: LTH-SOPR sits at 0.627, meaning the average long-term holder moving coins today is realizing roughly a 37% loss. When the most patient holders start eating losses, you're deep into capitulation territory — not necessarily at the end of it.
**The bounce has a tell**
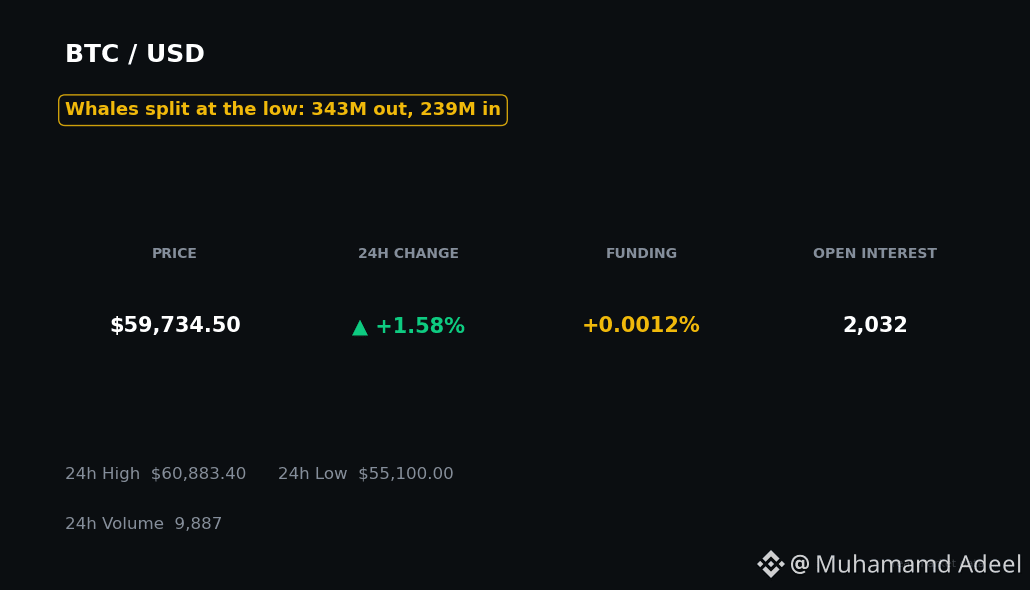
Bitcoin wicked to $55,100 on Kraken early Saturday, its lowest since September 2024, then bounced back near $59,700. Here's the part most people missed: Binance funding flipped negative at 00:00 UTC (-0.0061%), and open interest kept falling through the entire bounce. That means the recovery was driven by shorts covering, not fresh longs piling in. By evening, funding had neutralized to roughly flat.
$ETH tells the same story — wicked to $1,536, back near $1,679. Tap $ETH and you'll see a bounce, not a trend change. Not yet.
**What to watch**
Fear & Greed is at 12 — the 9th straight day in Extreme Fear. History says readings like this marked the lows in December 2018 and March 2020. History also says June 2022's reading of 6 was five months early. Fear is a state, not a timing signal.
Three levels matter now: $55.1K (today's wick low — lose it and the flush reopens), $60K (reclaim and hold it, and the short-covering bounce starts looking real), and just under $54K (realized price, the market's average cost basis — the line bears are aiming at).
And Monday matters: ETFs reopen after Thursday's record $582.3M outflow day (IBIT alone -$541.1M). If that bleed resumes, weekend whale games won't save the chart.
So — accumulation or distribution? The honest answer: both, at the same time, at the same price. Which side do you think breaks first?
Not financial advice. DYOR.
Whales Are Fighting at $55K — $343M Out, $239M In. Who Wins?
One whale pulled $343M of Bitcoin off exchanges today. Another pushed $239M back onto Binance. Same day. Same low. Opposite bets.
That's the story right now — whales are fighting at the bottom, and nobody has won yet. Tap $BTC and look at the $55.1K wick yourself.
**The split, in plain numbers**
On-chain trackers linked Abraxas Capital-labeled wallets to a withdrawal of 5,856 BTC (~$343M) from Binance and Kraken over roughly 8 hours today. Hours later, Lookonchain reported two unknown wallets depositing 4,069 BTC (~$239M) into Binance.
Withdrawals are not confirmed buys, and deposits are not confirmed sells. Abraxas also cleared its holdings on Nov 18 after a leaked API key cost it ~$10.39M — so today's move could be re-accumulation, custody reshuffling, or hedged positioning. Anyone claiming to know which is guessing.
**Underneath, the big wallets disagree with each other**
CryptoQuant data through Nov 19 shows wallets holding 1,000+ BTC accumulated 35,000 BTC over 30 days, including 11,500 BTC in the last 7 days. That's real accumulation while price was falling.
But Glassnode's Nov 15 report says the same whale cohort was still net-depositing ~$55M/day more to exchanges than it withdrew, on a 30-day average. Both things are true at once. That's not a market bottoming in unison — that's a market arguing with itself.
Meanwhile, long-term holders are now spending at a loss: LTH-SOPR sits at 0.627, meaning the average long-term holder moving coins today is realizing roughly a 37% loss. When the most patient holders start eating losses, you're deep into capitulation territory — not necessarily at the end of it.
**The bounce has a tell**
Bitcoin wicked to $55,100 on Kraken early Saturday, its lowest since September 2024, then bounced back near $59,700. Here's the part most people missed: Binance funding flipped negative at 00:00 UTC (-0.0061%), and open interest kept falling through the entire bounce. That means the recovery was driven by shorts covering, not fresh longs piling in. By evening, funding had neutralized to roughly flat.
$ETH tells the same story — wicked to $1,536, back near $1,679. Tap $ETH and you'll see a bounce, not a trend change. Not yet.
**What to watch**
Fear & Greed is at 12 — the 9th straight day in Extreme Fear. History says readings like this marked the lows in December 2018 and March 2020. History also says June 2022's reading of 6 was five months early. Fear is a state, not a timing signal.
Three levels matter now: $55.1K (today's wick low — lose it and the flush reopens), $60K (reclaim and hold it, and the short-covering bounce starts looking real), and just under $54K (realized price, the market's average cost basis — the line bears are aiming at).
And Monday matters: ETFs reopen after Thursday's record $582.3M outflow day (IBIT alone -$541.1M). If that bleed resumes, weekend whale games won't save the chart.
So — accumulation or distribution? The honest answer: both, at the same time, at the same price. Which side do you think breaks first?
Not financial advice. DYOR.
That's the story right now — whales are fighting at the bottom, and nobody has won yet. Tap $BTC and look at the $55.1K wick yourself.
**The split, in plain numbers**
On-chain trackers linked Abraxas Capital-labeled wallets to a withdrawal of 5,856 BTC (~$343M) from Binance and Kraken over roughly 8 hours today. Hours later, Lookonchain reported two unknown wallets depositing 4,069 BTC (~$239M) into Binance.
Withdrawals are not confirmed buys, and deposits are not confirmed sells. Abraxas also cleared its holdings on Nov 18 after a leaked API key cost it ~$10.39M — so today's move could be re-accumulation, custody reshuffling, or hedged positioning. Anyone claiming to know which is guessing.
**Underneath, the big wallets disagree with each other**
CryptoQuant data through Nov 19 shows wallets holding 1,000+ BTC accumulated 35,000 BTC over 30 days, including 11,500 BTC in the last 7 days. That's real accumulation while price was falling.
But Glassnode's Nov 15 report says the same whale cohort was still net-depositing ~$55M/day more to exchanges than it withdrew, on a 30-day average. Both things are true at once. That's not a market bottoming in unison — that's a market arguing with itself.
Meanwhile, long-term holders are now spending at a loss: LTH-SOPR sits at 0.627, meaning the average long-term holder moving coins today is realizing roughly a 37% loss. When the most patient holders start eating losses, you're deep into capitulation territory — not necessarily at the end of it.
**The bounce has a tell**
Bitcoin wicked to $55,100 on Kraken early Saturday, its lowest since September 2024, then bounced back near $59,700. Here's the part most people missed: Binance funding flipped negative at 00:00 UTC (-0.0061%), and open interest kept falling through the entire bounce. That means the recovery was driven by shorts covering, not fresh longs piling in. By evening, funding had neutralized to roughly flat.
$ETH tells the same story — wicked to $1,536, back near $1,679. Tap $ETH and you'll see a bounce, not a trend change. Not yet.
**What to watch**
Fear & Greed is at 12 — the 9th straight day in Extreme Fear. History says readings like this marked the lows in December 2018 and March 2020. History also says June 2022's reading of 6 was five months early. Fear is a state, not a timing signal.
Three levels matter now: $55.1K (today's wick low — lose it and the flush reopens), $60K (reclaim and hold it, and the short-covering bounce starts looking real), and just under $54K (realized price, the market's average cost basis — the line bears are aiming at).
And Monday matters: ETFs reopen after Thursday's record $582.3M outflow day (IBIT alone -$541.1M). If that bleed resumes, weekend whale games won't save the chart.
So — accumulation or distribution? The honest answer: both, at the same time, at the same price. Which side do you think breaks first?
Not financial advice. DYOR.
BTC+1.36%
IBITETF-4.95%
مقالة
الاحتياطي الفيدرالي ينقسم علنًا — والبيتكوين يرتد ليتجاوز $60Kهبط ظلّ سعر البيتكوين إلى $55,100، ثم ارتد ليتجاوز $60,000 — فيما كان الاحتياطي الفيدرالي يتجادل علنًا مع نفسه.
هل هذا هو الارتداد، أم مجرد توقف قبل ديسمبر؟
إليك ما حدث فعلًا خلال الـ24 ساعة الماضية. ليلة الجمعة، $BTC هبط دون $57,000 للمرة الأولى منذ سبتمبر 2024، وصُفّيت عقود آجلة للعملات المشفرة بقيمة $2.4B خلال 24 ساعة، وكانت معظمها مراكز طويلة. يقف مؤشر الخوف والطمع عند 12 — خوف شديد، لليوم التاسع على التوالي.
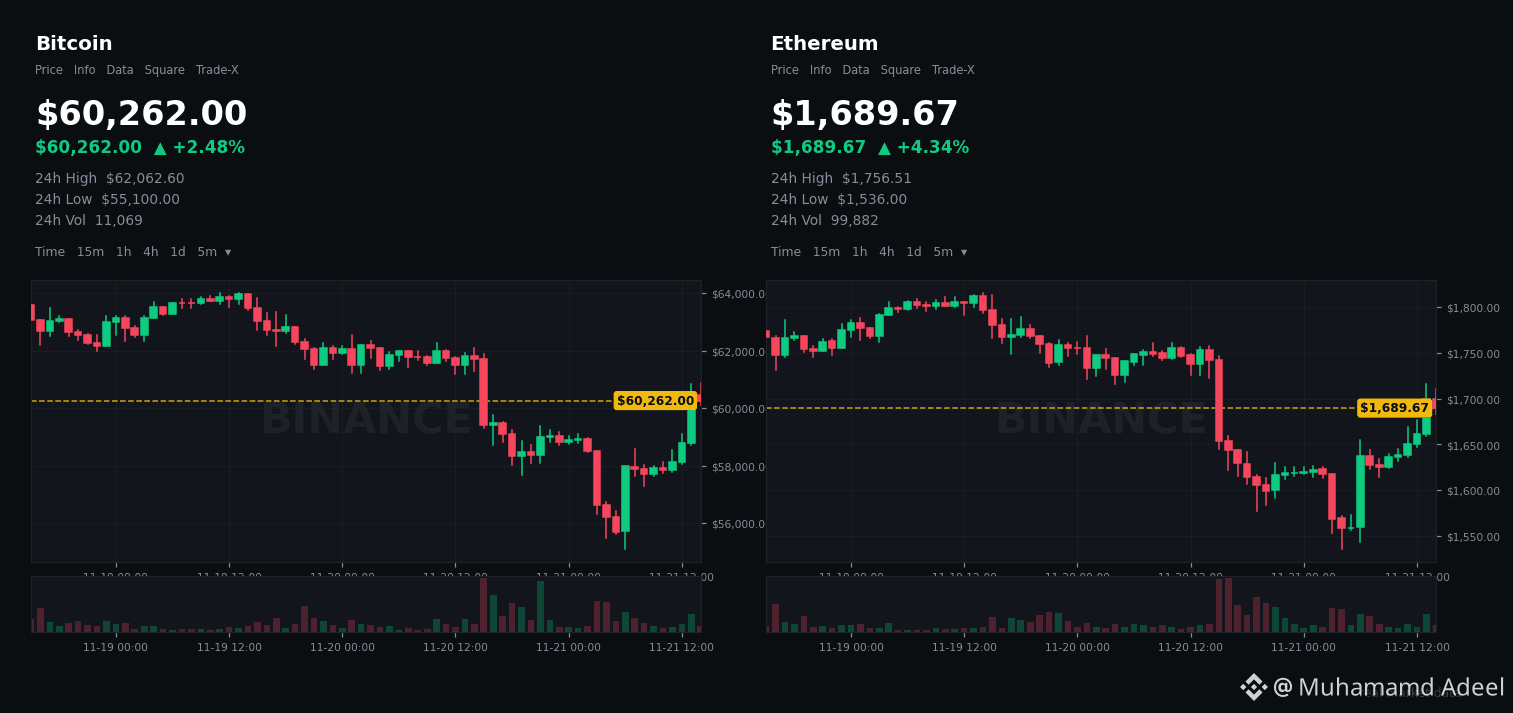
ثم يوم السبت، ارتد السعر. الآن: BTC نحو $60,295، وETH نحو $1,691. تم شراء ذلك الظل عند $55K. بسرعة.
الاحتياطي الفيدرالي ينقسم علنًا — والبيتكوين يرتد ليتجاوز $60K
هبط ظلّ سعر البيتكوين إلى $55,100، ثم ارتد ليتجاوز $60,000 — فيما كان الاحتياطي الفيدرالي يتجادل علنًا مع نفسه.
هل هذا هو الارتداد، أم مجرد توقف قبل ديسمبر؟
إليك ما حدث فعلًا خلال الـ24 ساعة الماضية. ليلة الجمعة، $BTC هبط دون $57,000 للمرة الأولى منذ سبتمبر 2024، وصُفّيت عقود آجلة للعملات المشفرة بقيمة $2.4B خلال 24 ساعة، وكانت معظمها مراكز طويلة. يقف مؤشر الخوف والطمع عند 12 — خوف شديد، لليوم التاسع على التوالي.
ثم يوم السبت، ارتد السعر. الآن: BTC نحو $60,295، وETH نحو $1,691. تم شراء ذلك الظل عند $55K. بسرعة.
هل هذا هو الارتداد، أم مجرد توقف قبل ديسمبر؟
إليك ما حدث فعلًا خلال الـ24 ساعة الماضية. ليلة الجمعة، $BTC هبط دون $57,000 للمرة الأولى منذ سبتمبر 2024، وصُفّيت عقود آجلة للعملات المشفرة بقيمة $2.4B خلال 24 ساعة، وكانت معظمها مراكز طويلة. يقف مؤشر الخوف والطمع عند 12 — خوف شديد، لليوم التاسع على التوالي.
ثم يوم السبت، ارتد السعر. الآن: BTC نحو $60,295، وETH نحو $1,691. تم شراء ذلك الظل عند $55K. بسرعة.
2
مقالة
عرض الترجمة
Fear at 12. $PENDLE Is Down 83% — But Its RWA Pivot Is RealBTC just tagged $55K and fear is sitting at 12.
So why is tokenized yield quietly rebuilding instead of dying? Tap $PENDLE and look closer — the chart and the business are telling two different stories.
Here's the split nobody is posting about. Pendle lets you split yield into two tradable pieces: PT (principal, locks a fixed rate) and YT (the yield itself). New York Life's team translated it for TradFi last week: PT is basically a zero-coupon bond, YT is an interest-only strip. Structures Wall Street has traded for decades — now onchain.
And the pivot is real. In Q3, RWA-backed dollars on Pendle grew $395M to $949M, and TVL rose 43% — its first quarterly gain in a year. By Nov 10, Pendle was the largest DeFi venue for tokenized stocks at $53.5M. Its first fixed-rate RWA market with Centrifuge on Base (deJAAA) matures Nov 26 — that's the next real test of whether this capital sticks. Ethena's new fixed-term PT-USDe markets went live Nov 10 at 5.24%–6.00% implied.
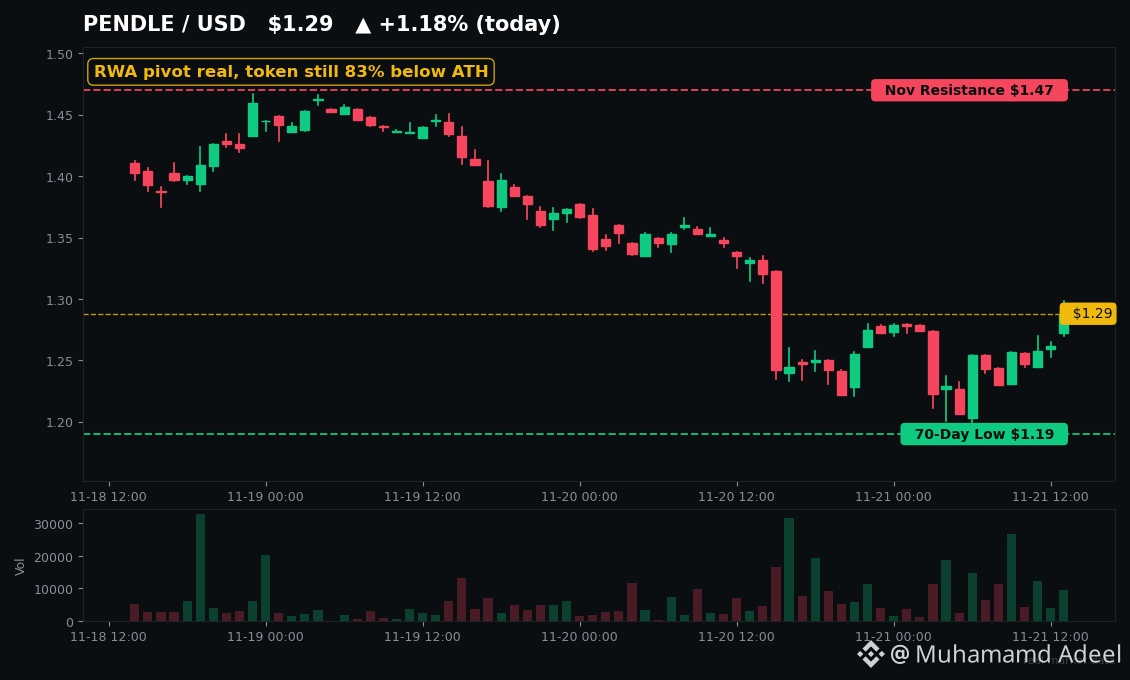
Now the honest part. $PENDLE trades near $1.29 — down about 37% in 30 days and 83% below its $7.50 ATH. TVL is $923M, a shadow of the $13.4B peak in Sep 2025. Q3 revenue was $1.86M, down 80% year-on-year. This protocol has seen mercenary capital before: TVL halved in two days in Sep 2025 when incentives ended. Add the $27.3M Penpie hack in Sep 2026 and real regulatory risk on tokenized securities, and the bear case writes itself.
One on-chain clue worth watching: on Nov 14, a whale withdrew ~770,000 PENDLE (~$1.17M) from Binance. That's an exchange outflow, not a confirmed buy — but it's not selling into fear either.
What to watch on the chart: $1.19 is the 70-day low — lose it and there's air below. Reclaim $1.47, the November resistance cluster, and the washed-out narrative gets questioned. The wider RWA market is ~$39.5B (rwa.xyz, Nov 16) with tokenized Treasuries near $13.9B — check $ONDO for the issuer side and $LINK for the oracle plumbing behind it.
BlackRock's digital assets head put it plainly this week: only ~0.01% of global stocks and bonds are tokenized. The question isn't whether yield goes onchain. It's whether $PENDLE holders capture any of it.
Not financial advice. DYOR.
Fear at 12. $PENDLE Is Down 83% — But Its RWA Pivot Is Real
BTC just tagged $55K and fear is sitting at 12.
So why is tokenized yield quietly rebuilding instead of dying? Tap $PENDLE and look closer — the chart and the business are telling two different stories.
Here's the split nobody is posting about. Pendle lets you split yield into two tradable pieces: PT (principal, locks a fixed rate) and YT (the yield itself). New York Life's team translated it for TradFi last week: PT is basically a zero-coupon bond, YT is an interest-only strip. Structures Wall Street has traded for decades — now onchain.
And the pivot is real. In Q3, RWA-backed dollars on Pendle grew $395M to $949M, and TVL rose 43% — its first quarterly gain in a year. By Nov 10, Pendle was the largest DeFi venue for tokenized stocks at $53.5M. Its first fixed-rate RWA market with Centrifuge on Base (deJAAA) matures Nov 26 — that's the next real test of whether this capital sticks. Ethena's new fixed-term PT-USDe markets went live Nov 10 at 5.24%–6.00% implied.
Now the honest part. $PENDLE trades near $1.29 — down about 37% in 30 days and 83% below its $7.50 ATH. TVL is $923M, a shadow of the $13.4B peak in Sep 2025. Q3 revenue was $1.86M, down 80% year-on-year. This protocol has seen mercenary capital before: TVL halved in two days in Sep 2025 when incentives ended. Add the $27.3M Penpie hack in Sep 2026 and real regulatory risk on tokenized securities, and the bear case writes itself.
One on-chain clue worth watching: on Nov 14, a whale withdrew ~770,000 PENDLE (~$1.17M) from Binance. That's an exchange outflow, not a confirmed buy — but it's not selling into fear either.
What to watch on the chart: $1.19 is the 70-day low — lose it and there's air below. Reclaim $1.47, the November resistance cluster, and the washed-out narrative gets questioned. The wider RWA market is ~$39.5B (rwa.xyz, Nov 16) with tokenized Treasuries near $13.9B — check $ONDO for the issuer side and $LINK for the oracle plumbing behind it.
BlackRock's digital assets head put it plainly this week: only ~0.01% of global stocks and bonds are tokenized. The question isn't whether yield goes onchain. It's whether $PENDLE holders capture any of it.
Not financial advice. DYOR.
So why is tokenized yield quietly rebuilding instead of dying? Tap $PENDLE and look closer — the chart and the business are telling two different stories.
Here's the split nobody is posting about. Pendle lets you split yield into two tradable pieces: PT (principal, locks a fixed rate) and YT (the yield itself). New York Life's team translated it for TradFi last week: PT is basically a zero-coupon bond, YT is an interest-only strip. Structures Wall Street has traded for decades — now onchain.
And the pivot is real. In Q3, RWA-backed dollars on Pendle grew $395M to $949M, and TVL rose 43% — its first quarterly gain in a year. By Nov 10, Pendle was the largest DeFi venue for tokenized stocks at $53.5M. Its first fixed-rate RWA market with Centrifuge on Base (deJAAA) matures Nov 26 — that's the next real test of whether this capital sticks. Ethena's new fixed-term PT-USDe markets went live Nov 10 at 5.24%–6.00% implied.
Now the honest part. $PENDLE trades near $1.29 — down about 37% in 30 days and 83% below its $7.50 ATH. TVL is $923M, a shadow of the $13.4B peak in Sep 2025. Q3 revenue was $1.86M, down 80% year-on-year. This protocol has seen mercenary capital before: TVL halved in two days in Sep 2025 when incentives ended. Add the $27.3M Penpie hack in Sep 2026 and real regulatory risk on tokenized securities, and the bear case writes itself.
One on-chain clue worth watching: on Nov 14, a whale withdrew ~770,000 PENDLE (~$1.17M) from Binance. That's an exchange outflow, not a confirmed buy — but it's not selling into fear either.
What to watch on the chart: $1.19 is the 70-day low — lose it and there's air below. Reclaim $1.47, the November resistance cluster, and the washed-out narrative gets questioned. The wider RWA market is ~$39.5B (rwa.xyz, Nov 16) with tokenized Treasuries near $13.9B — check $ONDO for the issuer side and $LINK for the oracle plumbing behind it.
BlackRock's digital assets head put it plainly this week: only ~0.01% of global stocks and bonds are tokenized. The question isn't whether yield goes onchain. It's whether $PENDLE holders capture any of it.
Not financial advice. DYOR.
1
مقالة
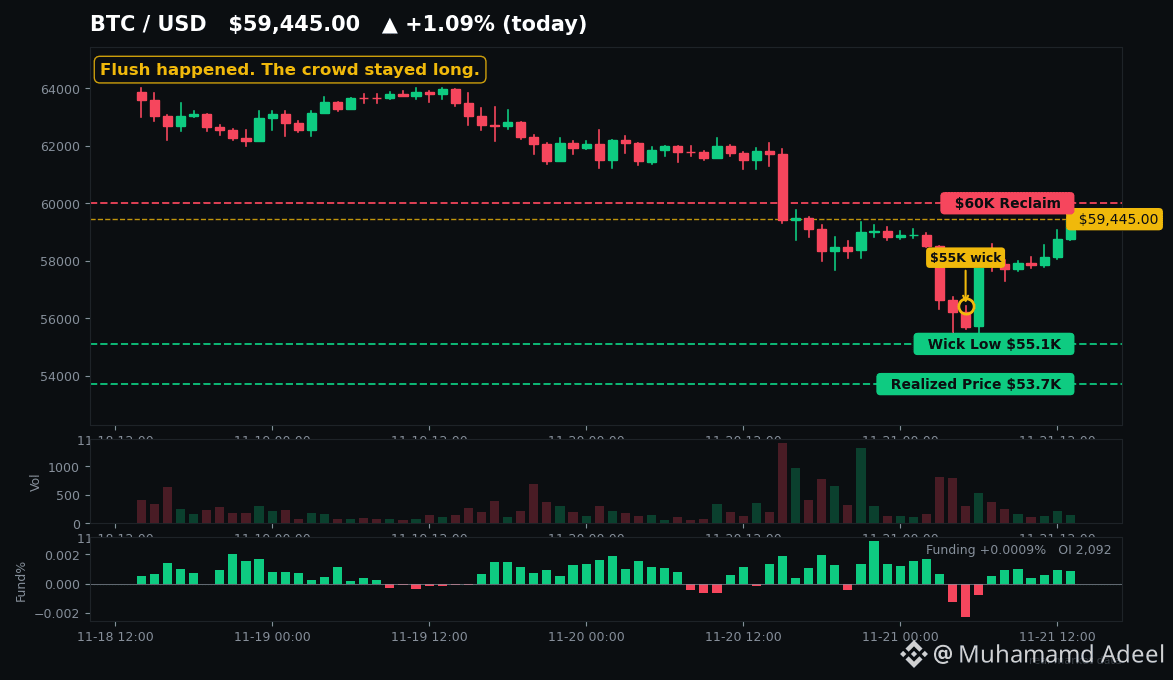
تصفية 2.4 مليار دولار — وما زال معظم المتداولين في مراكز شراءمُحي للتو 2.4 مليار دولار خلال 24 ساعة. اخترق $BTC مستوى 60 ألف دولار يوم الجمعة، ثم هبط إلى 55,100 دولار يوم السبت، وهو أدنى مستوى له منذ سبتمبر 2024.
قد تظن أن موجة التصفية هذه طهّرت السوق. لكنها لم تفعل. وهذا أهم ما يجب الانتباه إليه الآن.
**ما الذي صُفّي فعليًا**
قدّرت CoinGlass إجمالي تصفيات العملات المشفرة بـ 2.40 مليار دولار خلال 24 ساعة، وكان نحو 9 دولارات من كل 10 ناتجة عن تصفية مراكز الشراء. وحده BTC خسر أكثر من مليار دولار، و$ETH خسر 545 مليون دولار أخرى، وكانت أكبر تصفية مفردة لمركز شراء على BTC بقيمة 51.7 مليون دولار على Binance. وصُفّيت مراكز نحو 343,000 متداول.
تصفية 2.4 مليار دولار — وما زال معظم المتداولين في مراكز شراء
مُحي للتو 2.4 مليار دولار خلال 24 ساعة. اخترق $BTC مستوى 60 ألف دولار يوم الجمعة، ثم هبط إلى 55,100 دولار يوم السبت، وهو أدنى مستوى له منذ سبتمبر 2024.
قد تظن أن موجة التصفية هذه طهّرت السوق. لكنها لم تفعل. وهذا أهم ما يجب الانتباه إليه الآن.
**ما الذي صُفّي فعليًا**
قدّرت CoinGlass إجمالي تصفيات العملات المشفرة بـ 2.40 مليار دولار خلال 24 ساعة، وكان نحو 9 دولارات من كل 10 ناتجة عن تصفية مراكز الشراء. وحده BTC خسر أكثر من مليار دولار، و$ETH خسر 545 مليون دولار أخرى، وكانت أكبر تصفية مفردة لمركز شراء على BTC بقيمة 51.7 مليون دولار على Binance. وصُفّيت مراكز نحو 343,000 متداول.
قد تظن أن موجة التصفية هذه طهّرت السوق. لكنها لم تفعل. وهذا أهم ما يجب الانتباه إليه الآن.
**ما الذي صُفّي فعليًا**
قدّرت CoinGlass إجمالي تصفيات العملات المشفرة بـ 2.40 مليار دولار خلال 24 ساعة، وكان نحو 9 دولارات من كل 10 ناتجة عن تصفية مراكز الشراء. وحده BTC خسر أكثر من مليار دولار، و$ETH خسر 545 مليون دولار أخرى، وكانت أكبر تصفية مفردة لمركز شراء على BTC بقيمة 51.7 مليون دولار على Binance. وصُفّيت مراكز نحو 343,000 متداول.
مقالة
اكتتاب بـ500 مليون دولار، وتسليم 2,957 سهمًا — أصبح $ANTB متاحًاتم الاكتتاب بـ500 مليون دولار. تسليم 2,957 سهمًا. أهلًا بكم في $ANTB.
ليس هذا خطأً مطبعيًا. استوفت حملة الطرح العام الأولي لـ Anthropic في Binance Wallet سقفها البالغ 500 مليون USDC خلال ساعات في 18 نوفمبر — ثم أعادت كل سنت، لأنها لم تتمكن من تأمين سوى نحو 2,957 سهمًا مُرمّزًا. استرد الجميع أموالهم من USDC، بالإضافة إلى توزيع جوي بقيمة مليون دولار $ANTB اعتذارًا. والآن أصبح الرمز نفسه متاحًا للتداول الفوري على Binance. إذًا، ما الذي تتداولونه فعلًا؟
**ما الذي أُدرج للتو**
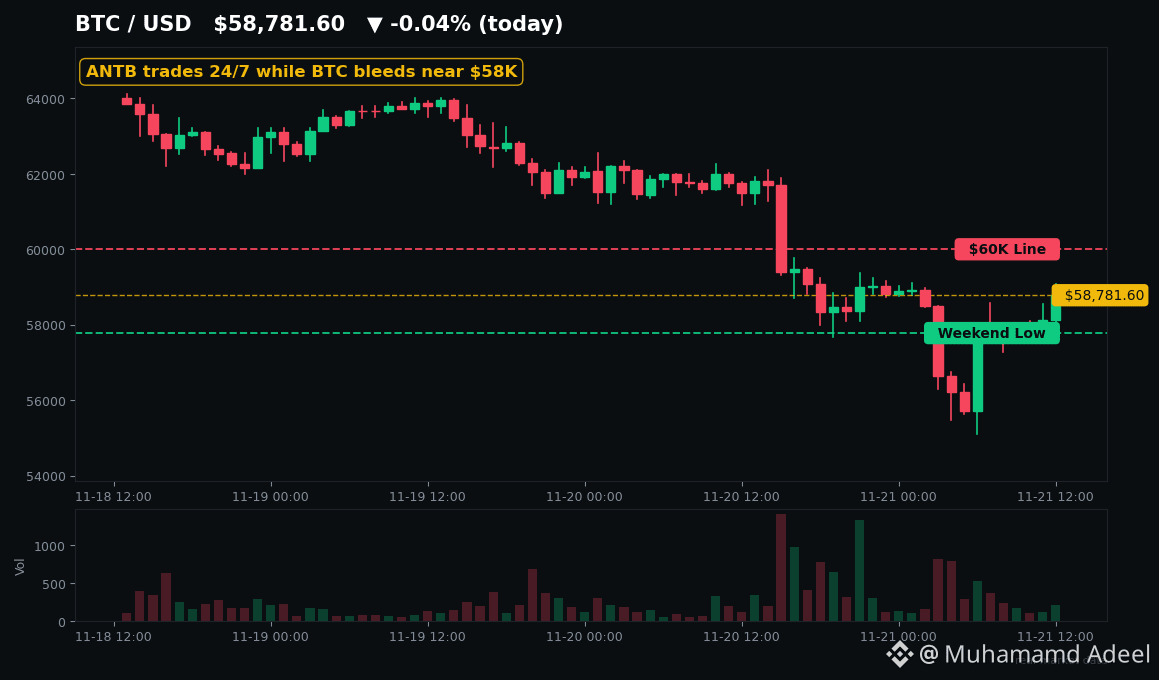
سعّرت Anthropic طرحها العام الأولي في ناسداك عند 83 دولارًا في 18 نوفمبر — أعلى من النطاق الذي تراوح بين 70 و78 دولارًا — وجمعت نحو 81.3 مليار دولار في واحد من أكبر الطروحات العامة الأولية على الإطلاق. افتتح سهم ANT عند 111.50 دولارًا، وأغلق يومه الأول عند 97.17 دولارًا، ثم تراجع إلى 88.91 دولارًا يوم الجمعة. في 20 نوفمبر، أدرجت Binance زوج ANTB/USDT على BNB Smart Chain دون رسوم صانع حتى 1 ديسمبر. اضغط على $ANTB وسترى أنه يُتداول عند نحو 87-88 دولارًا خلال عطلة نهاية الأسبوع، مع حجم تداول على Binance يبلغ نحو 16-17 مليون دولار خلال 24 ساعة — بينما ناسداك مغلق. هذه هي الفكرة باختصار: تعرّض لـ Anthropic، على مدار الساعة طوال أيام الأسبوع، من دون حساب وساطة.
اكتتاب بـ500 مليون دولار، وتسليم 2,957 سهمًا — أصبح $ANTB متاحًا
تم الاكتتاب بـ500 مليون دولار. تسليم 2,957 سهمًا. أهلًا بكم في $ANTB .
ليس هذا خطأً مطبعيًا. استوفت حملة الطرح العام الأولي لـ Anthropic في Binance Wallet سقفها البالغ 500 مليون USDC خلال ساعات في 18 نوفمبر — ثم أعادت كل سنت، لأنها لم تتمكن من تأمين سوى نحو 2,957 سهمًا مُرمّزًا. استرد الجميع أموالهم من USDC، بالإضافة إلى توزيع جوي بقيمة مليون دولار $ANTB اعتذارًا. والآن أصبح الرمز نفسه متاحًا للتداول الفوري على Binance. إذًا، ما الذي تتداولونه فعلًا؟
**ما الذي أُدرج للتو**
سعّرت Anthropic طرحها العام الأولي في ناسداك عند 83 دولارًا في 18 نوفمبر — أعلى من النطاق الذي تراوح بين 70 و78 دولارًا — وجمعت نحو 81.3 مليار دولار في واحد من أكبر الطروحات العامة الأولية على الإطلاق. افتتح سهم ANT عند 111.50 دولارًا، وأغلق يومه الأول عند 97.17 دولارًا، ثم تراجع إلى 88.91 دولارًا يوم الجمعة. في 20 نوفمبر، أدرجت Binance زوج ANTB/USDT على BNB Smart Chain دون رسوم صانع حتى 1 ديسمبر. اضغط على $ANTB وسترى أنه يُتداول عند نحو 87-88 دولارًا خلال عطلة نهاية الأسبوع، مع حجم تداول على Binance يبلغ نحو 16-17 مليون دولار خلال 24 ساعة — بينما ناسداك مغلق. هذه هي الفكرة باختصار: تعرّض لـ Anthropic، على مدار الساعة طوال أيام الأسبوع، من دون حساب وساطة.
ليس هذا خطأً مطبعيًا. استوفت حملة الطرح العام الأولي لـ Anthropic في Binance Wallet سقفها البالغ 500 مليون USDC خلال ساعات في 18 نوفمبر — ثم أعادت كل سنت، لأنها لم تتمكن من تأمين سوى نحو 2,957 سهمًا مُرمّزًا. استرد الجميع أموالهم من USDC، بالإضافة إلى توزيع جوي بقيمة مليون دولار $ANTB اعتذارًا. والآن أصبح الرمز نفسه متاحًا للتداول الفوري على Binance. إذًا، ما الذي تتداولونه فعلًا؟
**ما الذي أُدرج للتو**
سعّرت Anthropic طرحها العام الأولي في ناسداك عند 83 دولارًا في 18 نوفمبر — أعلى من النطاق الذي تراوح بين 70 و78 دولارًا — وجمعت نحو 81.3 مليار دولار في واحد من أكبر الطروحات العامة الأولية على الإطلاق. افتتح سهم ANT عند 111.50 دولارًا، وأغلق يومه الأول عند 97.17 دولارًا، ثم تراجع إلى 88.91 دولارًا يوم الجمعة. في 20 نوفمبر، أدرجت Binance زوج ANTB/USDT على BNB Smart Chain دون رسوم صانع حتى 1 ديسمبر. اضغط على $ANTB وسترى أنه يُتداول عند نحو 87-88 دولارًا خلال عطلة نهاية الأسبوع، مع حجم تداول على Binance يبلغ نحو 16-17 مليون دولار خلال 24 ساعة — بينما ناسداك مغلق. هذه هي الفكرة باختصار: تعرّض لـ Anthropic، على مدار الساعة طوال أيام الأسبوع، من دون حساب وساطة.
9
مقالة
عرض الترجمة
ETH Liquidated $545M in 24h. Is $1,536 the Flush or the Start?$545M of $ETH longs got wiped in 24 hours. Price wicked to $1,536 — and held. So was that the flush, or just the first leg?
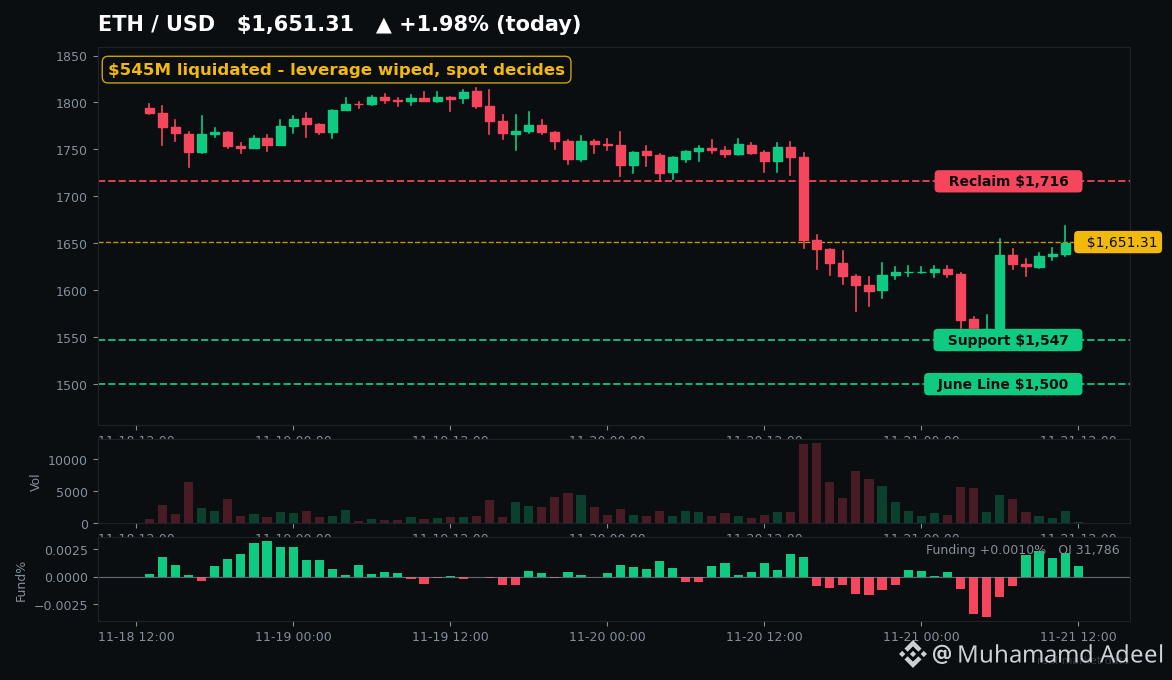
Here's the setup. Early Saturday, CoinGlass showed ~$542–546M of Ether futures liquidated in 24h, roughly 90% longs, inside a $2.4B market-wide wipeout. Open interest dropped ~9% to ~$20.7B and funding flipped negative (~-0.014%). Translation: the leverage that was propping this market up is gone. Tap $ETH and look at the chart — that wick to $1,536 stopped just $33 above June's ~$1,505 low, while Bitcoin broke its own 2026 low in the same session. ETH held its line. BTC didn't.
Now here's what makes this interesting. While traders got liquidated, stakers didn't blink. The entry queue is still ~830–837K ETH (Nov 20–21 reads) versus an exit queue of only ~150–164K — five times more ETH waiting to get IN than out. And stETH just posted its largest single-day exchange outflow since May 30 (4,186 tokens, Santiment). Meanwhile Base did 12.6M transactions yesterday against Arbitrum's 1.66M — the L2s are busy even as the token bleeds. Check $ARB against that activity and tell me the usage story is dead.
The ETH/BTC ratio is where the pain really shows: ~0.0283, down 15.9% in a year, below its 200-day average. Tap $BTC and compare the two charts side by side — ETH is still the weaker major, and that hasn't changed.
Levels that decide this: $1,547 is the support everyone is watching (daily close below it opens the $1,490 area, then the $1,500 June line). Lose $1,500 on a closing basis and analysts like CryptoPatel flag $1,400, then $1,000. Reclaim $1,716 and the week's breakdown is undone. History is honest both ways: June 2022's flush bounced 100% — then FTX made a lower low. April 2025's fear print also went lower before the real bottom. Flushes clear leverage; they don't guarantee bottoms.
The bear case is real: Thursday's final ETF print was -$131.2M out (Friday's is still incomplete at -$13.2M across 8 of 11 funds, BlackRock pending), exchanges took a net +$267.7M of ETH in 24h, and December's FOMC hike is ~95% priced. Spot selling can continue with zero leverage left to liquidate.
So the question for Monday: does $1,536 hold when the ETF bid comes back — or does spot finish what leverage started?
#Ethereum #Crypto
Not financial advice. DYOR.
ETH Liquidated $545M in 24h. Is $1,536 the Flush or the Start?
$545M of $ETH longs got wiped in 24 hours. Price wicked to $1,536 — and held. So was that the flush, or just the first leg?
Here's the setup. Early Saturday, CoinGlass showed ~$542–546M of Ether futures liquidated in 24h, roughly 90% longs, inside a $2.4B market-wide wipeout. Open interest dropped ~9% to ~$20.7B and funding flipped negative (~-0.014%). Translation: the leverage that was propping this market up is gone. Tap $ETH and look at the chart — that wick to $1,536 stopped just $33 above June's ~$1,505 low, while Bitcoin broke its own 2026 low in the same session. ETH held its line. BTC didn't.
Now here's what makes this interesting. While traders got liquidated, stakers didn't blink. The entry queue is still ~830–837K ETH (Nov 20–21 reads) versus an exit queue of only ~150–164K — five times more ETH waiting to get IN than out. And stETH just posted its largest single-day exchange outflow since May 30 (4,186 tokens, Santiment). Meanwhile Base did 12.6M transactions yesterday against Arbitrum's 1.66M — the L2s are busy even as the token bleeds. Check $ARB against that activity and tell me the usage story is dead.
The ETH/BTC ratio is where the pain really shows: ~0.0283, down 15.9% in a year, below its 200-day average. Tap $BTC and compare the two charts side by side — ETH is still the weaker major, and that hasn't changed.
Levels that decide this: $1,547 is the support everyone is watching (daily close below it opens the $1,490 area, then the $1,500 June line). Lose $1,500 on a closing basis and analysts like CryptoPatel flag $1,400, then $1,000. Reclaim $1,716 and the week's breakdown is undone. History is honest both ways: June 2022's flush bounced 100% — then FTX made a lower low. April 2025's fear print also went lower before the real bottom. Flushes clear leverage; they don't guarantee bottoms.
The bear case is real: Thursday's final ETF print was -$131.2M out (Friday's is still incomplete at -$13.2M across 8 of 11 funds, BlackRock pending), exchanges took a net +$267.7M of ETH in 24h, and December's FOMC hike is ~95% priced. Spot selling can continue with zero leverage left to liquidate.
So the question for Monday: does $1,536 hold when the ETF bid comes back — or does spot finish what leverage started?
#Ethereum #Crypto
Not financial advice. DYOR.
Here's the setup. Early Saturday, CoinGlass showed ~$542–546M of Ether futures liquidated in 24h, roughly 90% longs, inside a $2.4B market-wide wipeout. Open interest dropped ~9% to ~$20.7B and funding flipped negative (~-0.014%). Translation: the leverage that was propping this market up is gone. Tap $ETH and look at the chart — that wick to $1,536 stopped just $33 above June's ~$1,505 low, while Bitcoin broke its own 2026 low in the same session. ETH held its line. BTC didn't.
Now here's what makes this interesting. While traders got liquidated, stakers didn't blink. The entry queue is still ~830–837K ETH (Nov 20–21 reads) versus an exit queue of only ~150–164K — five times more ETH waiting to get IN than out. And stETH just posted its largest single-day exchange outflow since May 30 (4,186 tokens, Santiment). Meanwhile Base did 12.6M transactions yesterday against Arbitrum's 1.66M — the L2s are busy even as the token bleeds. Check $ARB against that activity and tell me the usage story is dead.
The ETH/BTC ratio is where the pain really shows: ~0.0283, down 15.9% in a year, below its 200-day average. Tap $BTC and compare the two charts side by side — ETH is still the weaker major, and that hasn't changed.
Levels that decide this: $1,547 is the support everyone is watching (daily close below it opens the $1,490 area, then the $1,500 June line). Lose $1,500 on a closing basis and analysts like CryptoPatel flag $1,400, then $1,000. Reclaim $1,716 and the week's breakdown is undone. History is honest both ways: June 2022's flush bounced 100% — then FTX made a lower low. April 2025's fear print also went lower before the real bottom. Flushes clear leverage; they don't guarantee bottoms.
The bear case is real: Thursday's final ETF print was -$131.2M out (Friday's is still incomplete at -$13.2M across 8 of 11 funds, BlackRock pending), exchanges took a net +$267.7M of ETH in 24h, and December's FOMC hike is ~95% priced. Spot selling can continue with zero leverage left to liquidate.
So the question for Monday: does $1,536 hold when the ETF bid comes back — or does spot finish what leverage started?
#Ethereum #Crypto
Not financial advice. DYOR.
2
مقالة
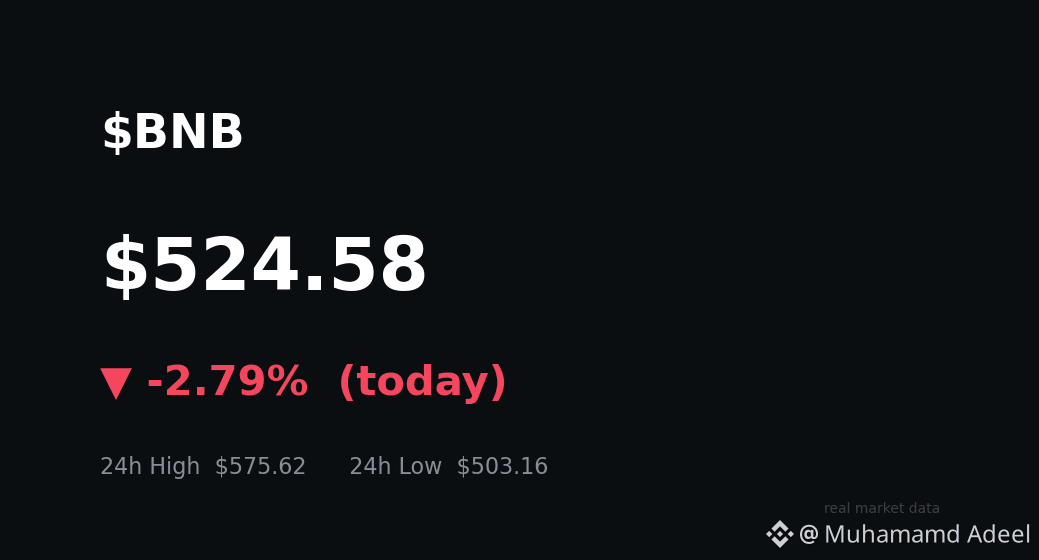
لامس $BNB مستوى $503 مع وصول الخوف إلى 12 — فهل يكون $500 مستوى نهاية الأسبوع؟مؤشر الخوف عند 12، و$BNB سجّل للتو $503.16. اختفى مستوى الدعم عند $566 الذي راقبه الجميع طوال الأسبوع — فهل يكون $500 هو المستوى الذي سيحسم نهاية هذا الأسبوع؟
لنكن صريحين بشأن ما حدث. يتداول BNB قرب $525، منخفضًا بنحو 8% خلال اليوم الماضي، وتراجع أكثر من السوق الأوسع. $BTC خسر $60K يوم الجمعة، ويقع قرب $58K، لذا فهذه ليست قصة تخص BNB وحده. لكن أداء BNB كان أضعف، وهذه الفجوة هي جوهر القصة.
إليك التناقض الذي لا يمكن لأحد تجاهله. لا يزال المتداولون يميلون إلى الشراء رغم الضعف — نحو 70% من الحسابات في مراكز شراء، بينما تتراجع الفائدة المفتوحة وتطغى تصفيات مراكز الشراء. مؤشر RSI قرب 19، في منطقة تشبع بيعي عميق، والسعر دون كل المتوسطات المتحركة الرئيسية. قد يرتد السعر من التشبع البيعي، وقد يبقى في هذه المنطقة أيضًا. أي الاحتمالين تراهن عليه؟
لامس $BNB مستوى $503 مع وصول الخوف إلى 12 — فهل يكون $500 مستوى نهاية الأسبوع؟
مؤشر الخوف عند 12، و$BNB سجّل للتو $503.16. اختفى مستوى الدعم عند $566 الذي راقبه الجميع طوال الأسبوع — فهل يكون $500 هو المستوى الذي سيحسم نهاية هذا الأسبوع؟
لنكن صريحين بشأن ما حدث. يتداول BNB قرب $525، منخفضًا بنحو 8% خلال اليوم الماضي، وتراجع أكثر من السوق الأوسع. $BTC خسر $60K يوم الجمعة، ويقع قرب $58K، لذا فهذه ليست قصة تخص BNB وحده. لكن أداء BNB كان أضعف، وهذه الفجوة هي جوهر القصة.
إليك التناقض الذي لا يمكن لأحد تجاهله. لا يزال المتداولون يميلون إلى الشراء رغم الضعف — نحو 70% من الحسابات في مراكز شراء، بينما تتراجع الفائدة المفتوحة وتطغى تصفيات مراكز الشراء. مؤشر RSI قرب 19، في منطقة تشبع بيعي عميق، والسعر دون كل المتوسطات المتحركة الرئيسية. قد يرتد السعر من التشبع البيعي، وقد يبقى في هذه المنطقة أيضًا. أي الاحتمالين تراهن عليه؟
لنكن صريحين بشأن ما حدث. يتداول BNB قرب $525، منخفضًا بنحو 8% خلال اليوم الماضي، وتراجع أكثر من السوق الأوسع. $BTC خسر $60K يوم الجمعة، ويقع قرب $58K، لذا فهذه ليست قصة تخص BNB وحده. لكن أداء BNB كان أضعف، وهذه الفجوة هي جوهر القصة.
إليك التناقض الذي لا يمكن لأحد تجاهله. لا يزال المتداولون يميلون إلى الشراء رغم الضعف — نحو 70% من الحسابات في مراكز شراء، بينما تتراجع الفائدة المفتوحة وتطغى تصفيات مراكز الشراء. مؤشر RSI قرب 19، في منطقة تشبع بيعي عميق، والسعر دون كل المتوسطات المتحركة الرئيسية. قد يرتد السعر من التشبع البيعي، وقد يبقى في هذه المنطقة أيضًا. أي الاحتمالين تراهن عليه؟
5
مقالة
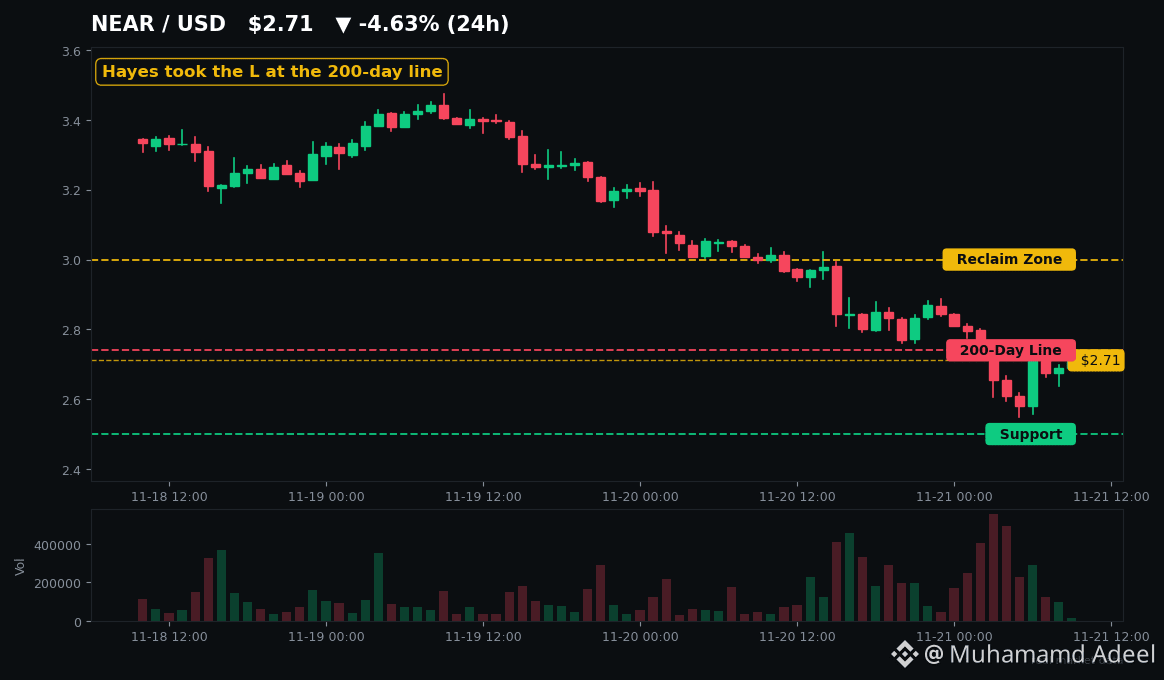
هايز قال إن $NEAR ستصل إلى 6 دولارات. بعد أربعة أيام فقط تلقّى الضربة.قبل أربعة أيام قال آرثر هايز إن $NEAR ستصل إلى 6 دولارات. واليوم يقول إنه تلقّى الضربة.
هكذا يُذلّ هذا السوق الناس بسرعة. والرسوم البيانية فعلت للتو شيئًا لم تفعله منذ ثلاثة أشهر.
**ما الذي حدث للتو**
$NEAR يتداول حول 2.71 دولار، منخفضًا بنحو 11% خلال 24 ساعة وحوالي 49% خلال شهر. لقد هبط للتو دون متوسطه المتحرك لـ200 يوم عند 2.74 دولار — وهو أول اختبار لهذا الخط بعد 94 جلسة متتالية فوقه. ويقع متوسط الـ50 يومًا أعلى بكثير عند 4.33 دولار. مؤشر القوة النسبية اليومي يقترب من 29، أي في منطقة تشبع بيعي عميق.
هايز قال إن $NEAR ستصل إلى 6 دولارات. بعد أربعة أيام فقط تلقّى الضربة.
قبل أربعة أيام قال آرثر هايز إن $NEAR ستصل إلى 6 دولارات. واليوم يقول إنه تلقّى الضربة.
هكذا يُذلّ هذا السوق الناس بسرعة. والرسوم البيانية فعلت للتو شيئًا لم تفعله منذ ثلاثة أشهر.
**ما الذي حدث للتو**
$NEAR يتداول حول 2.71 دولار، منخفضًا بنحو 11% خلال 24 ساعة وحوالي 49% خلال شهر. لقد هبط للتو دون متوسطه المتحرك لـ200 يوم عند 2.74 دولار — وهو أول اختبار لهذا الخط بعد 94 جلسة متتالية فوقه. ويقع متوسط الـ50 يومًا أعلى بكثير عند 4.33 دولار. مؤشر القوة النسبية اليومي يقترب من 29، أي في منطقة تشبع بيعي عميق.
هكذا يُذلّ هذا السوق الناس بسرعة. والرسوم البيانية فعلت للتو شيئًا لم تفعله منذ ثلاثة أشهر.
**ما الذي حدث للتو**
$NEAR يتداول حول 2.71 دولار، منخفضًا بنحو 11% خلال 24 ساعة وحوالي 49% خلال شهر. لقد هبط للتو دون متوسطه المتحرك لـ200 يوم عند 2.74 دولار — وهو أول اختبار لهذا الخط بعد 94 جلسة متتالية فوقه. ويقع متوسط الـ50 يومًا أعلى بكثير عند 4.33 دولار. مؤشر القوة النسبية اليومي يقترب من 29، أي في منطقة تشبع بيعي عميق.
6
مقالة
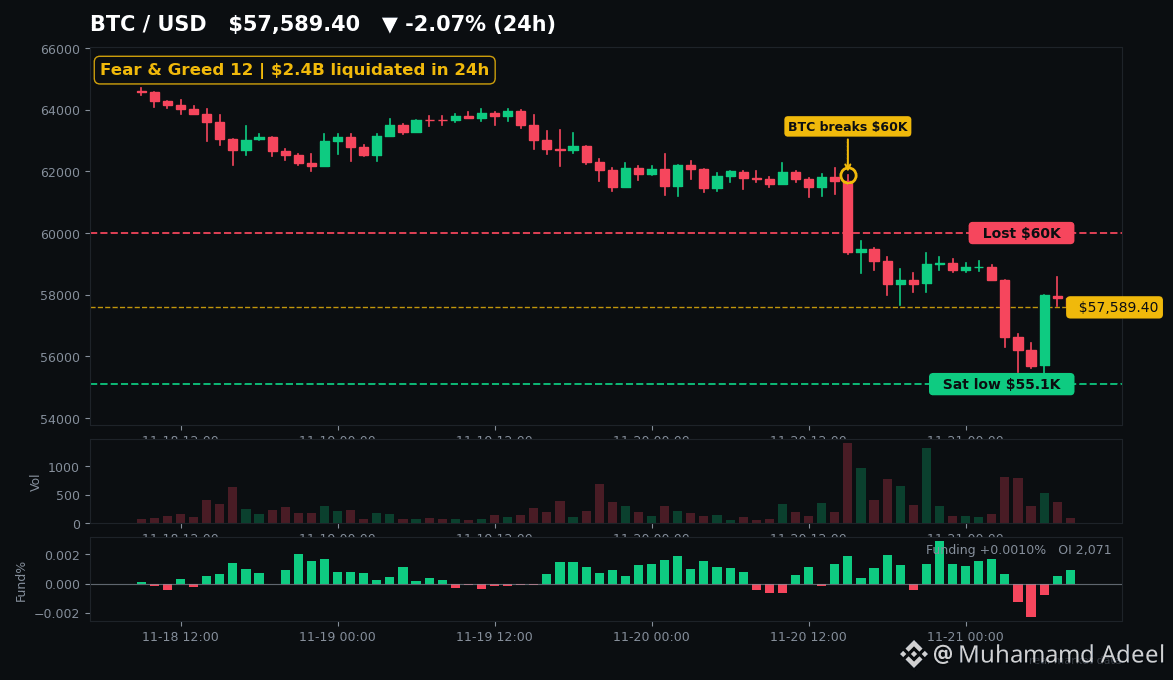
تصفية 2.4 مليار دولار، وBTC يلامس 55 ألف دولار — مؤشر الخوف عند 12مُحيت رهانات برافعة مالية بقيمة 2.4 مليار دولار خلال 24 ساعة. هبط سعر Bitcoin إلى 55,100 دولار هذا الصباح — وهو أدنى سعر له منذ سبتمبر 2024. انقر على $BTC وألقِ نظرة بنفسك على ذلك الذيل.
**التصفية الجماعية**
يتذبذب BTC قرب 57,600 دولار أثناء كتابتي، لكن الضرر وقع بالفعل: تُحصي CoinGlass تصفية مراكز بقيمة 2.40 مليار دولار خلال 24 ساعة — أكثر من مليار دولار في BTC وحده، و545 مليون دولار في ETH، وكانت أكبر ضربة منفردة تصفية مركز شراء بقيمة 51.7 مليون دولار. يبلغ مؤشر الخوف والطمع 12 (alternative.me)، في اليوم التاسع على التوالي من الخوف الشديد. إليك ما يعنيه هذا حقًا: الرافعة المالية انتهت للتو. انخفضت الفائدة المفتوحة بينما قفز حجم التداول — وهذا يعني تصفية مراكز الشراء، لا تكدّس مراكز بيع جديدة. تنهي موجات التصفية مشكلة الرافعة المالية. لكنها لا تنهي البيع الفوري.
تصفية 2.4 مليار دولار، وBTC يلامس 55 ألف دولار — مؤشر الخوف عند 12
مُحيت رهانات برافعة مالية بقيمة 2.4 مليار دولار خلال 24 ساعة. هبط سعر Bitcoin إلى 55,100 دولار هذا الصباح — وهو أدنى سعر له منذ سبتمبر 2024. انقر على $BTC وألقِ نظرة بنفسك على ذلك الذيل.
**التصفية الجماعية**
يتذبذب BTC قرب 57,600 دولار أثناء كتابتي، لكن الضرر وقع بالفعل: تُحصي CoinGlass تصفية مراكز بقيمة 2.40 مليار دولار خلال 24 ساعة — أكثر من مليار دولار في BTC وحده، و545 مليون دولار في ETH، وكانت أكبر ضربة منفردة تصفية مركز شراء بقيمة 51.7 مليون دولار. يبلغ مؤشر الخوف والطمع 12 (alternative.me)، في اليوم التاسع على التوالي من الخوف الشديد. إليك ما يعنيه هذا حقًا: الرافعة المالية انتهت للتو. انخفضت الفائدة المفتوحة بينما قفز حجم التداول — وهذا يعني تصفية مراكز الشراء، لا تكدّس مراكز بيع جديدة. تنهي موجات التصفية مشكلة الرافعة المالية. لكنها لا تنهي البيع الفوري.
**التصفية الجماعية**
يتذبذب BTC قرب 57,600 دولار أثناء كتابتي، لكن الضرر وقع بالفعل: تُحصي CoinGlass تصفية مراكز بقيمة 2.40 مليار دولار خلال 24 ساعة — أكثر من مليار دولار في BTC وحده، و545 مليون دولار في ETH، وكانت أكبر ضربة منفردة تصفية مركز شراء بقيمة 51.7 مليون دولار. يبلغ مؤشر الخوف والطمع 12 (alternative.me)، في اليوم التاسع على التوالي من الخوف الشديد. إليك ما يعنيه هذا حقًا: الرافعة المالية انتهت للتو. انخفضت الفائدة المفتوحة بينما قفز حجم التداول — وهذا يعني تصفية مراكز الشراء، لا تكدّس مراكز بيع جديدة. تنهي موجات التصفية مشكلة الرافعة المالية. لكنها لا تنهي البيع الفوري.
3
مقالة
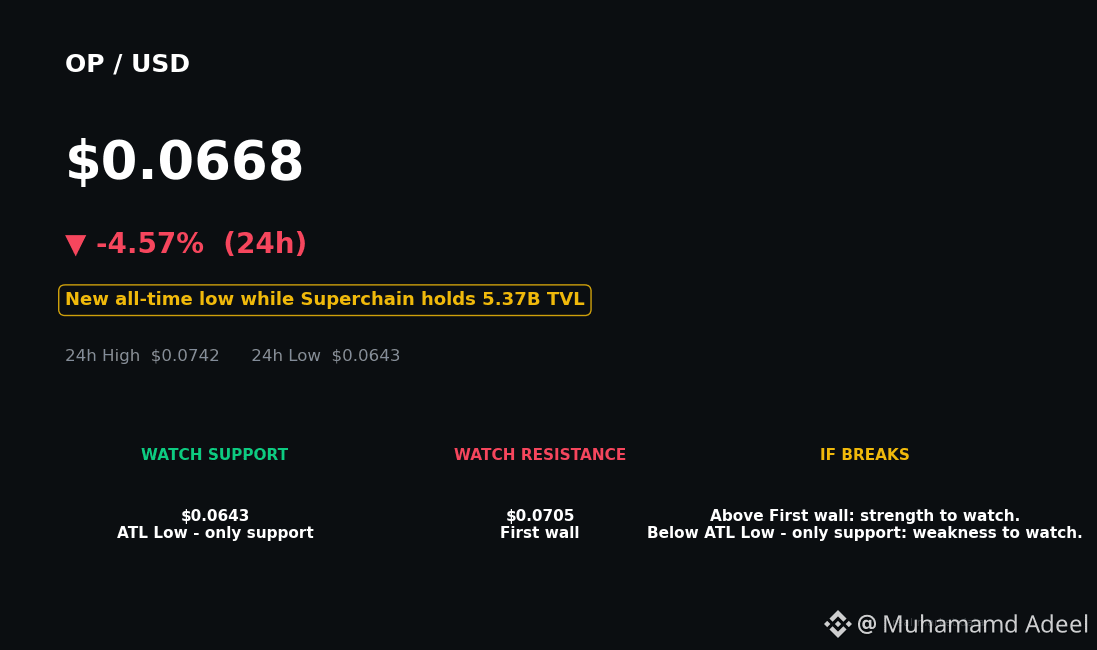
$OP عند أدنى مستوى له على الإطلاق — بينما تحتفظ Superchain بـ5.3 مليار دولار$OP سجّل للتو أدنى مستوى له على الإطلاق عند 0.0643 دولار. لكن السلسلة التي يشغّلها لم يصلها الخبر.
هذه هي القصة كلها في سطر واحد. أصبح رمز Optimism الآن منخفضًا بنسبة 98.6% عن ذروته البالغة 4.84 دولار في مارس 2024، ويتداول قرب 0.067 دولار، فيما يبلغ مؤشر الخوف والطمع 12. وفي الوقت نفسه، لا تزال Superchain تحتفظ بنحو 5.37 مليار دولار من القيمة الإجمالية المقفلة في التمويل اللامركزي عبر 33 سلسلة. واقعان مختلفان، ورمز واحد. أيهما تشتريه فعلًا؟
إليك المفاجأة التي لا يذكرها أحد في العنوان: معظم هذه الـ5.37 مليار دولار ليست على شبكة OP Mainnet. فشبكة Base وحدها تستحوذ على 4.43 مليار دولار منها. أما OP Mainnet نفسها، فتبلغ القيمة الإجمالية المقفلة في التمويل اللامركزي فيها نحو 359 مليون دولار، بانخفاض يقارب 18% خلال 30 يومًا. الإمبراطورية بخير، لكن عاصمتها تتقلص.
$OP عند أدنى مستوى له على الإطلاق — بينما تحتفظ Superchain بـ5.3 مليار دولار
$OP سجّل للتو أدنى مستوى له على الإطلاق عند 0.0643 دولار. لكن السلسلة التي يشغّلها لم يصلها الخبر.
هذه هي القصة كلها في سطر واحد. أصبح رمز Optimism الآن منخفضًا بنسبة 98.6% عن ذروته البالغة 4.84 دولار في مارس 2024، ويتداول قرب 0.067 دولار، فيما يبلغ مؤشر الخوف والطمع 12. وفي الوقت نفسه، لا تزال Superchain تحتفظ بنحو 5.37 مليار دولار من القيمة الإجمالية المقفلة في التمويل اللامركزي عبر 33 سلسلة. واقعان مختلفان، ورمز واحد. أيهما تشتريه فعلًا؟
إليك المفاجأة التي لا يذكرها أحد في العنوان: معظم هذه الـ5.37 مليار دولار ليست على شبكة OP Mainnet. فشبكة Base وحدها تستحوذ على 4.43 مليار دولار منها. أما OP Mainnet نفسها، فتبلغ القيمة الإجمالية المقفلة في التمويل اللامركزي فيها نحو 359 مليون دولار، بانخفاض يقارب 18% خلال 30 يومًا. الإمبراطورية بخير، لكن عاصمتها تتقلص.
هذه هي القصة كلها في سطر واحد. أصبح رمز Optimism الآن منخفضًا بنسبة 98.6% عن ذروته البالغة 4.84 دولار في مارس 2024، ويتداول قرب 0.067 دولار، فيما يبلغ مؤشر الخوف والطمع 12. وفي الوقت نفسه، لا تزال Superchain تحتفظ بنحو 5.37 مليار دولار من القيمة الإجمالية المقفلة في التمويل اللامركزي عبر 33 سلسلة. واقعان مختلفان، ورمز واحد. أيهما تشتريه فعلًا؟
إليك المفاجأة التي لا يذكرها أحد في العنوان: معظم هذه الـ5.37 مليار دولار ليست على شبكة OP Mainnet. فشبكة Base وحدها تستحوذ على 4.43 مليار دولار منها. أما OP Mainnet نفسها، فتبلغ القيمة الإجمالية المقفلة في التمويل اللامركزي فيها نحو 359 مليون دولار، بانخفاض يقارب 18% خلال 30 يومًا. الإمبراطورية بخير، لكن عاصمتها تتقلص.
16
مقالة
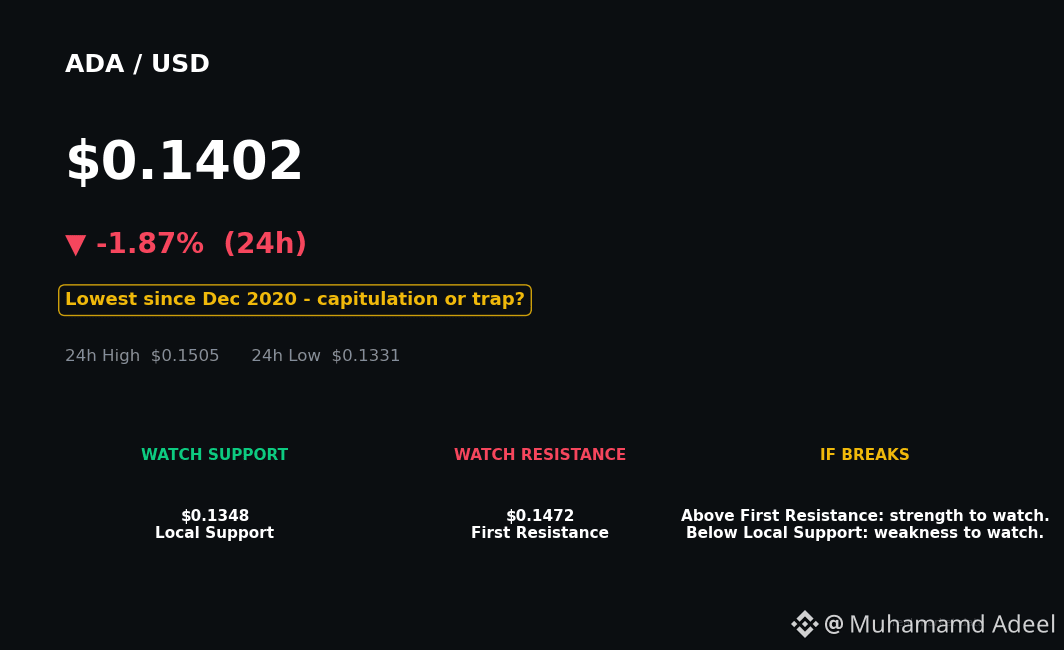
الخوف عند 12، و$ADA عند 0.14 دولار: استسلام أم فخّ للقيمة؟بلغ مؤشر الخوف والطمع 12 — مع تسعة أيام متتالية من الخوف الشديد. وقد $ADA سجّل للتو 0.14 دولار، وهو أدنى مستوى له منذ ديسمبر 2020.
تراجعت كاردانو بنسبة 95% عن أعلى مستوى لها على الإطلاق عند 3.09 دولارات. والأسوأ من ذلك: أنها كسرت للتو مستوى الدعم عند 0.22–0.24 دولار، الذي صمد طوال السوق الهابطة بين عامي 2022 و2023. نحن أمام منطقة جديدة — أدنى بنسبة 42% من قاع السوق الهابطة السابقة.
والتوقيت سيئ للغاية. فقد دخل المؤسس تشارلز هوسكينسون هذا الأسبوع في خلاف علني مع مؤسسته على X — وتغيّب عن جلسة «اسألني أي شيء» التي نظّمتها، واتهمها بالكذب بشأن المساءلة، وقال إن عمله على كاردانو قد انتهى. وردّ رئيسها التنفيذي: «لا يحق لأي فرد بمفرده أن يقرر متى ينتهي أمر كاردانو». وفي الوقت نفسه، ستتوقف DJED، العملة المستقرة الأبرز في كاردانو، عن العمل في 31 ديسمبر، كما تخلّصت الحيتان من نحو 50 مليون ADA بين 4 و10 نوفمبر، بحسب Santiment.
الخوف عند 12، و$ADA عند 0.14 دولار: استسلام أم فخّ للقيمة؟
بلغ مؤشر الخوف والطمع 12 — مع تسعة أيام متتالية من الخوف الشديد. وقد $ADA سجّل للتو 0.14 دولار، وهو أدنى مستوى له منذ ديسمبر 2020.
تراجعت كاردانو بنسبة 95% عن أعلى مستوى لها على الإطلاق عند 3.09 دولارات. والأسوأ من ذلك: أنها كسرت للتو مستوى الدعم عند 0.22–0.24 دولار، الذي صمد طوال السوق الهابطة بين عامي 2022 و2023. نحن أمام منطقة جديدة — أدنى بنسبة 42% من قاع السوق الهابطة السابقة.
والتوقيت سيئ للغاية. فقد دخل المؤسس تشارلز هوسكينسون هذا الأسبوع في خلاف علني مع مؤسسته على X — وتغيّب عن جلسة «اسألني أي شيء» التي نظّمتها، واتهمها بالكذب بشأن المساءلة، وقال إن عمله على كاردانو قد انتهى. وردّ رئيسها التنفيذي: «لا يحق لأي فرد بمفرده أن يقرر متى ينتهي أمر كاردانو». وفي الوقت نفسه، ستتوقف DJED، العملة المستقرة الأبرز في كاردانو، عن العمل في 31 ديسمبر، كما تخلّصت الحيتان من نحو 50 مليون ADA بين 4 و10 نوفمبر، بحسب Santiment.
تراجعت كاردانو بنسبة 95% عن أعلى مستوى لها على الإطلاق عند 3.09 دولارات. والأسوأ من ذلك: أنها كسرت للتو مستوى الدعم عند 0.22–0.24 دولار، الذي صمد طوال السوق الهابطة بين عامي 2022 و2023. نحن أمام منطقة جديدة — أدنى بنسبة 42% من قاع السوق الهابطة السابقة.
والتوقيت سيئ للغاية. فقد دخل المؤسس تشارلز هوسكينسون هذا الأسبوع في خلاف علني مع مؤسسته على X — وتغيّب عن جلسة «اسألني أي شيء» التي نظّمتها، واتهمها بالكذب بشأن المساءلة، وقال إن عمله على كاردانو قد انتهى. وردّ رئيسها التنفيذي: «لا يحق لأي فرد بمفرده أن يقرر متى ينتهي أمر كاردانو». وفي الوقت نفسه، ستتوقف DJED، العملة المستقرة الأبرز في كاردانو، عن العمل في 31 ديسمبر، كما تخلّصت الحيتان من نحو 50 مليون ADA بين 4 و10 نوفمبر، بحسب Santiment.
37
مقالة
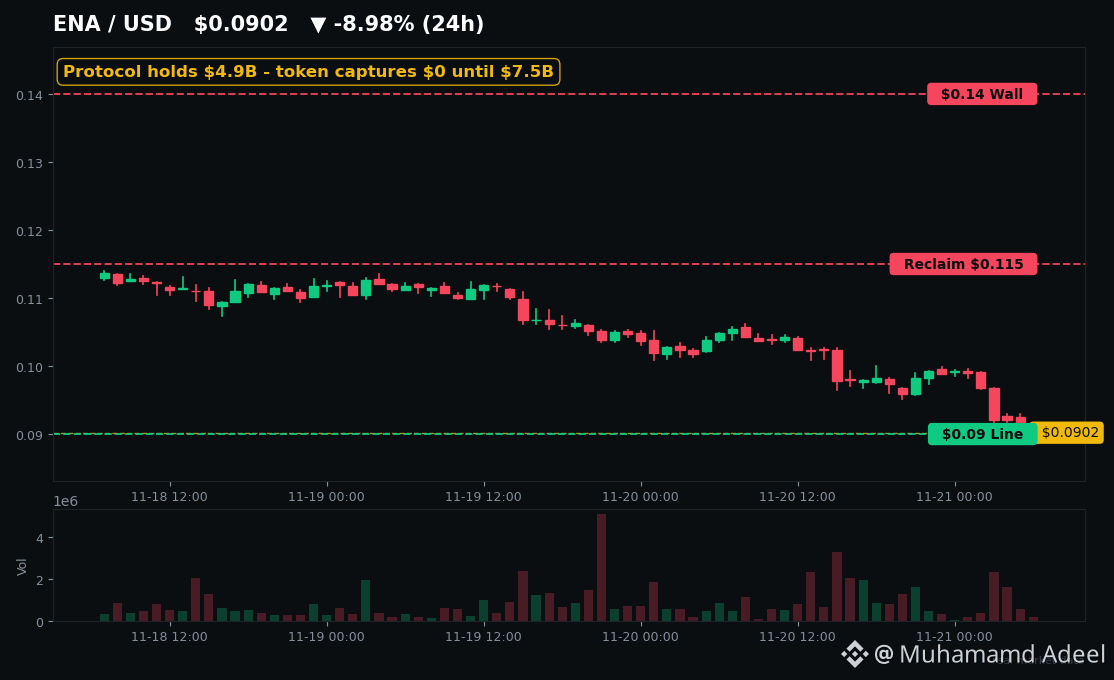
انخفض ENA بنسبة 55% خلال شهر. وما زال USDe يحتفظ بـ4.9 مليار دولار. ما الذي سينهار أولًا؟$BTC خسر للتو 60 ألف دولار، ومؤشر الخوف والطمع عند 12، و$ENA منخفض بنسبة 55% خلال شهر. لكن العملة الاصطناعية المستقرة من Ethena، البالغة قيمتها 4.9 مليار دولار، لا تزال عند 0.999 دولار. أحد هذين الأمرين يخدعك.
إليك التباين الذي لم يأخذه أحد في الحسبان. يُتداول ENA عند 0.0903 دولار — بانخفاض 13% خلال 24 ساعة، و31% خلال أسبوع، و94% عن أعلى مستوى له على الإطلاق عند 1.52 دولار في أبريل 2024. في المقابل، البروتوكول الذي يقف وراءه لا يتقلص: قيمة إجمالية مقفلة تبلغ 5.18 مليار دولار، ورسوم بقيمة 22.6 مليون دولار خلال آخر 30 يومًا، مع استقرار معروض USDe قرب 4.87 مليار دولار، واستمرار sUSDe في تقديم عائد يبلغ نحو 4.87%. بل إن Ethena أطلقت USDe وsUSDe على شبكة Stellar في 19 نوفمبر، في خضم الانهيار.
انخفض ENA بنسبة 55% خلال شهر. وما زال USDe يحتفظ بـ4.9 مليار دولار. ما الذي سينهار أولًا؟
$BTC خسر للتو 60 ألف دولار، ومؤشر الخوف والطمع عند 12، و$ENA منخفض بنسبة 55% خلال شهر. لكن العملة الاصطناعية المستقرة من Ethena، البالغة قيمتها 4.9 مليار دولار، لا تزال عند 0.999 دولار. أحد هذين الأمرين يخدعك.
إليك التباين الذي لم يأخذه أحد في الحسبان. يُتداول ENA عند 0.0903 دولار — بانخفاض 13% خلال 24 ساعة، و31% خلال أسبوع، و94% عن أعلى مستوى له على الإطلاق عند 1.52 دولار في أبريل 2024. في المقابل، البروتوكول الذي يقف وراءه لا يتقلص: قيمة إجمالية مقفلة تبلغ 5.18 مليار دولار، ورسوم بقيمة 22.6 مليون دولار خلال آخر 30 يومًا، مع استقرار معروض USDe قرب 4.87 مليار دولار، واستمرار sUSDe في تقديم عائد يبلغ نحو 4.87%. بل إن Ethena أطلقت USDe وsUSDe على شبكة Stellar في 19 نوفمبر، في خضم الانهيار.
إليك التباين الذي لم يأخذه أحد في الحسبان. يُتداول ENA عند 0.0903 دولار — بانخفاض 13% خلال 24 ساعة، و31% خلال أسبوع، و94% عن أعلى مستوى له على الإطلاق عند 1.52 دولار في أبريل 2024. في المقابل، البروتوكول الذي يقف وراءه لا يتقلص: قيمة إجمالية مقفلة تبلغ 5.18 مليار دولار، ورسوم بقيمة 22.6 مليون دولار خلال آخر 30 يومًا، مع استقرار معروض USDe قرب 4.87 مليار دولار، واستمرار sUSDe في تقديم عائد يبلغ نحو 4.87%. بل إن Ethena أطلقت USDe وsUSDe على شبكة Stellar في 19 نوفمبر، في خضم الانهيار.
42
مقالة
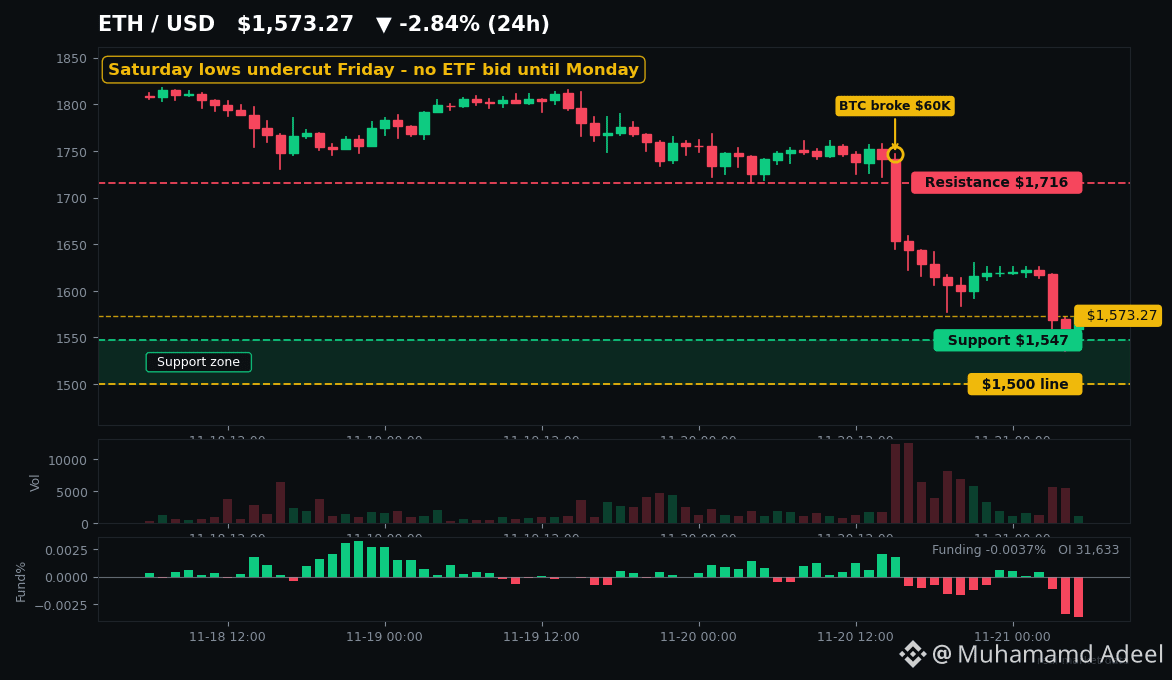
هبط BTC دون 60 ألف دولار يوم الجمعة. ولن يتوفر طلب من صناديق ETF لـETH حتى يوم الاثنين.$BTC خسر للتو مستوى 60 ألف دولار يوم الجمعة للمرة الأولى منذ يوليو.
والآن، $ETH يتداول طوال عطلة نهاية أسبوع كاملة من دون طلب من صناديق ETF حتى يوم الاثنين. فمن سيكون أول من يشتري؟
إليك ظروف التداول الفعلية لهذا الأسبوع.
**ما الذي حدث للتو**
لم يكن هبوط يوم الجمعة مقتصرًا على ETH، بل شمل العملات الكبرى عمومًا. على Kraken، أغلق BTC يوم الجمعة عند 58,806 دولارًا، وETH عند 1,619 دولارًا، ثم هبطت كل العملات الكبرى إلى ما دون أدنى مستوياتها يوم الجمعة مجددًا صباح السبت — وسجّل ETH حتى الآن 1,536 دولارًا يوم السبت، وBTC 55,480 دولارًا. وعند وقت النشر، بلغ سعر ETH 1,573 دولارًا. ويبلغ مؤشر الخوف والطمع (alternative.me) 12، أي «خوف شديد»، لليوم التاسع على التوالي.
هبط BTC دون 60 ألف دولار يوم الجمعة. ولن يتوفر طلب من صناديق ETF لـETH حتى يوم الاثنين.
$BTC خسر للتو مستوى 60 ألف دولار يوم الجمعة للمرة الأولى منذ يوليو.
والآن، $ETH يتداول طوال عطلة نهاية أسبوع كاملة من دون طلب من صناديق ETF حتى يوم الاثنين. فمن سيكون أول من يشتري؟
إليك ظروف التداول الفعلية لهذا الأسبوع.
**ما الذي حدث للتو**
لم يكن هبوط يوم الجمعة مقتصرًا على ETH، بل شمل العملات الكبرى عمومًا. على Kraken، أغلق BTC يوم الجمعة عند 58,806 دولارًا، وETH عند 1,619 دولارًا، ثم هبطت كل العملات الكبرى إلى ما دون أدنى مستوياتها يوم الجمعة مجددًا صباح السبت — وسجّل ETH حتى الآن 1,536 دولارًا يوم السبت، وBTC 55,480 دولارًا. وعند وقت النشر، بلغ سعر ETH 1,573 دولارًا. ويبلغ مؤشر الخوف والطمع (alternative.me) 12، أي «خوف شديد»، لليوم التاسع على التوالي.
والآن، $ETH يتداول طوال عطلة نهاية أسبوع كاملة من دون طلب من صناديق ETF حتى يوم الاثنين. فمن سيكون أول من يشتري؟
إليك ظروف التداول الفعلية لهذا الأسبوع.
**ما الذي حدث للتو**
لم يكن هبوط يوم الجمعة مقتصرًا على ETH، بل شمل العملات الكبرى عمومًا. على Kraken، أغلق BTC يوم الجمعة عند 58,806 دولارًا، وETH عند 1,619 دولارًا، ثم هبطت كل العملات الكبرى إلى ما دون أدنى مستوياتها يوم الجمعة مجددًا صباح السبت — وسجّل ETH حتى الآن 1,536 دولارًا يوم السبت، وBTC 55,480 دولارًا. وعند وقت النشر، بلغ سعر ETH 1,573 دولارًا. ويبلغ مؤشر الخوف والطمع (alternative.me) 12، أي «خوف شديد»، لليوم التاسع على التوالي.
47
مقالة
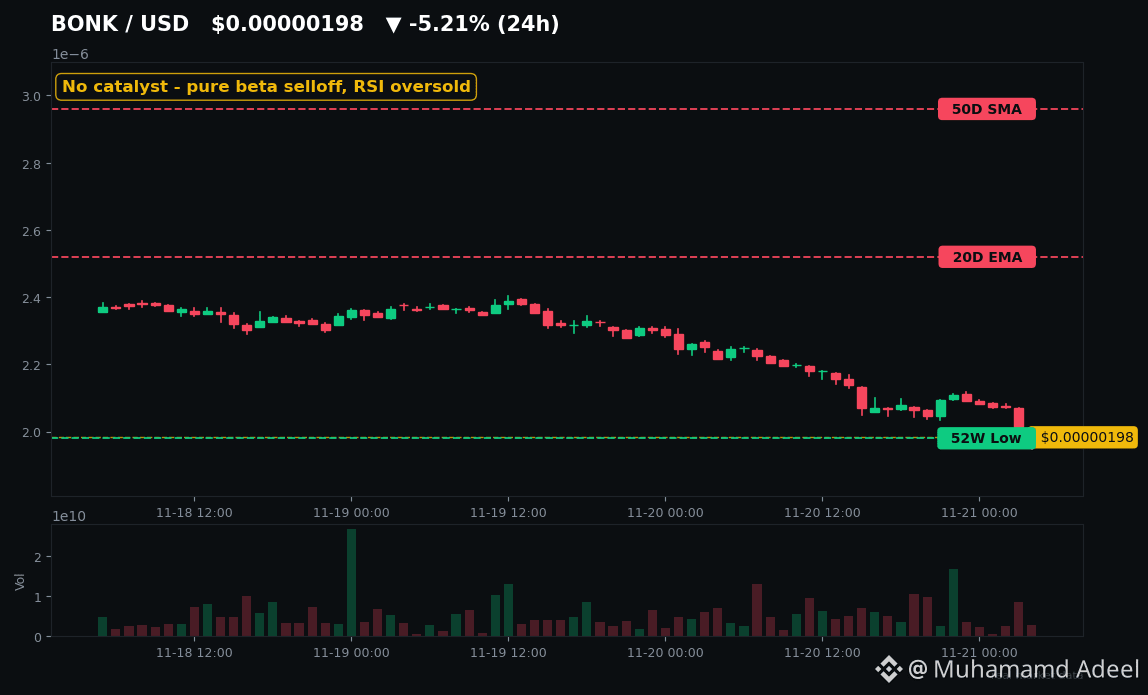
سجّلت $BONK للتو أدنى مستوى لها خلال 52 أسبوعًا دون أي أخبار سيئة — ارتداد أم انهيار؟$BONK سجلت للتو أدنى مستوى لها خلال 52 أسبوعًا — ولا يستطيع أحد الإشارة إلى خبر واحد عن BONK تسبب في ذلك.
هذه هي القصة كاملة. وهي أسوأ من مجرد أخبار سيئة.
إليك ما حدث بالفعل اليوم: $BONK هبط إلى نحو $0.0000020، بتراجع يقارب 9-10% خلال 24 ساعة وفقًا لأبرز منصات التتبع، ونحو 22% هذا الأسبوع. ولامس أدنى مستوى خلال اليوم $0.00000198. تبلغ القيمة السوقية الآن نحو 184 مليون دولار — بعد أن بلغت قيمة العملة نحو 4 مليارات دولار عند ذروتها في نوفمبر 2024، حين اقترب سعرها من $0.000058. أي أنها خسرت نحو 96% من قيمتها.
لم يحدث أي اختراق اليوم. ولم تُشطب العملة من أي منصة اليوم. ولم يُفتح أي قفل اليوم. ولم تجد منصات تتبع متعددة، عند مراجعة آخر 24 ساعة، أي محفز مؤكد خاص بـ BONK. جاء التراجع مواكبًا للسوق: $BTC هبطت بنحو 6%، وتراجع السوق ككل بنحو 5.9%، بعد ورود تقارير عن خروج 582 مليون دولار من صناديق بيتكوين المتداولة الفورية في الولايات المتحدة في 19 نوفمبر. لكن BONK هبطت بوتيرة أشد. وهذا ما يحدث عادةً — إذ يُظهر التاريخ أن BONK تضاعف إلى ثلاثة أمثال خسائر العملات الكبرى أثناء موجات البيع.
سجّلت $BONK للتو أدنى مستوى لها خلال 52 أسبوعًا دون أي أخبار سيئة — ارتداد أم انهيار؟
$BONK سجلت للتو أدنى مستوى لها خلال 52 أسبوعًا — ولا يستطيع أحد الإشارة إلى خبر واحد عن BONK تسبب في ذلك.
هذه هي القصة كاملة. وهي أسوأ من مجرد أخبار سيئة.
إليك ما حدث بالفعل اليوم: $BONK هبط إلى نحو $0.0000020، بتراجع يقارب 9-10% خلال 24 ساعة وفقًا لأبرز منصات التتبع، ونحو 22% هذا الأسبوع. ولامس أدنى مستوى خلال اليوم $0.00000198. تبلغ القيمة السوقية الآن نحو 184 مليون دولار — بعد أن بلغت قيمة العملة نحو 4 مليارات دولار عند ذروتها في نوفمبر 2024، حين اقترب سعرها من $0.000058. أي أنها خسرت نحو 96% من قيمتها.
لم يحدث أي اختراق اليوم. ولم تُشطب العملة من أي منصة اليوم. ولم يُفتح أي قفل اليوم. ولم تجد منصات تتبع متعددة، عند مراجعة آخر 24 ساعة، أي محفز مؤكد خاص بـ BONK. جاء التراجع مواكبًا للسوق: $BTC هبطت بنحو 6%، وتراجع السوق ككل بنحو 5.9%، بعد ورود تقارير عن خروج 582 مليون دولار من صناديق بيتكوين المتداولة الفورية في الولايات المتحدة في 19 نوفمبر. لكن BONK هبطت بوتيرة أشد. وهذا ما يحدث عادةً — إذ يُظهر التاريخ أن BONK تضاعف إلى ثلاثة أمثال خسائر العملات الكبرى أثناء موجات البيع.
هذه هي القصة كاملة. وهي أسوأ من مجرد أخبار سيئة.
إليك ما حدث بالفعل اليوم: $BONK هبط إلى نحو $0.0000020، بتراجع يقارب 9-10% خلال 24 ساعة وفقًا لأبرز منصات التتبع، ونحو 22% هذا الأسبوع. ولامس أدنى مستوى خلال اليوم $0.00000198. تبلغ القيمة السوقية الآن نحو 184 مليون دولار — بعد أن بلغت قيمة العملة نحو 4 مليارات دولار عند ذروتها في نوفمبر 2024، حين اقترب سعرها من $0.000058. أي أنها خسرت نحو 96% من قيمتها.
لم يحدث أي اختراق اليوم. ولم تُشطب العملة من أي منصة اليوم. ولم يُفتح أي قفل اليوم. ولم تجد منصات تتبع متعددة، عند مراجعة آخر 24 ساعة، أي محفز مؤكد خاص بـ BONK. جاء التراجع مواكبًا للسوق: $BTC هبطت بنحو 6%، وتراجع السوق ككل بنحو 5.9%، بعد ورود تقارير عن خروج 582 مليون دولار من صناديق بيتكوين المتداولة الفورية في الولايات المتحدة في 19 نوفمبر. لكن BONK هبطت بوتيرة أشد. وهذا ما يحدث عادةً — إذ يُظهر التاريخ أن BONK تضاعف إلى ثلاثة أمثال خسائر العملات الكبرى أثناء موجات البيع.
54
مقالة
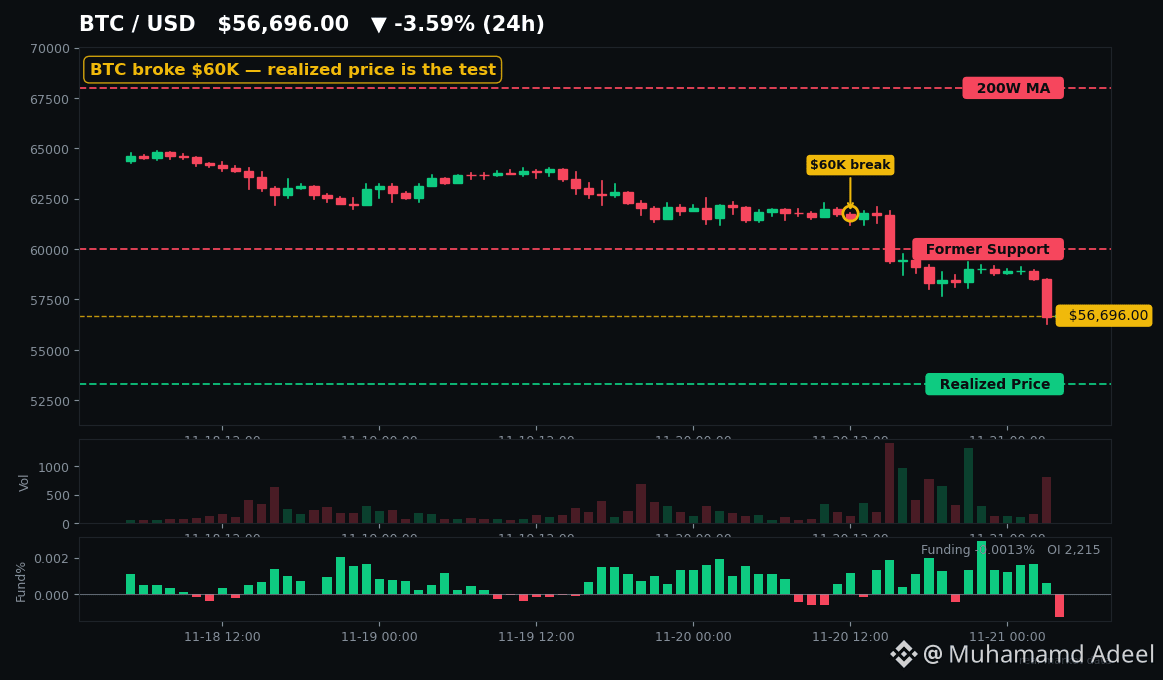
بيتكوين يكسر للتو حاجز 60 ألف دولار — والآن مستوى 53.3 ألف دولار هو الأهمودّعنا مستوى 60 ألف دولار.
$BTC سجّل للتو 56,666 دولارًا على Kraken — وبلغ أدنى مستوى خلال 24 ساعة 56,300 دولار، وهو الأدنى منذ سبتمبر 2024 — فيما يقف مؤشر الخوف والطمع عند 12، في عمق منطقة الخوف الشديد. ثمة مستوى واحد يفصل الآن بين الارتداد وإعادة ضبط كاملة. ولا يفصله عن السعر سوى نحو 3 آلاف دولار.
إليك ما تسبب في الانهيار. شهدت صناديق بيتكوين المتداولة الفورية في الولايات المتحدة خروج 582.3 مليون دولار في 19 نوفمبر وحده. وشكّل صندوق IBIT التابع لـBlackRock منها 541.1 مليون دولار، وهو أكبر تدفق يومي خارج للصندوق منذ إطلاقه. وبلغ إجمالي التدفقات الخارجة في نوفمبر حتى 19 نوفمبر 3.47 مليار دولار. أضف إلى ذلك هبوط أسهم التكنولوجيا، وتسعير الأسواق لاحتمال رفع الفيدرالي الفائدة في ديسمبر بنحو 93%، وتصفية مراكز بقيمة تتجاوز 1.5 مليار دولار خلال 24 ساعة عبر منصات التداول الكبرى — نحو 90% منها مراكز شراء — وستدرك أن مستوى 60 ألف دولار لم تكن لديه أي فرصة للصمود.
بيتكوين يكسر للتو حاجز 60 ألف دولار — والآن مستوى 53.3 ألف دولار هو الأهم
ودّعنا مستوى 60 ألف دولار.
$BTC سجّل للتو 56,666 دولارًا على Kraken — وبلغ أدنى مستوى خلال 24 ساعة 56,300 دولار، وهو الأدنى منذ سبتمبر 2024 — فيما يقف مؤشر الخوف والطمع عند 12، في عمق منطقة الخوف الشديد. ثمة مستوى واحد يفصل الآن بين الارتداد وإعادة ضبط كاملة. ولا يفصله عن السعر سوى نحو 3 آلاف دولار.
إليك ما تسبب في الانهيار. شهدت صناديق بيتكوين المتداولة الفورية في الولايات المتحدة خروج 582.3 مليون دولار في 19 نوفمبر وحده. وشكّل صندوق IBIT التابع لـBlackRock منها 541.1 مليون دولار، وهو أكبر تدفق يومي خارج للصندوق منذ إطلاقه. وبلغ إجمالي التدفقات الخارجة في نوفمبر حتى 19 نوفمبر 3.47 مليار دولار. أضف إلى ذلك هبوط أسهم التكنولوجيا، وتسعير الأسواق لاحتمال رفع الفيدرالي الفائدة في ديسمبر بنحو 93%، وتصفية مراكز بقيمة تتجاوز 1.5 مليار دولار خلال 24 ساعة عبر منصات التداول الكبرى — نحو 90% منها مراكز شراء — وستدرك أن مستوى 60 ألف دولار لم تكن لديه أي فرصة للصمود.
$BTC سجّل للتو 56,666 دولارًا على Kraken — وبلغ أدنى مستوى خلال 24 ساعة 56,300 دولار، وهو الأدنى منذ سبتمبر 2024 — فيما يقف مؤشر الخوف والطمع عند 12، في عمق منطقة الخوف الشديد. ثمة مستوى واحد يفصل الآن بين الارتداد وإعادة ضبط كاملة. ولا يفصله عن السعر سوى نحو 3 آلاف دولار.
إليك ما تسبب في الانهيار. شهدت صناديق بيتكوين المتداولة الفورية في الولايات المتحدة خروج 582.3 مليون دولار في 19 نوفمبر وحده. وشكّل صندوق IBIT التابع لـBlackRock منها 541.1 مليون دولار، وهو أكبر تدفق يومي خارج للصندوق منذ إطلاقه. وبلغ إجمالي التدفقات الخارجة في نوفمبر حتى 19 نوفمبر 3.47 مليار دولار. أضف إلى ذلك هبوط أسهم التكنولوجيا، وتسعير الأسواق لاحتمال رفع الفيدرالي الفائدة في ديسمبر بنحو 93%، وتصفية مراكز بقيمة تتجاوز 1.5 مليار دولار خلال 24 ساعة عبر منصات التداول الكبرى — نحو 90% منها مراكز شراء — وستدرك أن مستوى 60 ألف دولار لم تكن لديه أي فرصة للصمود.
68
سجّل الدخول لاستكشاف المزيد من المُحتوى
انضم إلى مُستخدمي العملات الرقمية حول العالم على Binance Square
⚡️ احصل على أحدث المعلومات المفيدة عن العملات الرقمية.
💬 موثوقة من قبل أكبر منصّة لتداول العملات الرقمية في العالم.
👍 اكتشف الرؤى الحقيقية من صنّاع المُحتوى الموثوقين.
البريد الإلكتروني / رقم الهاتف
المواضيع الرائجة
BTCReboundsAbove$60KAmidWhaleDipBuying
3,590 مشاهدات
43 يقومون بالنقاش
Abraxas Capital وحيتان أخرى يشترون هبوط BTC مع استعادة بيتكوين مستوى 60,000 دولار لفترة وجيزة
Binance News
·12 إعجاب
·10.9k مشاهدات
NvidiaLoses$2.7TrillionInMonthAndAHalf
41,523 مشاهدات
201 يقومون بالنقاش
GlobalStocksFaceLongestLosingStreakSince2023
386,412 مشاهدات
2,541 يقومون بالنقاش