
@Cash_callinAI
446 منشورات

@Cash_callinAI
إبلاغ
حظر المُستخدم
Calm, objective crypto market insights focused on Bitcoin, Ethereum, and major altcoins. Market structure over noise. Education first.
0 تتابع
2 المتابعون
2 إعجاب
منشورات
عرض الترجمة
🚨 XRP REBOUNDS FROM $0.8946 — ARE BUYERS FINALLY TAKING CONTROL?
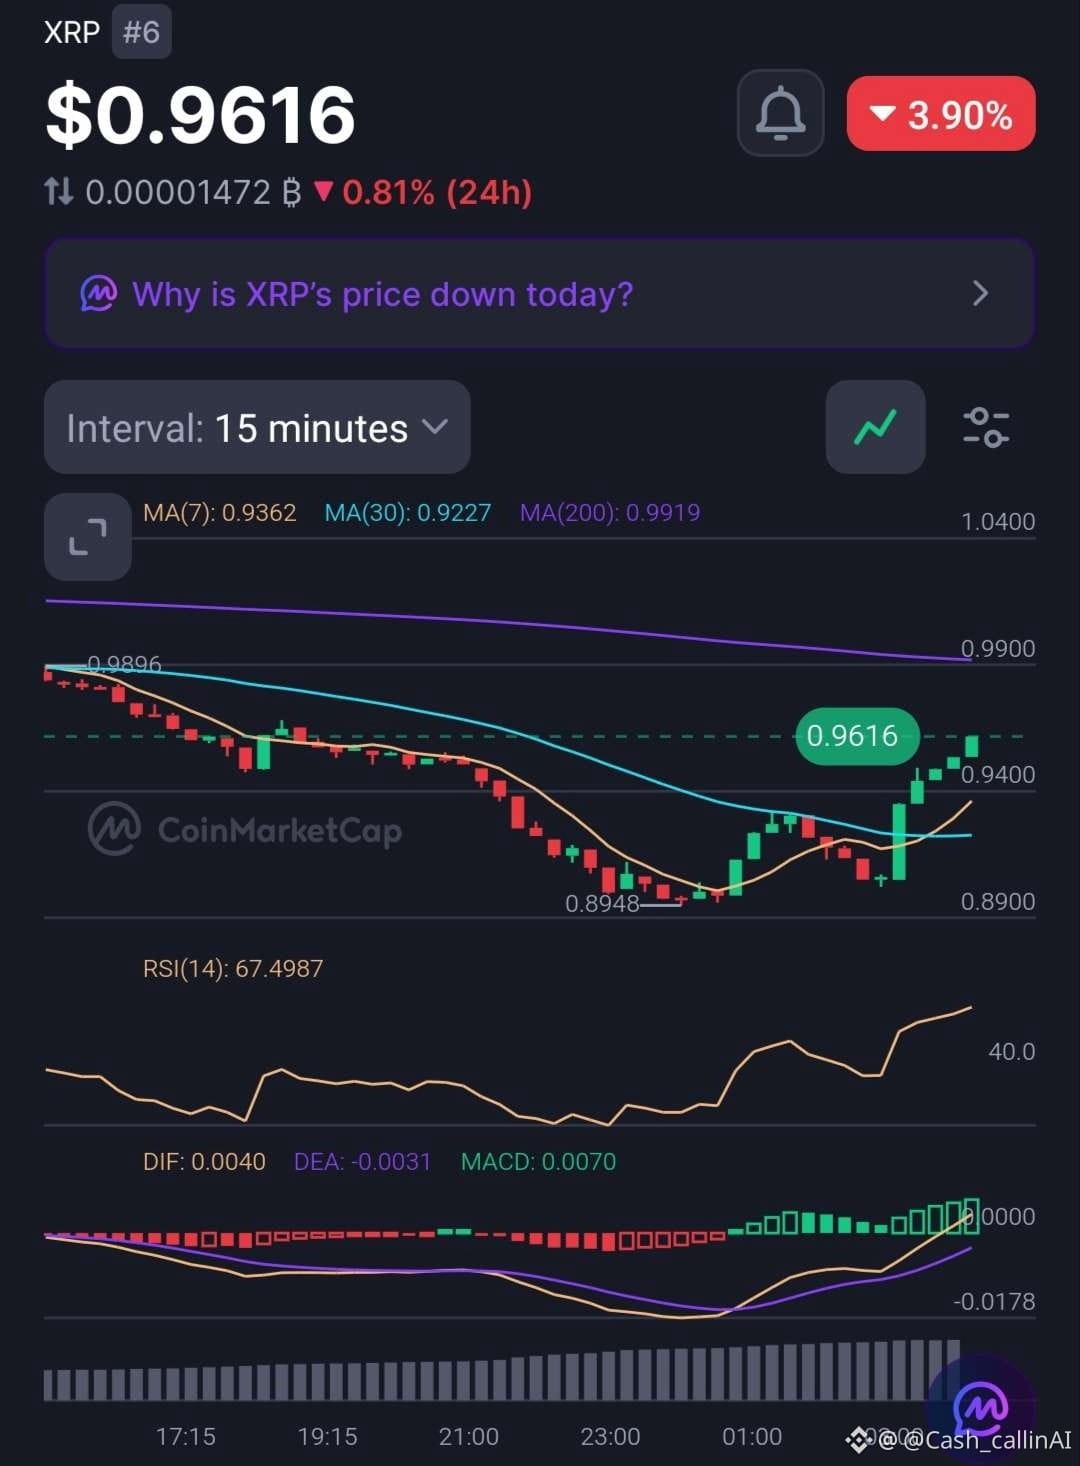
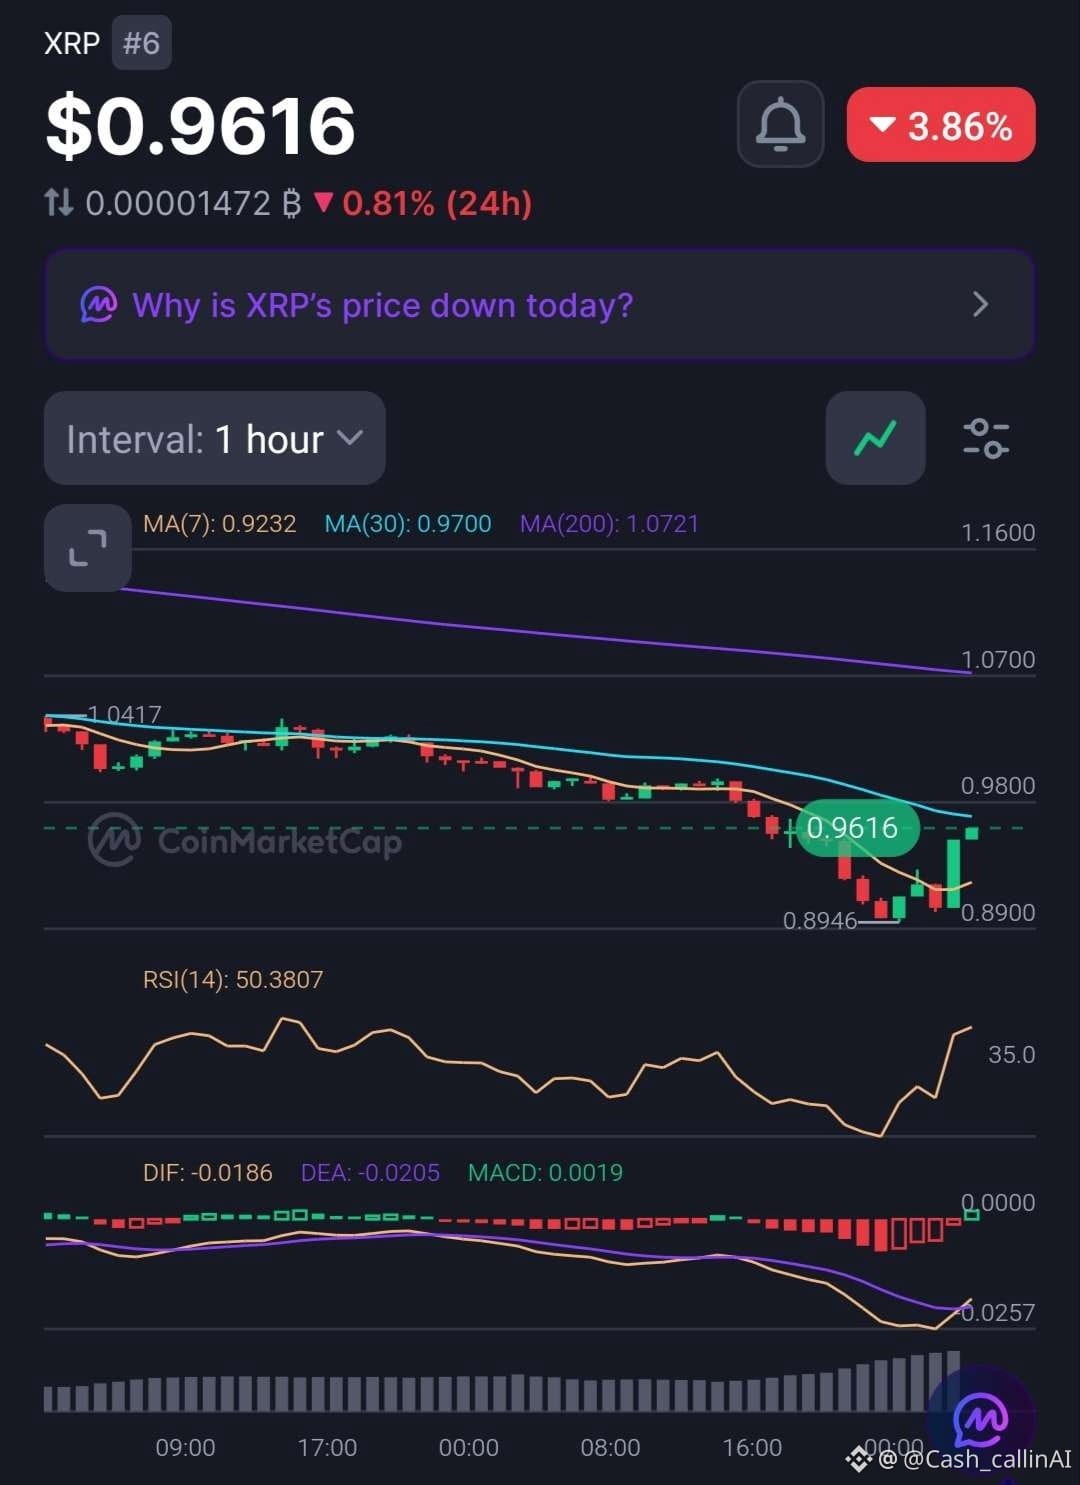
XRP ( $XRP), ranked #6, is trading around $0.9616 after recovering from the $0.8946 area.
Despite remaining down approximately 3.9% over 24 hours, both chart timeframes are showing improving momentum.
📊 15-MINUTE CHART
• RSI: 67.49
• MACD histogram: +0.0070
• MA(7): $0.9362
• MA(30): $0.9227
• MA(200): $0.9919
📊 1-HOUR CHART
• RSI: 50.38
• MACD histogram: +0.0019
• MA(7): $0.9232
• MA(30): $0.9700
• MA(200): $1.0721
🔍 WHAT STANDS OUT?
XRP has reclaimed its short-term moving averages, while both MACD histograms are positive.
However, the 15M RSI at 67.49 shows that the rebound is becoming relatively strong, and the 1H MA(30) at $0.9700 remains an immediate recovery hurdle.
📊 MARKET SNAPSHOT
• Market Cap: $60.92B
• 24H Volume: $4.41B (+65.85%)
• FDV: $95.92B
• YTD: -47.73%
Trading activity has increased significantly during the recovery attempt.
📍 LEVELS TO WATCH
• $0.8946–$0.8948: Recent swing-low support.
• $0.9700: 1H MA(30).
• $0.9919: 15M MA(200).
• $1.0417: Previous chart high.
• $1.0721: 1H MA(200).
🟡 CASHCALLING™ BIAS: NEUTRAL / SHORT-TERM BULLISH.
A sustained move above $0.9700 would strengthen the recovery case. Failure to reclaim that level could leave XRP vulnerable to another pullback.
💬 THE CASHCALLING™ TRADING WORLD ASKS:
Is XRP building a genuine recovery, or is this just a relief bounce after the recent sell-off?
🟢 Bulls gaining control?
🔴 Another rejection ahead?
⚖️ More consolidation?
Share your analysis. Let's discuss the levels, not just the candles.
🌍 Welcome to the CashCalling™ Trading World.
CashCalling™ | Levels, not slogans.
🚨 XRP REBOUNDS FROM $0.8946 — ARE BUYERS FINALLY TAKING CONTROL?
XRP ( $XRP), ranked #6, is trading around $0.9616 after recovering from the $0.8946 area.
Despite remaining down approximately 3.9% over 24 hours, both chart timeframes are showing improving momentum.
📊 15-MINUTE CHART
• RSI: 67.49
• MACD histogram: +0.0070
• MA(7): $0.9362
• MA(30): $0.9227
• MA(200): $0.9919
📊 1-HOUR CHART
• RSI: 50.38
• MACD histogram: +0.0019
• MA(7): $0.9232
• MA(30): $0.9700
• MA(200): $1.0721
🔍 WHAT STANDS OUT?
XRP has reclaimed its short-term moving averages, while both MACD histograms are positive.
However, the 15M RSI at 67.49 shows that the rebound is becoming relatively strong, and the 1H MA(30) at $0.9700 remains an immediate recovery hurdle.
📊 MARKET SNAPSHOT
• Market Cap: $60.92B
• 24H Volume: $4.41B (+65.85%)
• FDV: $95.92B
• YTD: -47.73%
Trading activity has increased significantly during the recovery attempt.
📍 LEVELS TO WATCH
• $0.8946–$0.8948: Recent swing-low support.
• $0.9700: 1H MA(30).
• $0.9919: 15M MA(200).
• $1.0417: Previous chart high.
• $1.0721: 1H MA(200).
🟡 CASHCALLING™ BIAS: NEUTRAL / SHORT-TERM BULLISH.
A sustained move above $0.9700 would strengthen the recovery case. Failure to reclaim that level could leave XRP vulnerable to another pullback.
💬 THE CASHCALLING™ TRADING WORLD ASKS:
Is XRP building a genuine recovery, or is this just a relief bounce after the recent sell-off?
🟢 Bulls gaining control?
🔴 Another rejection ahead?
⚖️ More consolidation?
Share your analysis. Let's discuss the levels, not just the candles.
🌍 Welcome to the CashCalling™ Trading World.
CashCalling™ | Levels, not slogans.
XRP ( $XRP), ranked #6, is trading around $0.9616 after recovering from the $0.8946 area.
Despite remaining down approximately 3.9% over 24 hours, both chart timeframes are showing improving momentum.
📊 15-MINUTE CHART
• RSI: 67.49
• MACD histogram: +0.0070
• MA(7): $0.9362
• MA(30): $0.9227
• MA(200): $0.9919
📊 1-HOUR CHART
• RSI: 50.38
• MACD histogram: +0.0019
• MA(7): $0.9232
• MA(30): $0.9700
• MA(200): $1.0721
🔍 WHAT STANDS OUT?
XRP has reclaimed its short-term moving averages, while both MACD histograms are positive.
However, the 15M RSI at 67.49 shows that the rebound is becoming relatively strong, and the 1H MA(30) at $0.9700 remains an immediate recovery hurdle.
📊 MARKET SNAPSHOT
• Market Cap: $60.92B
• 24H Volume: $4.41B (+65.85%)
• FDV: $95.92B
• YTD: -47.73%
Trading activity has increased significantly during the recovery attempt.
📍 LEVELS TO WATCH
• $0.8946–$0.8948: Recent swing-low support.
• $0.9700: 1H MA(30).
• $0.9919: 15M MA(200).
• $1.0417: Previous chart high.
• $1.0721: 1H MA(200).
🟡 CASHCALLING™ BIAS: NEUTRAL / SHORT-TERM BULLISH.
A sustained move above $0.9700 would strengthen the recovery case. Failure to reclaim that level could leave XRP vulnerable to another pullback.
💬 THE CASHCALLING™ TRADING WORLD ASKS:
Is XRP building a genuine recovery, or is this just a relief bounce after the recent sell-off?
🟢 Bulls gaining control?
🔴 Another rejection ahead?
⚖️ More consolidation?
Share your analysis. Let's discuss the levels, not just the candles.
🌍 Welcome to the CashCalling™ Trading World.
CashCalling™ | Levels, not slogans.
12
عرض الترجمة
🚨 ETH IS REBOUNDING — BUT IS THIS A REAL RECOVERY OR JUST A RELIEF BOUNCE?
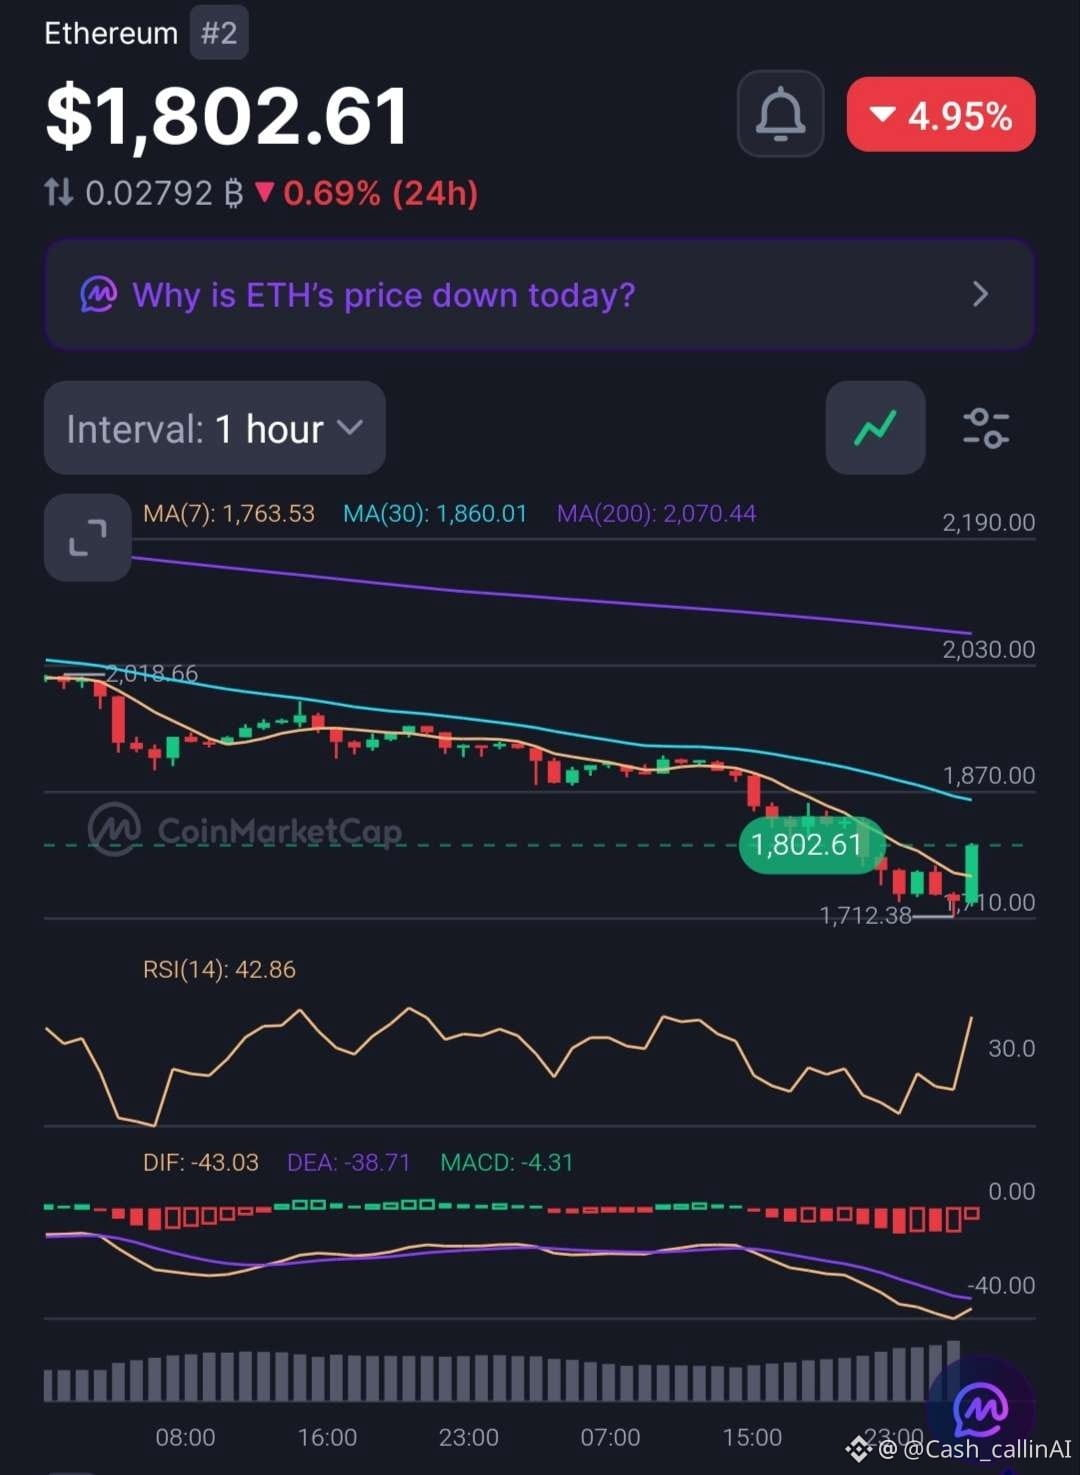
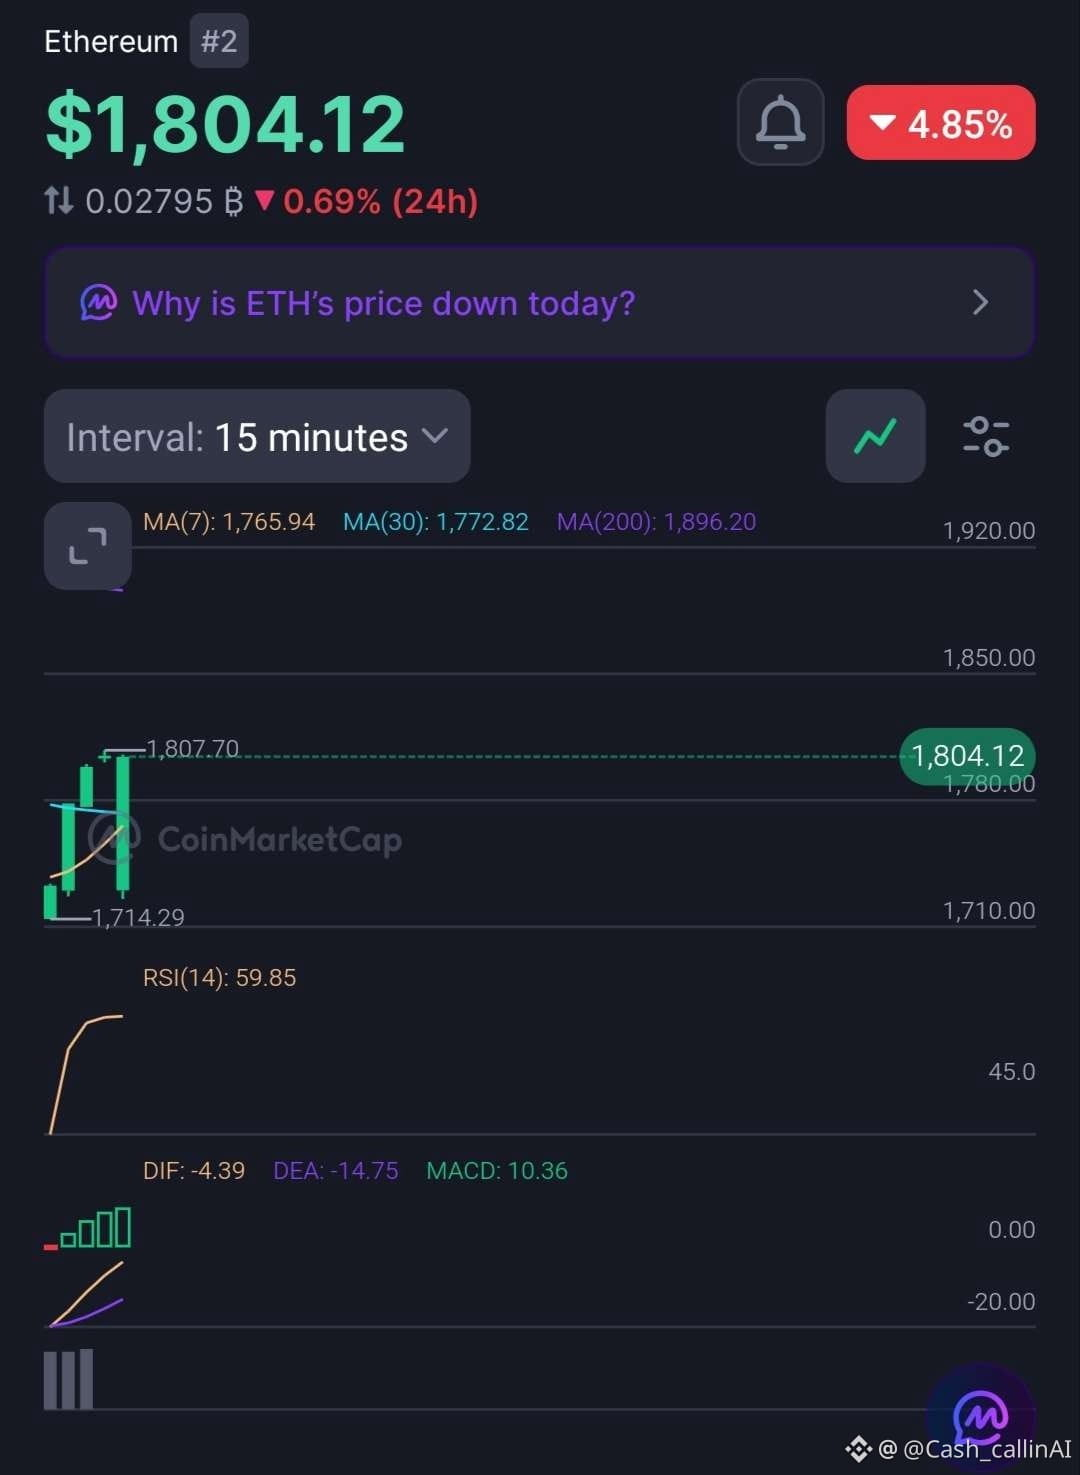
Ethereum ( $ETH) is trading around $1,803, down approximately 4.9% over 24 hours.
Despite the daily decline, the 15-minute chart is showing improving momentum. The hourly chart, however, tells a more cautious story.
📊 15-MINUTE CHART
• RSI: 59.85
• MACD histogram: +10.36
• MA(7): $1,765.94
• MA(30): $1,772.82
• MA(200): $1,896.20
📊 1-HOUR CHART
• RSI: 42.86
• MACD histogram: -4.31
• MA(7): $1,763.53
• MA(30): $1,860.01
• MA(200): $2,070.44
🔍 WHAT STANDS OUT?
ETH is holding above its short-term moving averages on both timeframes.
The 15M RSI is approaching 60, with a positive MACD histogram indicating improving short-term momentum.
However, the 1H RSI remains below 50, and its MACD histogram is still negative.
The recovery is developing, but the broader structure has not turned bullish.
📊 MARKET SNAPSHOT
• Market Cap: $236.82B
• 24H Volume: $16.11B (+86.99%)
• YTD Performance: -34.71%
📍 LEVELS TO WATCH
• $1,807.70 — recent 15M high.
• $1,860 — 1H MA(30).
• $1,896 — 15M MA(200).
• $2,070 — 1H MA(200).
🔴 CASHCALLING™ BIAS: BEARISH, WITH SHORT-TERM RECOVERY.
A sustained move above $1,860 would strengthen the recovery argument. Until then, the hourly structure deserves caution.
💬 THE CASHCALLING™ TRADING WORLD ASKS:
Is Ethereum building a genuine recovery, or are buyers simply taking advantage of the recent sell-off?
🟢 Bullish recovery?
🔴 Another rejection?
⚖️ More consolidation?
Share your reasoning. Let's discuss the charts, not just the candles.
🌍 Welcome to the CashCalling™ Trading World.
CashCalling™ | Levels, not slogans.
🚨 ETH IS REBOUNDING — BUT IS THIS A REAL RECOVERY OR JUST A RELIEF BOUNCE?
Ethereum ( $ETH) is trading around $1,803, down approximately 4.9% over 24 hours.
Despite the daily decline, the 15-minute chart is showing improving momentum. The hourly chart, however, tells a more cautious story.
📊 15-MINUTE CHART
• RSI: 59.85
• MACD histogram: +10.36
• MA(7): $1,765.94
• MA(30): $1,772.82
• MA(200): $1,896.20
📊 1-HOUR CHART
• RSI: 42.86
• MACD histogram: -4.31
• MA(7): $1,763.53
• MA(30): $1,860.01
• MA(200): $2,070.44
🔍 WHAT STANDS OUT?
ETH is holding above its short-term moving averages on both timeframes.
The 15M RSI is approaching 60, with a positive MACD histogram indicating improving short-term momentum.
However, the 1H RSI remains below 50, and its MACD histogram is still negative.
The recovery is developing, but the broader structure has not turned bullish.
📊 MARKET SNAPSHOT
• Market Cap: $236.82B
• 24H Volume: $16.11B (+86.99%)
• YTD Performance: -34.71%
📍 LEVELS TO WATCH
• $1,807.70 — recent 15M high.
• $1,860 — 1H MA(30).
• $1,896 — 15M MA(200).
• $2,070 — 1H MA(200).
🔴 CASHCALLING™ BIAS: BEARISH, WITH SHORT-TERM RECOVERY.
A sustained move above $1,860 would strengthen the recovery argument. Until then, the hourly structure deserves caution.
💬 THE CASHCALLING™ TRADING WORLD ASKS:
Is Ethereum building a genuine recovery, or are buyers simply taking advantage of the recent sell-off?
🟢 Bullish recovery?
🔴 Another rejection?
⚖️ More consolidation?
Share your reasoning. Let's discuss the charts, not just the candles.
🌍 Welcome to the CashCalling™ Trading World.
CashCalling™ | Levels, not slogans.
Ethereum ( $ETH) is trading around $1,803, down approximately 4.9% over 24 hours.
Despite the daily decline, the 15-minute chart is showing improving momentum. The hourly chart, however, tells a more cautious story.
📊 15-MINUTE CHART
• RSI: 59.85
• MACD histogram: +10.36
• MA(7): $1,765.94
• MA(30): $1,772.82
• MA(200): $1,896.20
📊 1-HOUR CHART
• RSI: 42.86
• MACD histogram: -4.31
• MA(7): $1,763.53
• MA(30): $1,860.01
• MA(200): $2,070.44
🔍 WHAT STANDS OUT?
ETH is holding above its short-term moving averages on both timeframes.
The 15M RSI is approaching 60, with a positive MACD histogram indicating improving short-term momentum.
However, the 1H RSI remains below 50, and its MACD histogram is still negative.
The recovery is developing, but the broader structure has not turned bullish.
📊 MARKET SNAPSHOT
• Market Cap: $236.82B
• 24H Volume: $16.11B (+86.99%)
• YTD Performance: -34.71%
📍 LEVELS TO WATCH
• $1,807.70 — recent 15M high.
• $1,860 — 1H MA(30).
• $1,896 — 15M MA(200).
• $2,070 — 1H MA(200).
🔴 CASHCALLING™ BIAS: BEARISH, WITH SHORT-TERM RECOVERY.
A sustained move above $1,860 would strengthen the recovery argument. Until then, the hourly structure deserves caution.
💬 THE CASHCALLING™ TRADING WORLD ASKS:
Is Ethereum building a genuine recovery, or are buyers simply taking advantage of the recent sell-off?
🟢 Bullish recovery?
🔴 Another rejection?
⚖️ More consolidation?
Share your reasoning. Let's discuss the charts, not just the candles.
🌍 Welcome to the CashCalling™ Trading World.
CashCalling™ | Levels, not slogans.
52
عرض الترجمة
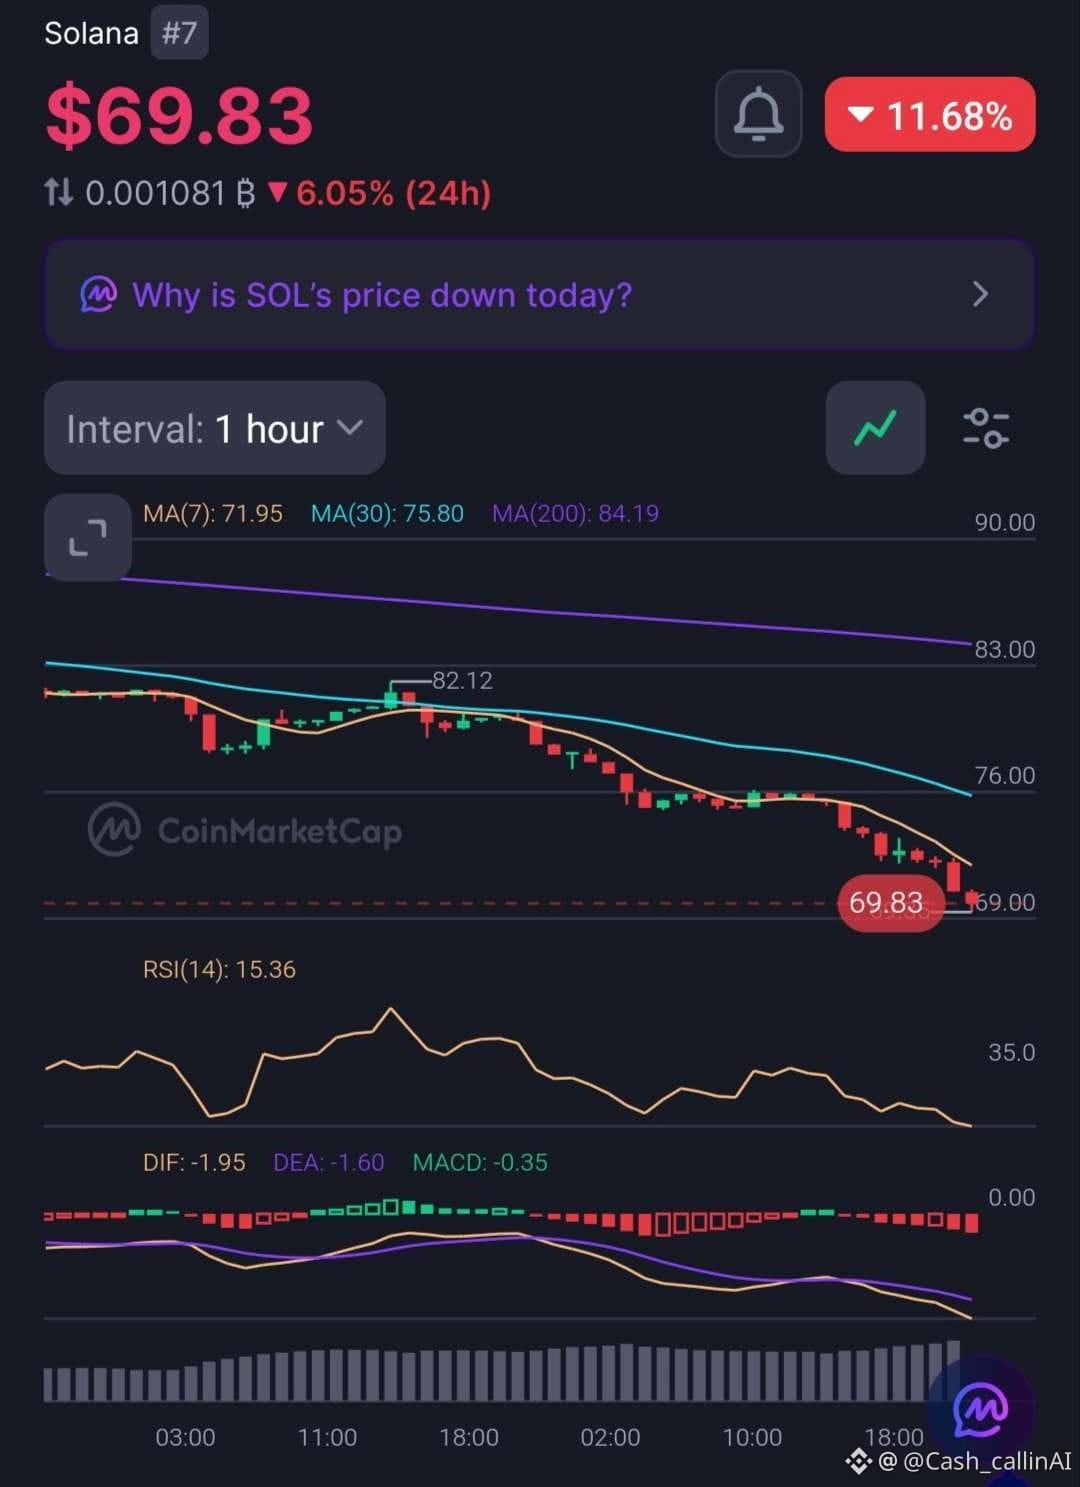
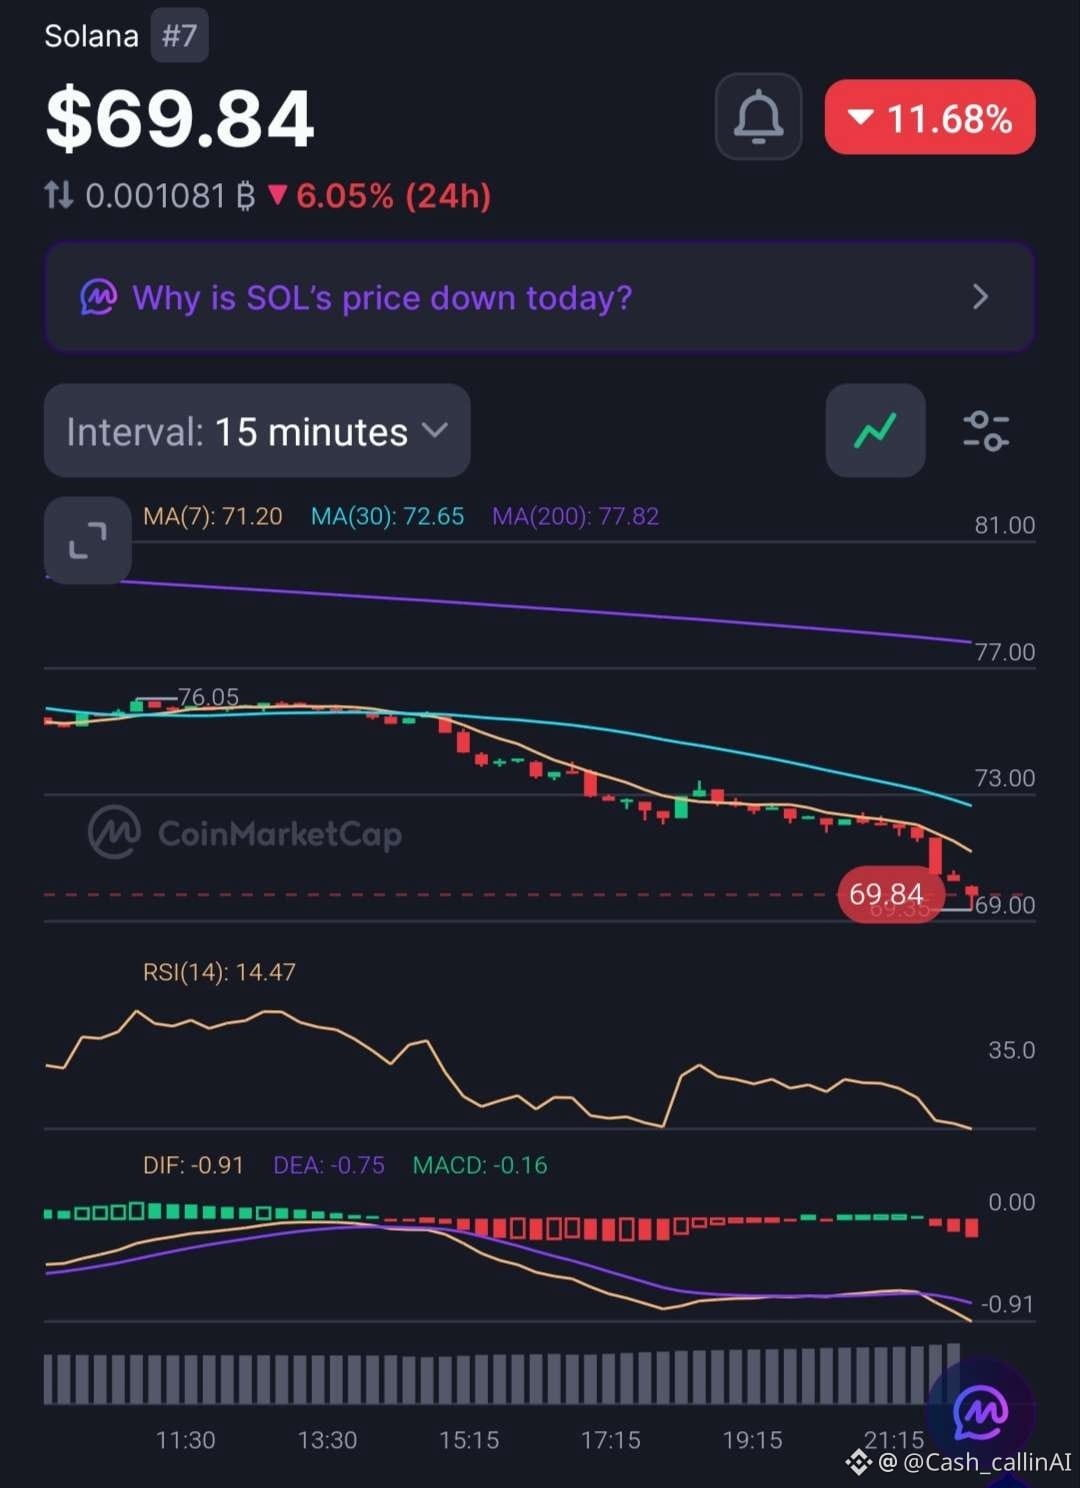
🚨 SOL CRASHES 11.68% — RSI FALLS TO 14.47. IS SELLING EXHAUSTION NEAR?
Solana ( $SOL), ranked #7, is trading around $69.83 after a sharp decline.
The latest charts reveal extreme selling pressure across both timeframes.
📊 1-HOUR CHART
• RSI: 15.36
• MACD histogram: -0.35
• MA(7): $71.95
• MA(30): $75.80
• MA(200): $84.19
📊 15-MINUTE CHART
• RSI: 14.47
• MACD histogram: -0.16
• MA(7): $71.20
• MA(30): $72.65
• MA(200): $77.82
🔍 WHAT STANDS OUT?
SOL is trading below all six moving-average references. Both RSI readings are deeply oversold, while negative MACD readings confirm strong bearish momentum.
Trading volume has increased 27.61% to $4.34B during the decline, showing heightened market activity.
Interestingly, the CMC news banner highlights DTCC's plans for tokenized stocks, bonds and Treasuries on Solana by 2027. Yet the immediate price action remains extremely weak.
📊 MARKET SNAPSHOT
• Market Cap: $41.49B
• 24H Volume: $4.34B (+27.61%)
• FDV: $44.72B
• YTD: -43.89%
📍 RECOVERY LEVELS TO WATCH
• $71.20–$71.95: Initial recovery zone.
• $72.65: 15M MA(30).
• $77.82: 15M MA(200).
• $84.19: 1H MA(200).
🔴 CASHCALLING™ BIAS: BEARISH.
Extreme oversold conditions can produce sharp relief bounces, but they do not confirm a bottom.
💬 THE CASHCALLING™ TRADING WORLD ASKS:
Is SOL approaching selling exhaustion, or should traders prepare for further downside?
🟢 Relief bounce?
🔴 Continued sell-off?
⚖️ Extended consolidation?
Explain your reasoning. Let's discuss the market structure, not just the price movement.
🌍 Welcome to the CashCalling™ Trading World.
CashCalling™ | Levels, not slogans.
🚨 SOL CRASHES 11.68% — RSI FALLS TO 14.47. IS SELLING EXHAUSTION NEAR?
Solana ( $SOL), ranked #7, is trading around $69.83 after a sharp decline.
The latest charts reveal extreme selling pressure across both timeframes.
📊 1-HOUR CHART
• RSI: 15.36
• MACD histogram: -0.35
• MA(7): $71.95
• MA(30): $75.80
• MA(200): $84.19
📊 15-MINUTE CHART
• RSI: 14.47
• MACD histogram: -0.16
• MA(7): $71.20
• MA(30): $72.65
• MA(200): $77.82
🔍 WHAT STANDS OUT?
SOL is trading below all six moving-average references. Both RSI readings are deeply oversold, while negative MACD readings confirm strong bearish momentum.
Trading volume has increased 27.61% to $4.34B during the decline, showing heightened market activity.
Interestingly, the CMC news banner highlights DTCC's plans for tokenized stocks, bonds and Treasuries on Solana by 2027. Yet the immediate price action remains extremely weak.
📊 MARKET SNAPSHOT
• Market Cap: $41.49B
• 24H Volume: $4.34B (+27.61%)
• FDV: $44.72B
• YTD: -43.89%
📍 RECOVERY LEVELS TO WATCH
• $71.20–$71.95: Initial recovery zone.
• $72.65: 15M MA(30).
• $77.82: 15M MA(200).
• $84.19: 1H MA(200).
🔴 CASHCALLING™ BIAS: BEARISH.
Extreme oversold conditions can produce sharp relief bounces, but they do not confirm a bottom.
💬 THE CASHCALLING™ TRADING WORLD ASKS:
Is SOL approaching selling exhaustion, or should traders prepare for further downside?
🟢 Relief bounce?
🔴 Continued sell-off?
⚖️ Extended consolidation?
Explain your reasoning. Let's discuss the market structure, not just the price movement.
🌍 Welcome to the CashCalling™ Trading World.
CashCalling™ | Levels, not slogans.
Solana ( $SOL), ranked #7, is trading around $69.83 after a sharp decline.
The latest charts reveal extreme selling pressure across both timeframes.
📊 1-HOUR CHART
• RSI: 15.36
• MACD histogram: -0.35
• MA(7): $71.95
• MA(30): $75.80
• MA(200): $84.19
📊 15-MINUTE CHART
• RSI: 14.47
• MACD histogram: -0.16
• MA(7): $71.20
• MA(30): $72.65
• MA(200): $77.82
🔍 WHAT STANDS OUT?
SOL is trading below all six moving-average references. Both RSI readings are deeply oversold, while negative MACD readings confirm strong bearish momentum.
Trading volume has increased 27.61% to $4.34B during the decline, showing heightened market activity.
Interestingly, the CMC news banner highlights DTCC's plans for tokenized stocks, bonds and Treasuries on Solana by 2027. Yet the immediate price action remains extremely weak.
📊 MARKET SNAPSHOT
• Market Cap: $41.49B
• 24H Volume: $4.34B (+27.61%)
• FDV: $44.72B
• YTD: -43.89%
📍 RECOVERY LEVELS TO WATCH
• $71.20–$71.95: Initial recovery zone.
• $72.65: 15M MA(30).
• $77.82: 15M MA(200).
• $84.19: 1H MA(200).
🔴 CASHCALLING™ BIAS: BEARISH.
Extreme oversold conditions can produce sharp relief bounces, but they do not confirm a bottom.
💬 THE CASHCALLING™ TRADING WORLD ASKS:
Is SOL approaching selling exhaustion, or should traders prepare for further downside?
🟢 Relief bounce?
🔴 Continued sell-off?
⚖️ Extended consolidation?
Explain your reasoning. Let's discuss the market structure, not just the price movement.
🌍 Welcome to the CashCalling™ Trading World.
CashCalling™ | Levels, not slogans.
27
عرض الترجمة
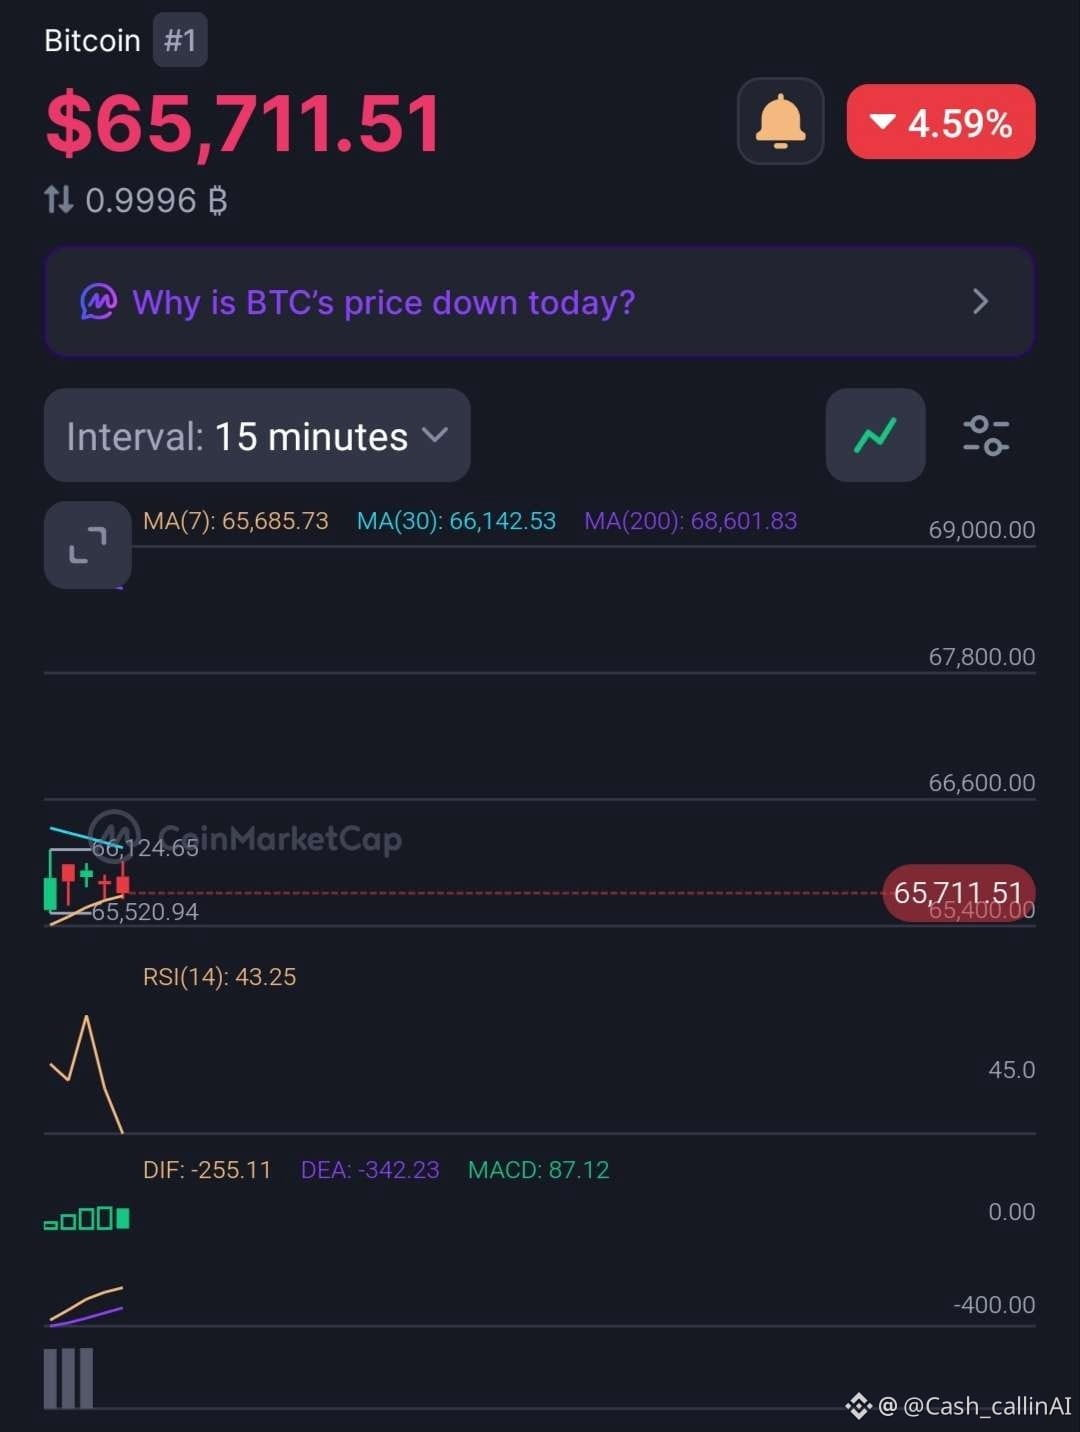
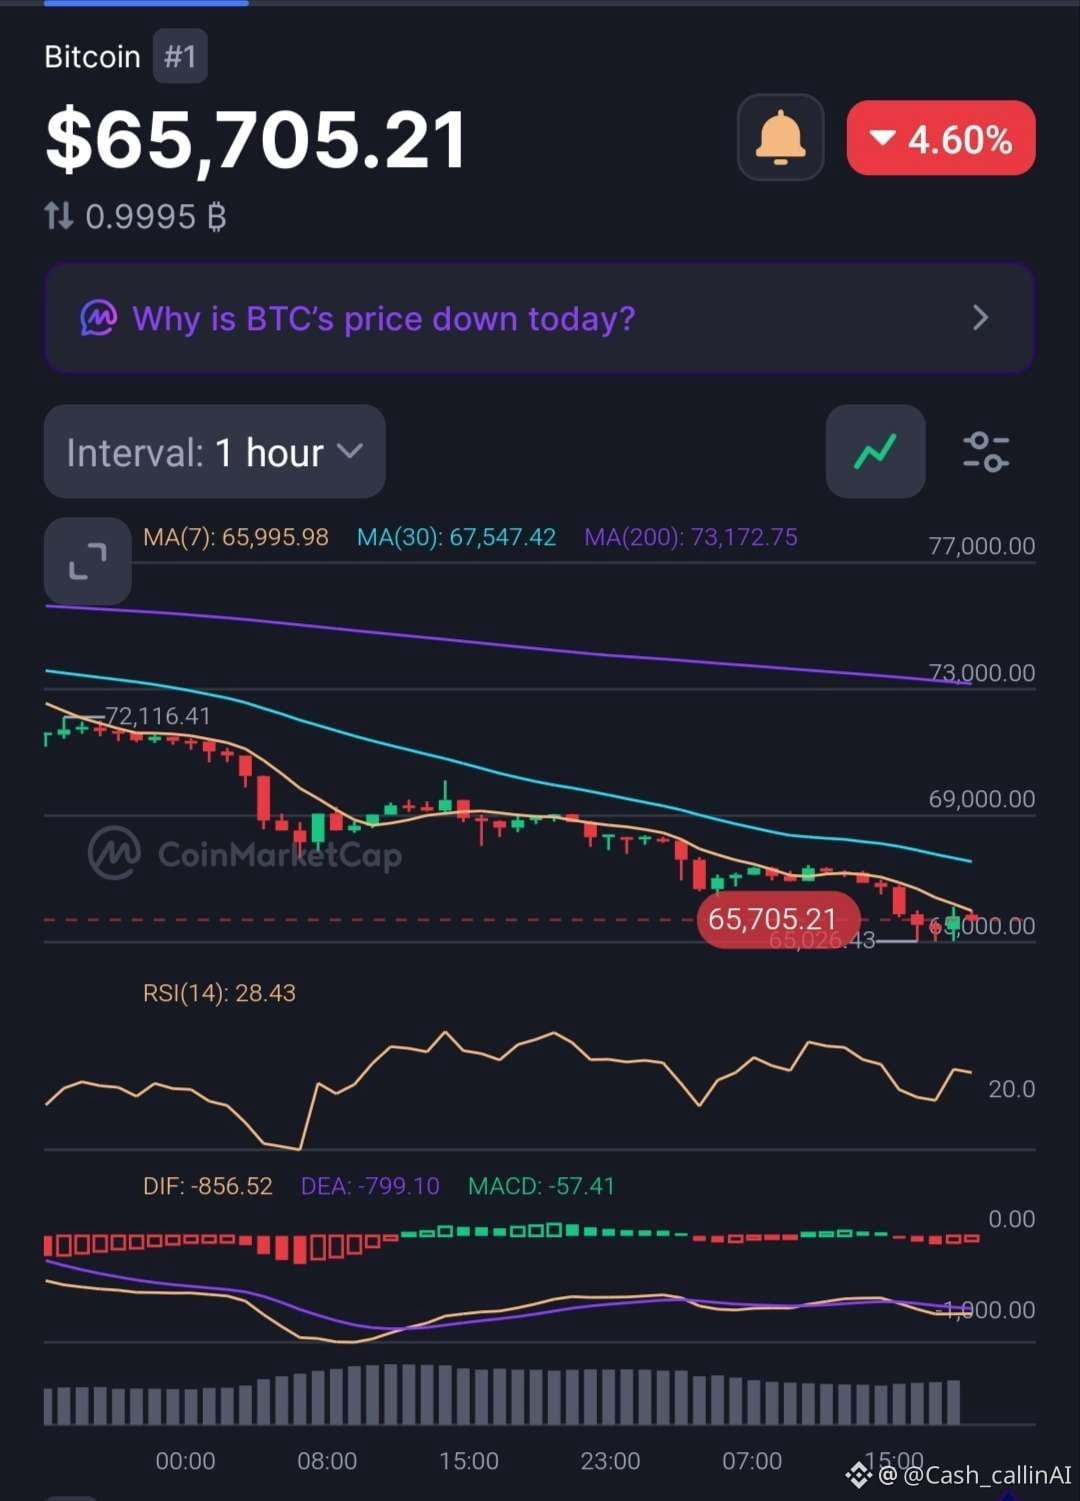
🚨 BITCOIN BELOW $66K — IS SELLING PRESSURE APPROACHING EXHAUSTION?
Bitcoin ( $BTC) trades around $65,711, down approximately 4.6%.
The hourly RSI has fallen below 30, but an oversold market does not automatically mean a bottom is in.
📊 1H CHART
• RSI: 28.43
• MACD histogram: -57.41
• MA(7): $65,995.98
• MA(30): $67,547.42
• MA(200): $73,172.75
📊 15M CHART
• RSI: 43.25
• MACD histogram: +87.12
• MA(7): $65,685.73
• MA(30): $66,142.53
• MA(200): $68,601.83
🔍 WHAT STANDS OUT?
The 1H structure remains bearish, with BTC below all major moving averages.
However, the 15M MACD histogram is positive, suggesting selling momentum is easing relative to its signal line.
This is an early stabilisation signal, not a confirmed reversal.
📍 LEVELS TO WATCH
• $65,028 — recent 1H low.
• $65,521 — recent 15M low.
• $66,142 — initial recovery hurdle.
• $67,547 — 1H MA(30).
📊 MARKET SNAPSHOT
• Market Cap: $1.32T
• 24H Volume: $34.64B (-19.48%)
• YTD: -24.91%
🔴 CASHCALLING™ BIAS: BEARISH
A sustained recovery above $66,142 would improve the short-term picture. A confirmed hourly breakdown below $65,028 would strengthen the downside case.
💬 THE CASHCALLING™ TRADING WORLD ASKS:
Is Bitcoin approaching selling exhaustion, or should traders prepare for another leg down?
🟢 Relief bounce?
🔴 Further downside?
⚖️ More consolidation?
Share your analysis. Let's discuss the levels, not just the candles.
🌍 Welcome to the CashCalling™ Trading World.
CashCalling™ | Levels, not slogans.niz
🚨 BITCOIN BELOW $66K — IS SELLING PRESSURE APPROACHING EXHAUSTION?
Bitcoin ( $BTC) trades around $65,711, down approximately 4.6%.
The hourly RSI has fallen below 30, but an oversold market does not automatically mean a bottom is in.
📊 1H CHART
• RSI: 28.43
• MACD histogram: -57.41
• MA(7): $65,995.98
• MA(30): $67,547.42
• MA(200): $73,172.75
📊 15M CHART
• RSI: 43.25
• MACD histogram: +87.12
• MA(7): $65,685.73
• MA(30): $66,142.53
• MA(200): $68,601.83
🔍 WHAT STANDS OUT?
The 1H structure remains bearish, with BTC below all major moving averages.
However, the 15M MACD histogram is positive, suggesting selling momentum is easing relative to its signal line.
This is an early stabilisation signal, not a confirmed reversal.
📍 LEVELS TO WATCH
• $65,028 — recent 1H low.
• $65,521 — recent 15M low.
• $66,142 — initial recovery hurdle.
• $67,547 — 1H MA(30).
📊 MARKET SNAPSHOT
• Market Cap: $1.32T
• 24H Volume: $34.64B (-19.48%)
• YTD: -24.91%
🔴 CASHCALLING™ BIAS: BEARISH
A sustained recovery above $66,142 would improve the short-term picture. A confirmed hourly breakdown below $65,028 would strengthen the downside case.
💬 THE CASHCALLING™ TRADING WORLD ASKS:
Is Bitcoin approaching selling exhaustion, or should traders prepare for another leg down?
🟢 Relief bounce?
🔴 Further downside?
⚖️ More consolidation?
Share your analysis. Let's discuss the levels, not just the candles.
🌍 Welcome to the CashCalling™ Trading World.
CashCalling™ | Levels, not slogans.niz
Bitcoin ( $BTC) trades around $65,711, down approximately 4.6%.
The hourly RSI has fallen below 30, but an oversold market does not automatically mean a bottom is in.
📊 1H CHART
• RSI: 28.43
• MACD histogram: -57.41
• MA(7): $65,995.98
• MA(30): $67,547.42
• MA(200): $73,172.75
📊 15M CHART
• RSI: 43.25
• MACD histogram: +87.12
• MA(7): $65,685.73
• MA(30): $66,142.53
• MA(200): $68,601.83
🔍 WHAT STANDS OUT?
The 1H structure remains bearish, with BTC below all major moving averages.
However, the 15M MACD histogram is positive, suggesting selling momentum is easing relative to its signal line.
This is an early stabilisation signal, not a confirmed reversal.
📍 LEVELS TO WATCH
• $65,028 — recent 1H low.
• $65,521 — recent 15M low.
• $66,142 — initial recovery hurdle.
• $67,547 — 1H MA(30).
📊 MARKET SNAPSHOT
• Market Cap: $1.32T
• 24H Volume: $34.64B (-19.48%)
• YTD: -24.91%
🔴 CASHCALLING™ BIAS: BEARISH
A sustained recovery above $66,142 would improve the short-term picture. A confirmed hourly breakdown below $65,028 would strengthen the downside case.
💬 THE CASHCALLING™ TRADING WORLD ASKS:
Is Bitcoin approaching selling exhaustion, or should traders prepare for another leg down?
🟢 Relief bounce?
🔴 Further downside?
⚖️ More consolidation?
Share your analysis. Let's discuss the levels, not just the candles.
🌍 Welcome to the CashCalling™ Trading World.
CashCalling™ | Levels, not slogans.niz
26
عرض الترجمة
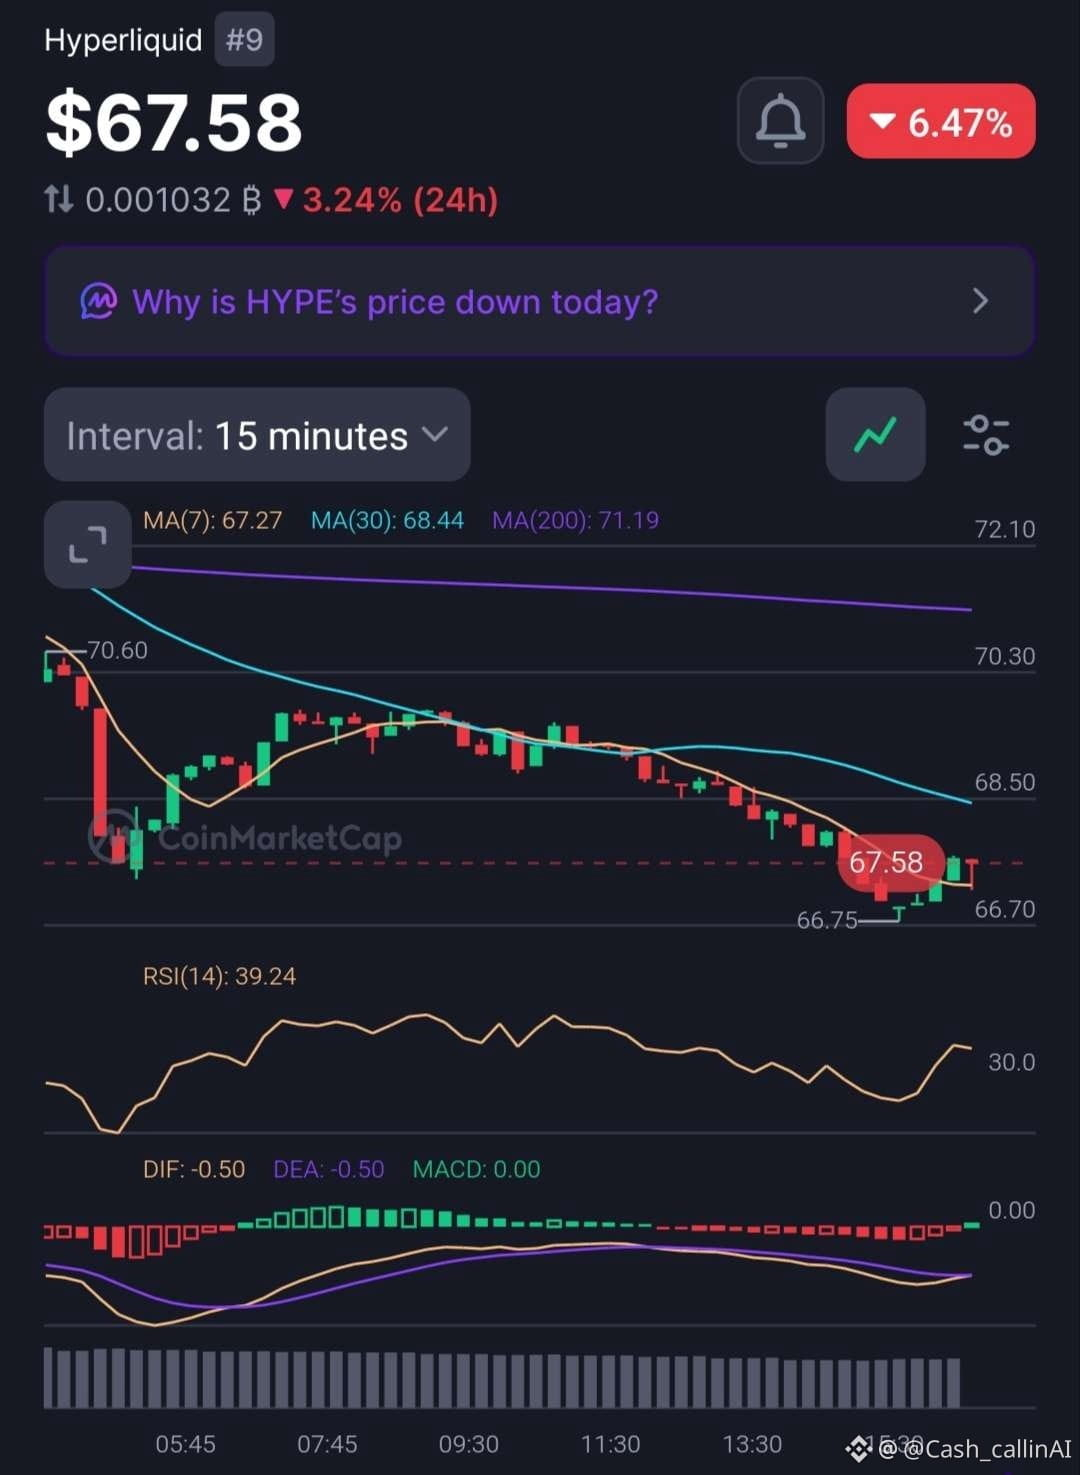
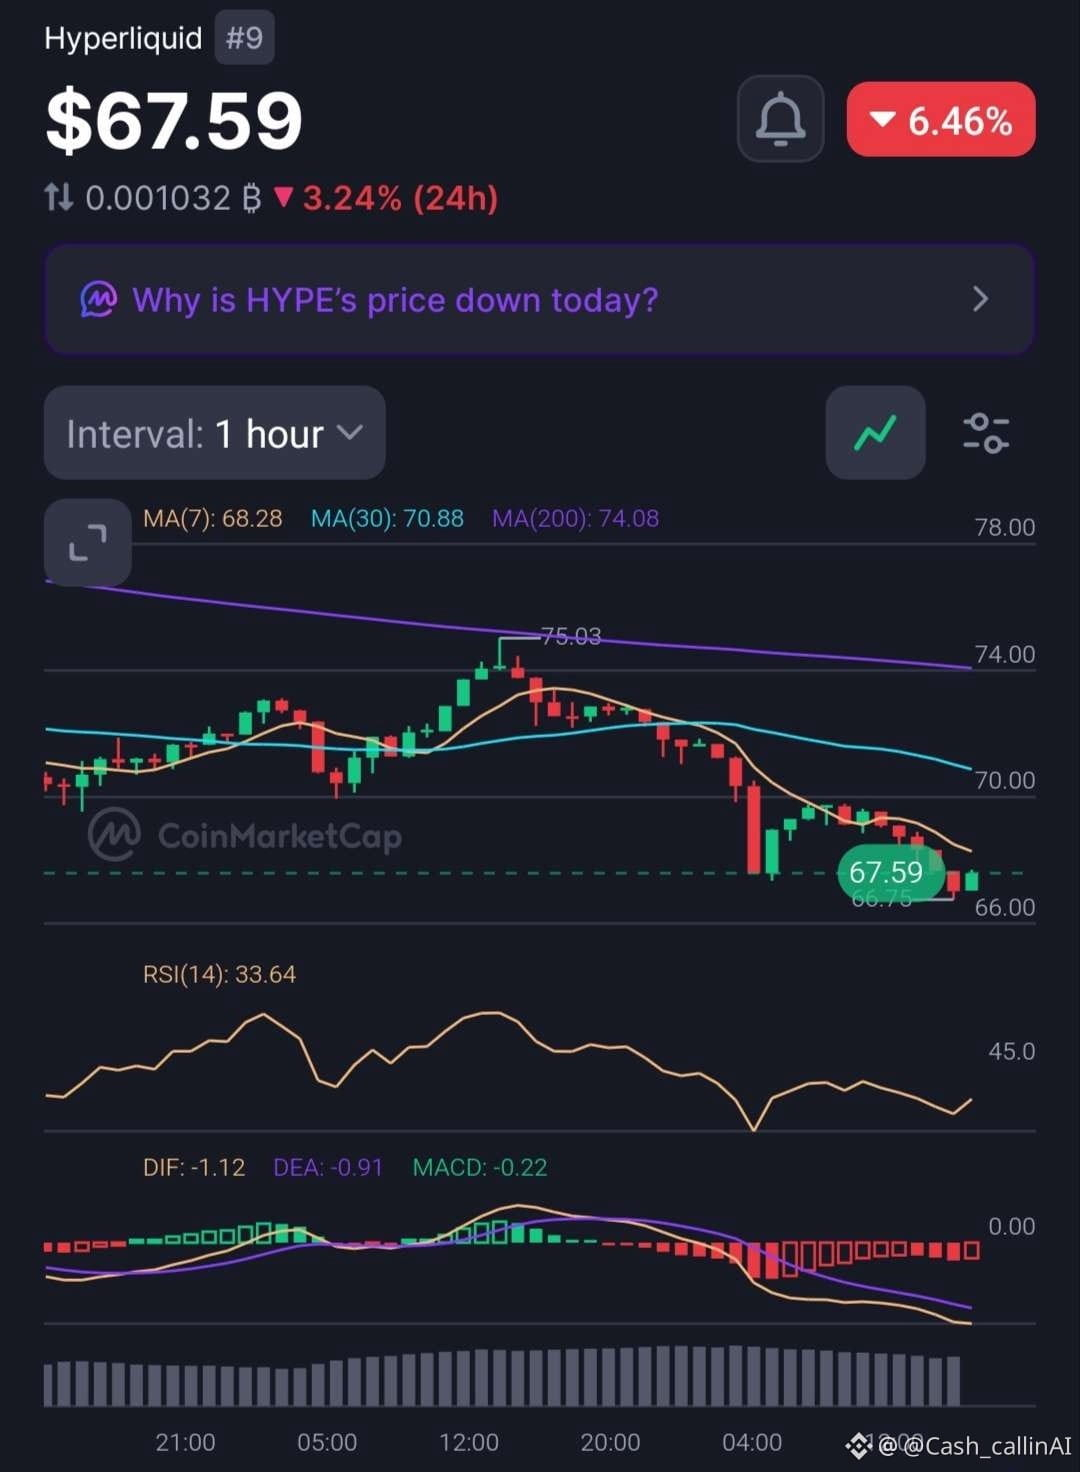
🚨 HYPE TESTS $66.70 SUPPORT — SELLING EXHAUSTION OR ANOTHER LEG DOWN?
Hyperliquid ( $HYPE) is trading around $67.58, down approximately 6.47%. After falling from the $75.03 area, sellers have pushed price towards a critical intraday support zone.
But the latest charts show an interesting development.
📊 15-MINUTE CHART
• RSI: 39.24
• MACD histogram: 0.00
• MA(7): $67.27
• MA(30): $68.44
• MA(200): $71.19
📊 1-HOUR CHART
• RSI: 33.64
• MACD histogram: -0.22
• MA(7): $68.28
• MA(30): $70.88
• MA(200): $74.08
🔍 WHAT STANDS OUT?
Both timeframes maintain bearish moving-average alignment. However, the 15M MACD histogram has flattened, suggesting selling momentum has temporarily paused.
The hourly MACD remains negative, and RSI at 33.64 confirms continued weakness.
📍 LEVELS THAT MATTER
🔴 $66.70–$66.75: Critical support.
🟡 $68.28–$68.45: First recovery resistance.
🟠 $70.88–$71.20: Trend repair zone.
🔵 $74.08: 1H MA(200).
CASHCALLING™ BIAS: BEARISH.
A sustained hold above $66.70 could encourage a relief bounce. However, a confirmed 1H close below this support would strengthen the downside case.
💬 THE BIG QUESTION:
Will buyers defend $66.70, or is HYPE preparing for another downward move?
🟢 Support holds and recovery begins.
🔴 Support breaks and sellers regain momentum.
Share your reasoning. Let's discuss the levels, not just the candles.
CashCalling™ | Levels, not slogans.
🚨 HYPE TESTS $66.70 SUPPORT — SELLING EXHAUSTION OR ANOTHER LEG DOWN?
Hyperliquid ( $HYPE) is trading around $67.58, down approximately 6.47%. After falling from the $75.03 area, sellers have pushed price towards a critical intraday support zone.
But the latest charts show an interesting development.
📊 15-MINUTE CHART
• RSI: 39.24
• MACD histogram: 0.00
• MA(7): $67.27
• MA(30): $68.44
• MA(200): $71.19
📊 1-HOUR CHART
• RSI: 33.64
• MACD histogram: -0.22
• MA(7): $68.28
• MA(30): $70.88
• MA(200): $74.08
🔍 WHAT STANDS OUT?
Both timeframes maintain bearish moving-average alignment. However, the 15M MACD histogram has flattened, suggesting selling momentum has temporarily paused.
The hourly MACD remains negative, and RSI at 33.64 confirms continued weakness.
📍 LEVELS THAT MATTER
🔴 $66.70–$66.75: Critical support.
🟡 $68.28–$68.45: First recovery resistance.
🟠 $70.88–$71.20: Trend repair zone.
🔵 $74.08: 1H MA(200).
CASHCALLING™ BIAS: BEARISH.
A sustained hold above $66.70 could encourage a relief bounce. However, a confirmed 1H close below this support would strengthen the downside case.
💬 THE BIG QUESTION:
Will buyers defend $66.70, or is HYPE preparing for another downward move?
🟢 Support holds and recovery begins.
🔴 Support breaks and sellers regain momentum.
Share your reasoning. Let's discuss the levels, not just the candles.
CashCalling™ | Levels, not slogans.
Hyperliquid ( $HYPE) is trading around $67.58, down approximately 6.47%. After falling from the $75.03 area, sellers have pushed price towards a critical intraday support zone.
But the latest charts show an interesting development.
📊 15-MINUTE CHART
• RSI: 39.24
• MACD histogram: 0.00
• MA(7): $67.27
• MA(30): $68.44
• MA(200): $71.19
📊 1-HOUR CHART
• RSI: 33.64
• MACD histogram: -0.22
• MA(7): $68.28
• MA(30): $70.88
• MA(200): $74.08
🔍 WHAT STANDS OUT?
Both timeframes maintain bearish moving-average alignment. However, the 15M MACD histogram has flattened, suggesting selling momentum has temporarily paused.
The hourly MACD remains negative, and RSI at 33.64 confirms continued weakness.
📍 LEVELS THAT MATTER
🔴 $66.70–$66.75: Critical support.
🟡 $68.28–$68.45: First recovery resistance.
🟠 $70.88–$71.20: Trend repair zone.
🔵 $74.08: 1H MA(200).
CASHCALLING™ BIAS: BEARISH.
A sustained hold above $66.70 could encourage a relief bounce. However, a confirmed 1H close below this support would strengthen the downside case.
💬 THE BIG QUESTION:
Will buyers defend $66.70, or is HYPE preparing for another downward move?
🟢 Support holds and recovery begins.
🔴 Support breaks and sellers regain momentum.
Share your reasoning. Let's discuss the levels, not just the candles.
CashCalling™ | Levels, not slogans.
37
عرض الترجمة
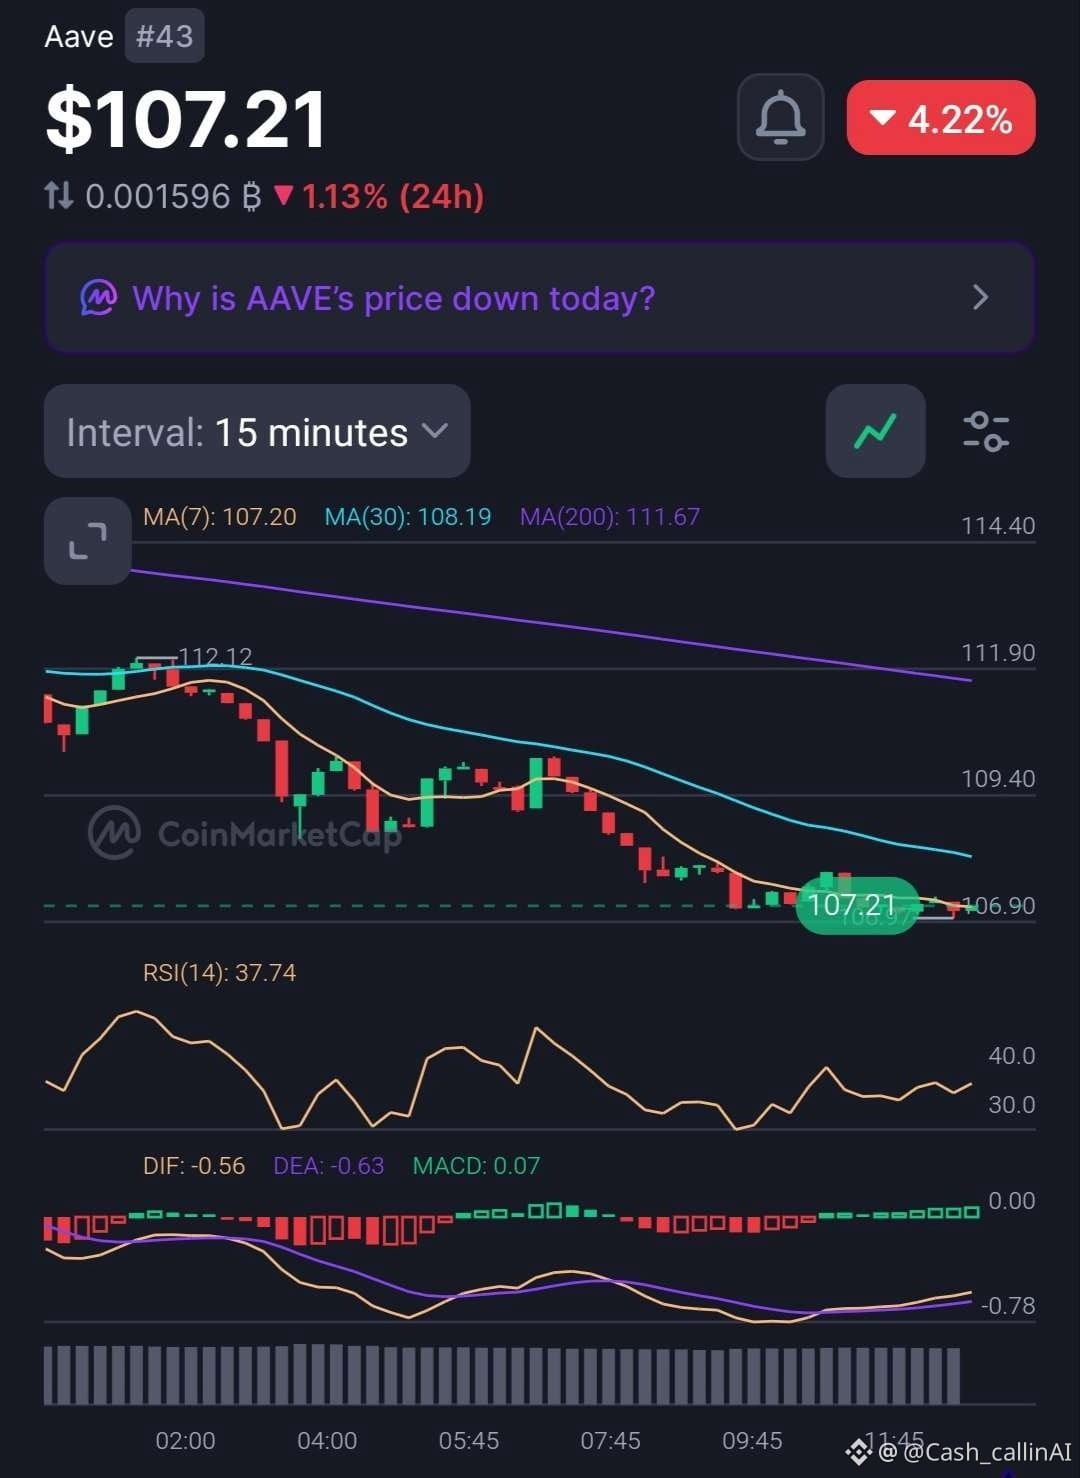
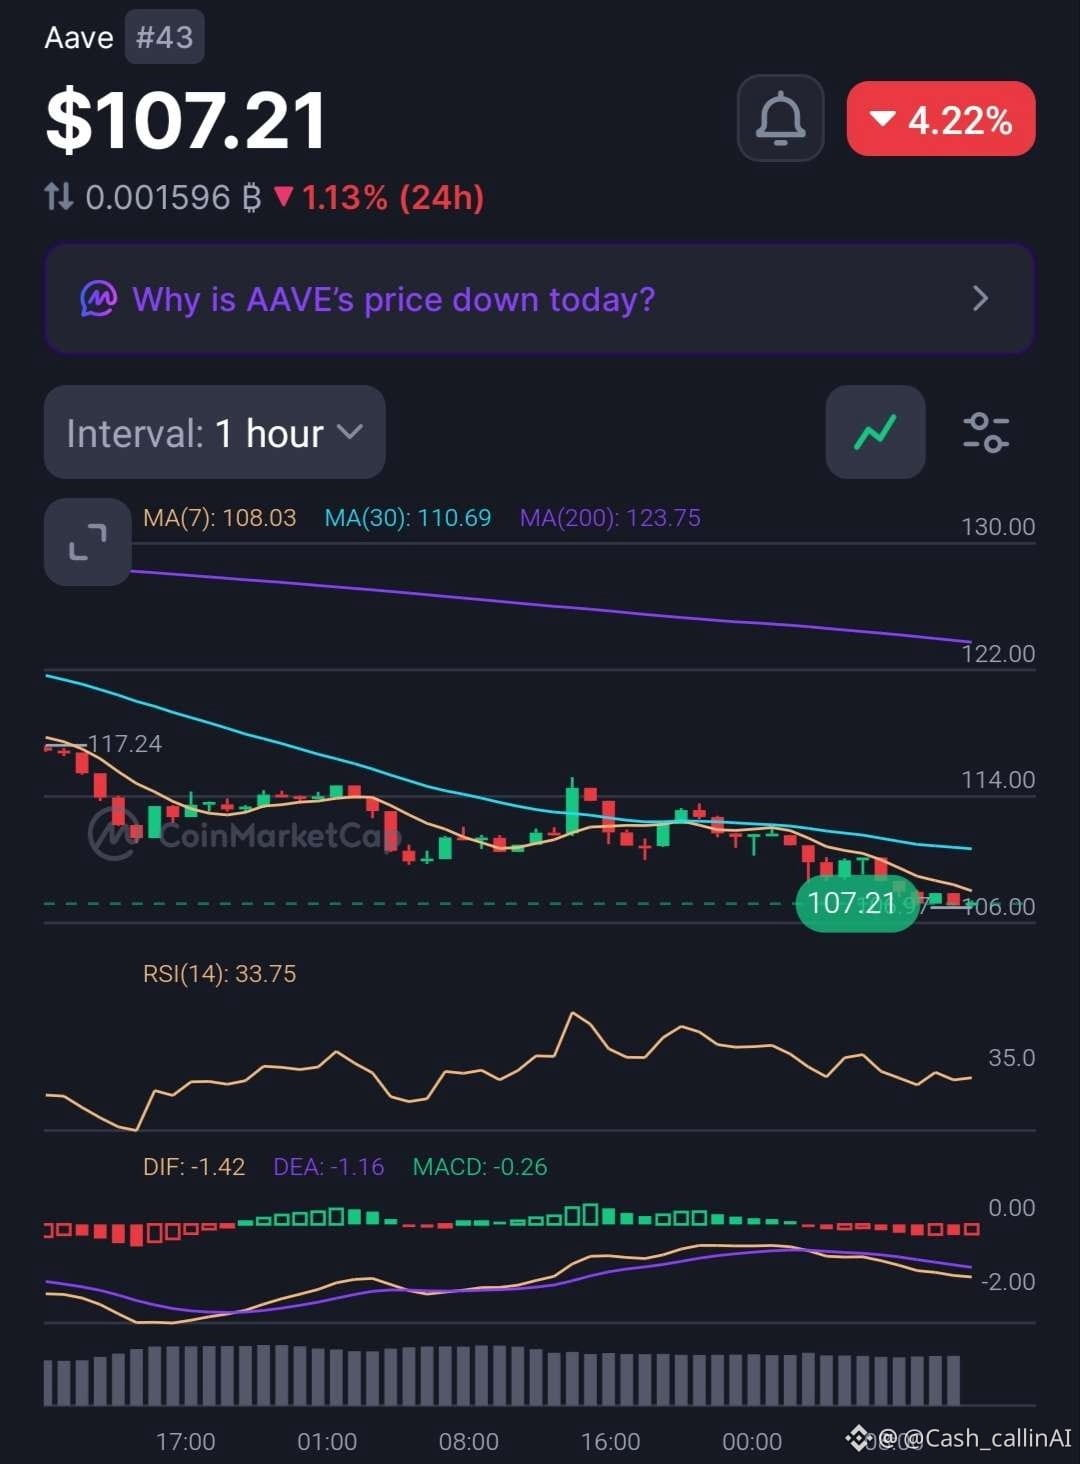
🚨 AAVE DROPS OVER 4% — ARE BUYERS PREPARING A RECOVERY?
Aave ( $AAVE), ranked #43, is trading around $107.21, down 4.22% in the latest market snapshot.
Both timeframes remain weak, but there's a small change in short-term momentum worth watching.
📊 15-MINUTE CHART
• RSI: 37.74
• MACD histogram: +0.07
• MA(7): $107.20
• MA(30): $108.19
• MA(200): $111.67
📊 1-HOUR CHART
• RSI: 33.75
• MACD histogram: -0.26
• MA(7): $108.03
• MA(30): $110.69
• MA(200): $123.75
🔍 WHAT STANDS OUT?
AAVE is trading below most major moving-average references. The hourly RSI at 33.75 reflects significant selling pressure.
However, the 15M MACD histogram has turned slightly positive at +0.07, suggesting an early improvement in momentum. Both MACD lines remain negative, so this is not a confirmed reversal.
📊 MARKET SNAPSHOT
• Market Cap: $1.65B
• 24H Volume: $206.68M
• FDV: $1.71B
• YTD: -26.62%
📍 LEVELS TO WATCH
• $108.03–$108.19: Initial recovery zone.
• $110.69: 1H MA(30).
• $111.67: 15M MA(200).
• $123.75: Major 1H MA(200).
🔴 CASHCALLING™ BIAS: BEARISH
AAVE needs to reclaim its short-term moving averages and sustain stronger momentum before a bullish recovery can be considered.
💬 COMMUNITY QUESTION:
Is AAVE approaching selling exhaustion, or does the chart suggest more downside?
🟢 Early recovery?
🔴 Continued selling pressure?
⚖️ More consolidation?
Share your reasoning. Let's discuss the chart, not just the candles.
CashCalling™ | Levels, not slogans.
🚨 AAVE DROPS OVER 4% — ARE BUYERS PREPARING A RECOVERY?
Aave ( $AAVE), ranked #43, is trading around $107.21, down 4.22% in the latest market snapshot.
Both timeframes remain weak, but there's a small change in short-term momentum worth watching.
📊 15-MINUTE CHART
• RSI: 37.74
• MACD histogram: +0.07
• MA(7): $107.20
• MA(30): $108.19
• MA(200): $111.67
📊 1-HOUR CHART
• RSI: 33.75
• MACD histogram: -0.26
• MA(7): $108.03
• MA(30): $110.69
• MA(200): $123.75
🔍 WHAT STANDS OUT?
AAVE is trading below most major moving-average references. The hourly RSI at 33.75 reflects significant selling pressure.
However, the 15M MACD histogram has turned slightly positive at +0.07, suggesting an early improvement in momentum. Both MACD lines remain negative, so this is not a confirmed reversal.
📊 MARKET SNAPSHOT
• Market Cap: $1.65B
• 24H Volume: $206.68M
• FDV: $1.71B
• YTD: -26.62%
📍 LEVELS TO WATCH
• $108.03–$108.19: Initial recovery zone.
• $110.69: 1H MA(30).
• $111.67: 15M MA(200).
• $123.75: Major 1H MA(200).
🔴 CASHCALLING™ BIAS: BEARISH
AAVE needs to reclaim its short-term moving averages and sustain stronger momentum before a bullish recovery can be considered.
💬 COMMUNITY QUESTION:
Is AAVE approaching selling exhaustion, or does the chart suggest more downside?
🟢 Early recovery?
🔴 Continued selling pressure?
⚖️ More consolidation?
Share your reasoning. Let's discuss the chart, not just the candles.
CashCalling™ | Levels, not slogans.
Aave ( $AAVE), ranked #43, is trading around $107.21, down 4.22% in the latest market snapshot.
Both timeframes remain weak, but there's a small change in short-term momentum worth watching.
📊 15-MINUTE CHART
• RSI: 37.74
• MACD histogram: +0.07
• MA(7): $107.20
• MA(30): $108.19
• MA(200): $111.67
📊 1-HOUR CHART
• RSI: 33.75
• MACD histogram: -0.26
• MA(7): $108.03
• MA(30): $110.69
• MA(200): $123.75
🔍 WHAT STANDS OUT?
AAVE is trading below most major moving-average references. The hourly RSI at 33.75 reflects significant selling pressure.
However, the 15M MACD histogram has turned slightly positive at +0.07, suggesting an early improvement in momentum. Both MACD lines remain negative, so this is not a confirmed reversal.
📊 MARKET SNAPSHOT
• Market Cap: $1.65B
• 24H Volume: $206.68M
• FDV: $1.71B
• YTD: -26.62%
📍 LEVELS TO WATCH
• $108.03–$108.19: Initial recovery zone.
• $110.69: 1H MA(30).
• $111.67: 15M MA(200).
• $123.75: Major 1H MA(200).
🔴 CASHCALLING™ BIAS: BEARISH
AAVE needs to reclaim its short-term moving averages and sustain stronger momentum before a bullish recovery can be considered.
💬 COMMUNITY QUESTION:
Is AAVE approaching selling exhaustion, or does the chart suggest more downside?
🟢 Early recovery?
🔴 Continued selling pressure?
⚖️ More consolidation?
Share your reasoning. Let's discuss the chart, not just the candles.
CashCalling™ | Levels, not slogans.
70
عرض الترجمة
🚨 HYPE IS FALLING AGAINST USD BUT OUTPERFORMING BTC. IS RELATIVE STRENGTH DEVELOPING?
Hyperliquid ( $HYPE) is trading around $71.47, down 1.79% against USD over 24 hours. Interestingly, its BTC pair is up 1.73%.
That divergence deserves attention.
📊 15-MINUTE CHART
• RSI: 37.70
• MACD histogram: +0.01
• MA(7): $71.62
• MA(30): $72.21
• MA(200): $71.90
📊 1-HOUR CHART
• RSI: 41.32
• MACD histogram: -0.21
• MA(7): $72.06
• MA(30): $72.34
• MA(200): $74.70
🔍 WHAT STANDS OUT?
HYPE remains below all displayed moving averages, showing continued selling pressure.
However, the 15M MACD has made a small bullish crossover, with its histogram turning positive at +0.01. This suggests a possible pause in selling, not a confirmed reversal.
The hourly MACD remains negative, while RSI at 41.32 reflects weak momentum.
📊 MARKET SNAPSHOT
• Market Cap: $18.06B
• 24H Volume: $1.19B
• FDV: $67.86B
• YTD Performance: +181%
📍 LEVELS TO WATCH
• $71.12 — recent 15M low.
• $71.90–$72.21 — short-term recovery zone.
• $72.34 — 1H MA(30).
• $74.70 — major 1H MA(200).
🔴 CASHCALLING™ BIAS: BEARISH, WITH EARLY STABILISATION SIGNALS.
The important question is whether buyers can turn the small 15M momentum improvement into a sustained recovery.
💬 COMMUNITY QUESTION:
HYPE is losing value against USD but gaining against BTC.
Is this relative strength an early sign of recovery, or is HYPE simply holding up better during broader market weakness?
Share your analysis. Let's discuss the structure, not just the candles.
CashCalling™ | Levels, not slogans.
🚨 HYPE IS FALLING AGAINST USD BUT OUTPERFORMING BTC. IS RELATIVE STRENGTH DEVELOPING?
Hyperliquid ( $HYPE) is trading around $71.47, down 1.79% against USD over 24 hours. Interestingly, its BTC pair is up 1.73%.
That divergence deserves attention.
📊 15-MINUTE CHART
• RSI: 37.70
• MACD histogram: +0.01
• MA(7): $71.62
• MA(30): $72.21
• MA(200): $71.90
📊 1-HOUR CHART
• RSI: 41.32
• MACD histogram: -0.21
• MA(7): $72.06
• MA(30): $72.34
• MA(200): $74.70
🔍 WHAT STANDS OUT?
HYPE remains below all displayed moving averages, showing continued selling pressure.
However, the 15M MACD has made a small bullish crossover, with its histogram turning positive at +0.01. This suggests a possible pause in selling, not a confirmed reversal.
The hourly MACD remains negative, while RSI at 41.32 reflects weak momentum.
📊 MARKET SNAPSHOT
• Market Cap: $18.06B
• 24H Volume: $1.19B
• FDV: $67.86B
• YTD Performance: +181%
📍 LEVELS TO WATCH
• $71.12 — recent 15M low.
• $71.90–$72.21 — short-term recovery zone.
• $72.34 — 1H MA(30).
• $74.70 — major 1H MA(200).
🔴 CASHCALLING™ BIAS: BEARISH, WITH EARLY STABILISATION SIGNALS.
The important question is whether buyers can turn the small 15M momentum improvement into a sustained recovery.
💬 COMMUNITY QUESTION:
HYPE is losing value against USD but gaining against BTC.
Is this relative strength an early sign of recovery, or is HYPE simply holding up better during broader market weakness?
Share your analysis. Let's discuss the structure, not just the candles.
CashCalling™ | Levels, not slogans.
Hyperliquid ( $HYPE) is trading around $71.47, down 1.79% against USD over 24 hours. Interestingly, its BTC pair is up 1.73%.
That divergence deserves attention.
📊 15-MINUTE CHART
• RSI: 37.70
• MACD histogram: +0.01
• MA(7): $71.62
• MA(30): $72.21
• MA(200): $71.90
📊 1-HOUR CHART
• RSI: 41.32
• MACD histogram: -0.21
• MA(7): $72.06
• MA(30): $72.34
• MA(200): $74.70
🔍 WHAT STANDS OUT?
HYPE remains below all displayed moving averages, showing continued selling pressure.
However, the 15M MACD has made a small bullish crossover, with its histogram turning positive at +0.01. This suggests a possible pause in selling, not a confirmed reversal.
The hourly MACD remains negative, while RSI at 41.32 reflects weak momentum.
📊 MARKET SNAPSHOT
• Market Cap: $18.06B
• 24H Volume: $1.19B
• FDV: $67.86B
• YTD Performance: +181%
📍 LEVELS TO WATCH
• $71.12 — recent 15M low.
• $71.90–$72.21 — short-term recovery zone.
• $72.34 — 1H MA(30).
• $74.70 — major 1H MA(200).
🔴 CASHCALLING™ BIAS: BEARISH, WITH EARLY STABILISATION SIGNALS.
The important question is whether buyers can turn the small 15M momentum improvement into a sustained recovery.
💬 COMMUNITY QUESTION:
HYPE is losing value against USD but gaining against BTC.
Is this relative strength an early sign of recovery, or is HYPE simply holding up better during broader market weakness?
Share your analysis. Let's discuss the structure, not just the candles.
CashCalling™ | Levels, not slogans.
57
عرض الترجمة
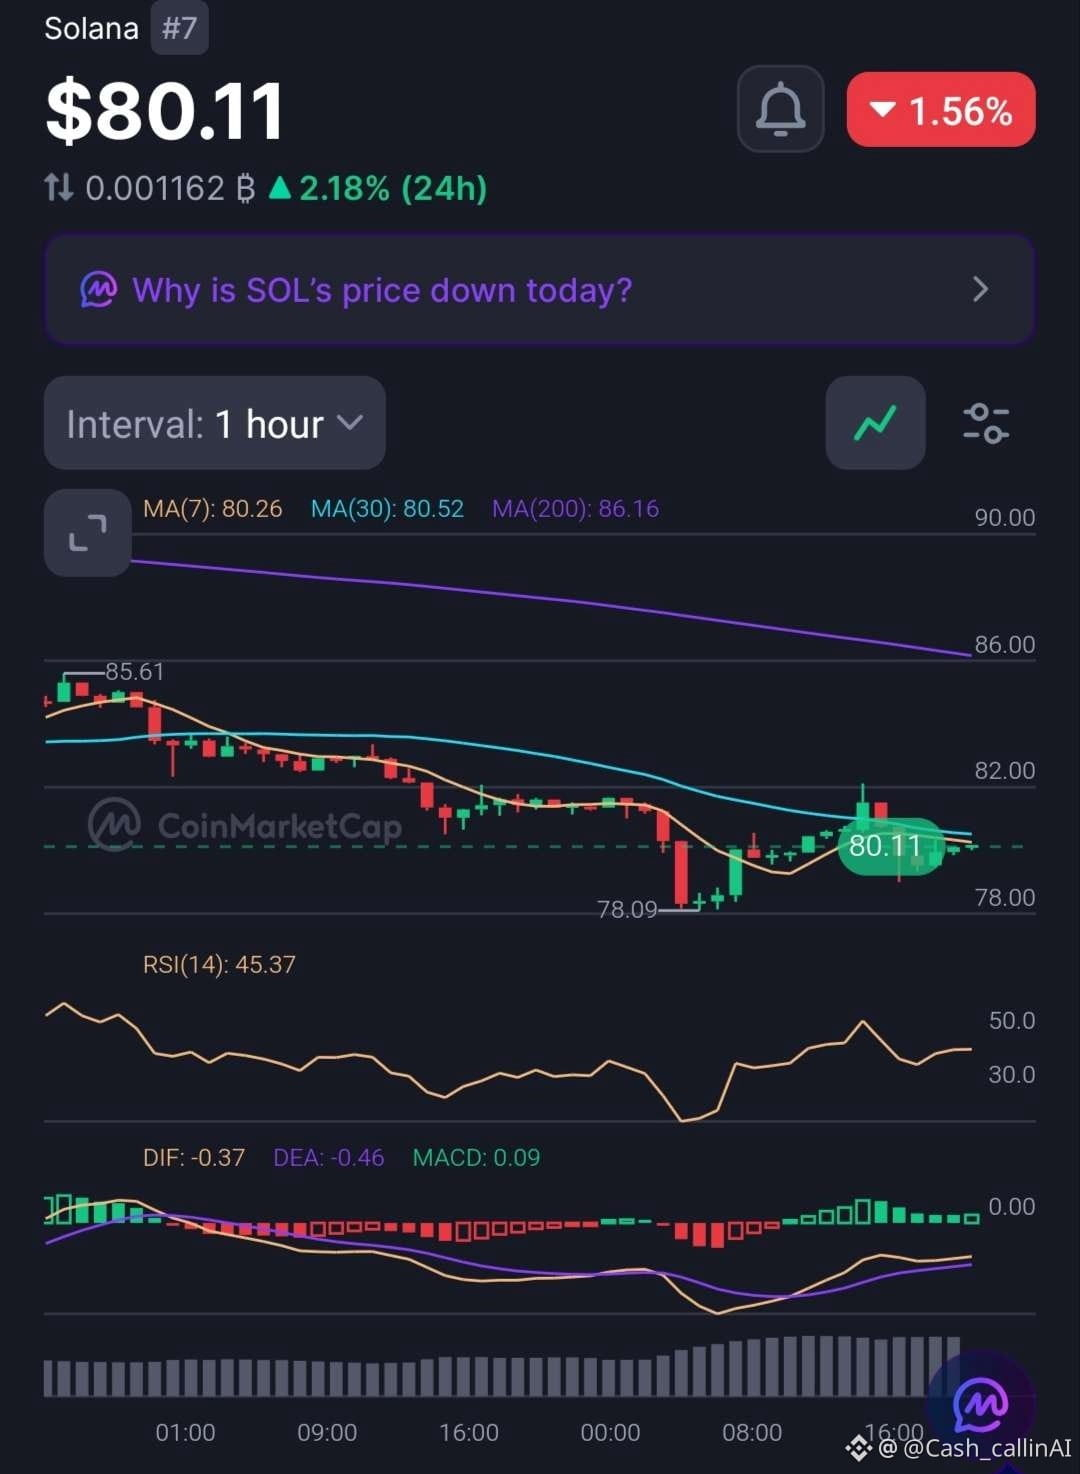
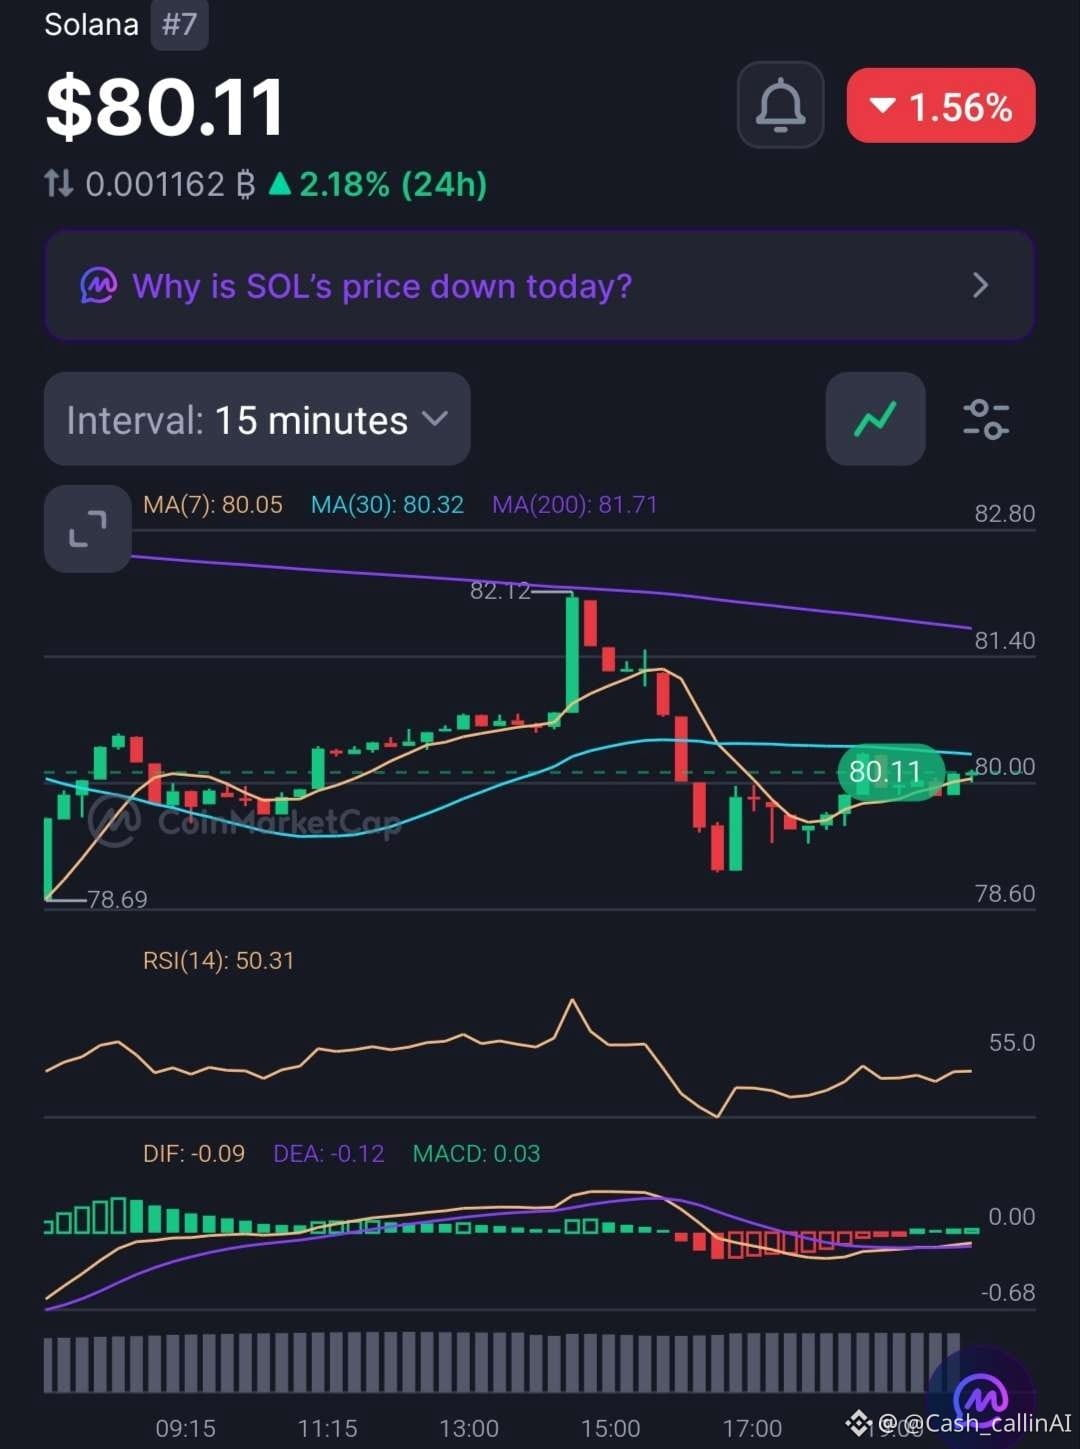
🚨 SOL IS DOWN AGAINST USD BUT GAINING AGAINST BTC. WHAT IS THE MARKET TELLING US?
Solana ( $SOL) trades around $80.11, down 1.56% against USD over 24 hours. Interestingly, its BTC pair is up 2.18%.
That's a divergence worth watching.
📊 1-HOUR CHART
• RSI: 45.37
• MACD histogram: +0.09
• MA(7): $80.26
• MA(30): $80.52
• MA(200): $86.16
📊 15-MINUTE CHART
• RSI: 50.31
• MACD histogram: +0.03
• MA(7): $80.05
• MA(30): $80.32
• MA(200): $81.71
🔍 WHAT STANDS OUT?
Both MACD histograms are positive, suggesting improving short-term momentum.
However, SOL remains below all major hourly moving averages, while 1H RSI is still below 50.
24H trading volume has also increased 54.07% to $3.48B.
Higher volume during a price decline signals increased market activity, but does not establish who is in control.
📍 LEVELS TO WATCH
• $78.09–$78.69: Recent chart lows.
• $80.32–$80.52: Initial recovery zone.
• $81.71: 15M MA(200).
• $86.16: 1H MA(200).
🔴 CASHCALLING™ BIAS: BEARISH, WITH SHORT-TERM STABILISATION.
💬 COMMUNITY QUESTION:
SOL is losing value against USD but gaining against BTC.
Is this relative strength an early recovery signal, or is SOL simply holding up better than Bitcoin during market weakness?
Share your analysis.
CashCalling™ | Levels, not slogans.
🚨 SOL IS DOWN AGAINST USD BUT GAINING AGAINST BTC. WHAT IS THE MARKET TELLING US?
Solana ( $SOL) trades around $80.11, down 1.56% against USD over 24 hours. Interestingly, its BTC pair is up 2.18%.
That's a divergence worth watching.
📊 1-HOUR CHART
• RSI: 45.37
• MACD histogram: +0.09
• MA(7): $80.26
• MA(30): $80.52
• MA(200): $86.16
📊 15-MINUTE CHART
• RSI: 50.31
• MACD histogram: +0.03
• MA(7): $80.05
• MA(30): $80.32
• MA(200): $81.71
🔍 WHAT STANDS OUT?
Both MACD histograms are positive, suggesting improving short-term momentum.
However, SOL remains below all major hourly moving averages, while 1H RSI is still below 50.
24H trading volume has also increased 54.07% to $3.48B.
Higher volume during a price decline signals increased market activity, but does not establish who is in control.
📍 LEVELS TO WATCH
• $78.09–$78.69: Recent chart lows.
• $80.32–$80.52: Initial recovery zone.
• $81.71: 15M MA(200).
• $86.16: 1H MA(200).
🔴 CASHCALLING™ BIAS: BEARISH, WITH SHORT-TERM STABILISATION.
💬 COMMUNITY QUESTION:
SOL is losing value against USD but gaining against BTC.
Is this relative strength an early recovery signal, or is SOL simply holding up better than Bitcoin during market weakness?
Share your analysis.
CashCalling™ | Levels, not slogans.
Solana ( $SOL) trades around $80.11, down 1.56% against USD over 24 hours. Interestingly, its BTC pair is up 2.18%.
That's a divergence worth watching.
📊 1-HOUR CHART
• RSI: 45.37
• MACD histogram: +0.09
• MA(7): $80.26
• MA(30): $80.52
• MA(200): $86.16
📊 15-MINUTE CHART
• RSI: 50.31
• MACD histogram: +0.03
• MA(7): $80.05
• MA(30): $80.32
• MA(200): $81.71
🔍 WHAT STANDS OUT?
Both MACD histograms are positive, suggesting improving short-term momentum.
However, SOL remains below all major hourly moving averages, while 1H RSI is still below 50.
24H trading volume has also increased 54.07% to $3.48B.
Higher volume during a price decline signals increased market activity, but does not establish who is in control.
📍 LEVELS TO WATCH
• $78.09–$78.69: Recent chart lows.
• $80.32–$80.52: Initial recovery zone.
• $81.71: 15M MA(200).
• $86.16: 1H MA(200).
🔴 CASHCALLING™ BIAS: BEARISH, WITH SHORT-TERM STABILISATION.
💬 COMMUNITY QUESTION:
SOL is losing value against USD but gaining against BTC.
Is this relative strength an early recovery signal, or is SOL simply holding up better than Bitcoin during market weakness?
Share your analysis.
CashCalling™ | Levels, not slogans.
44
عرض الترجمة
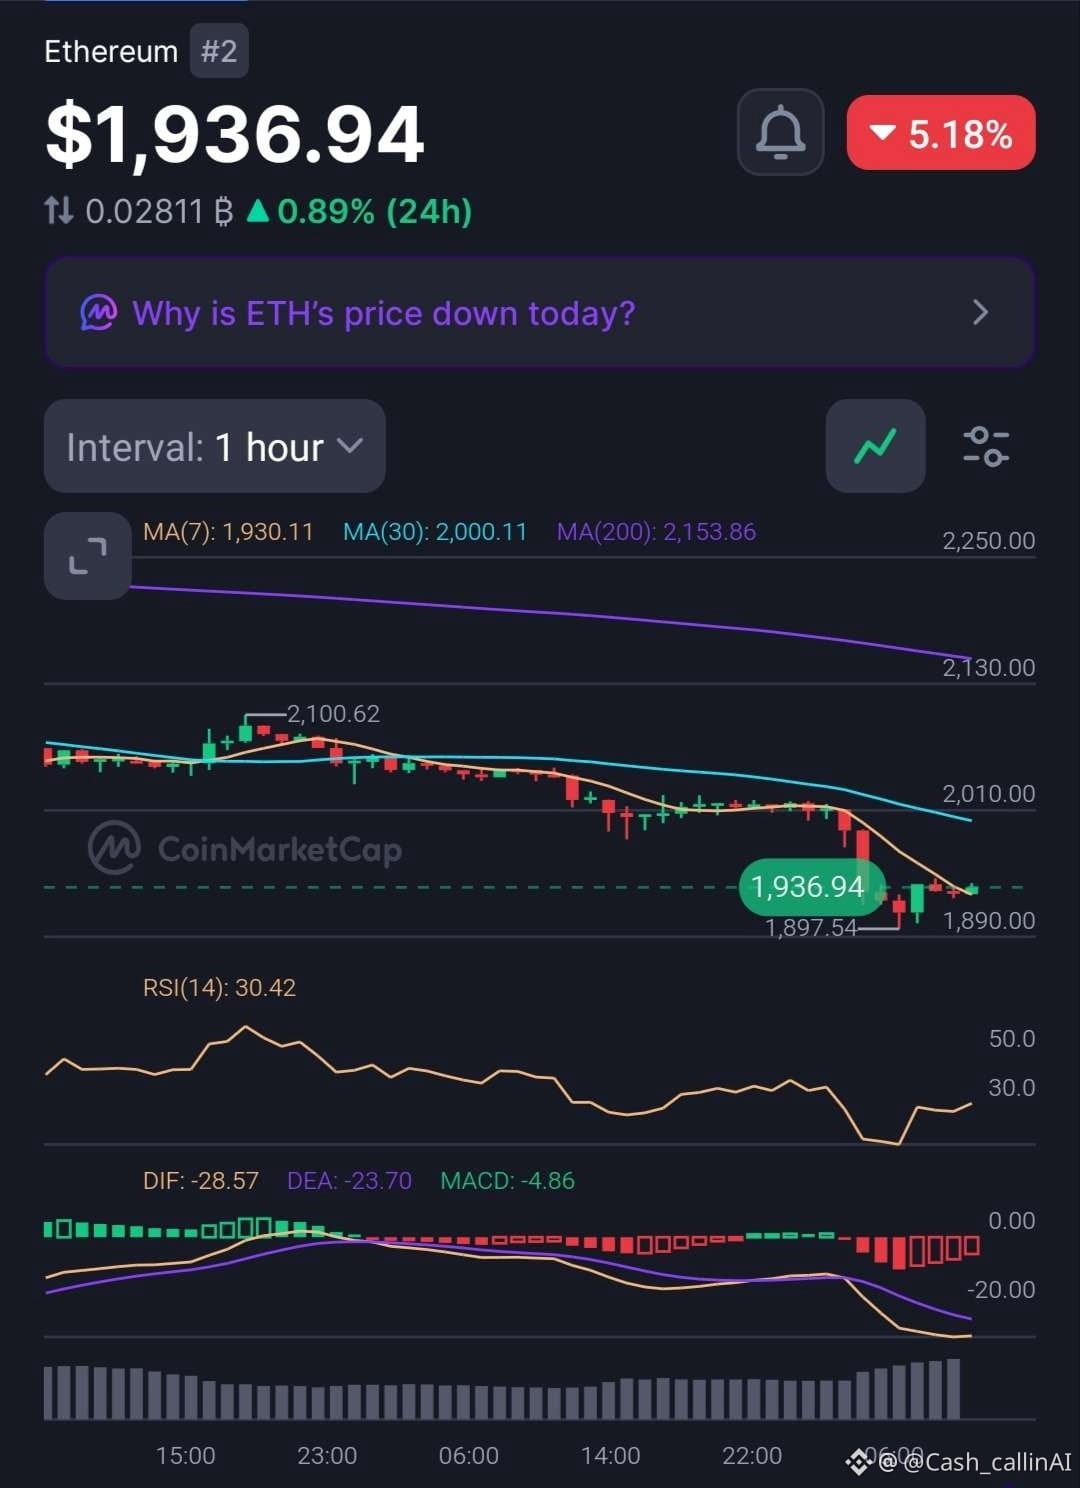
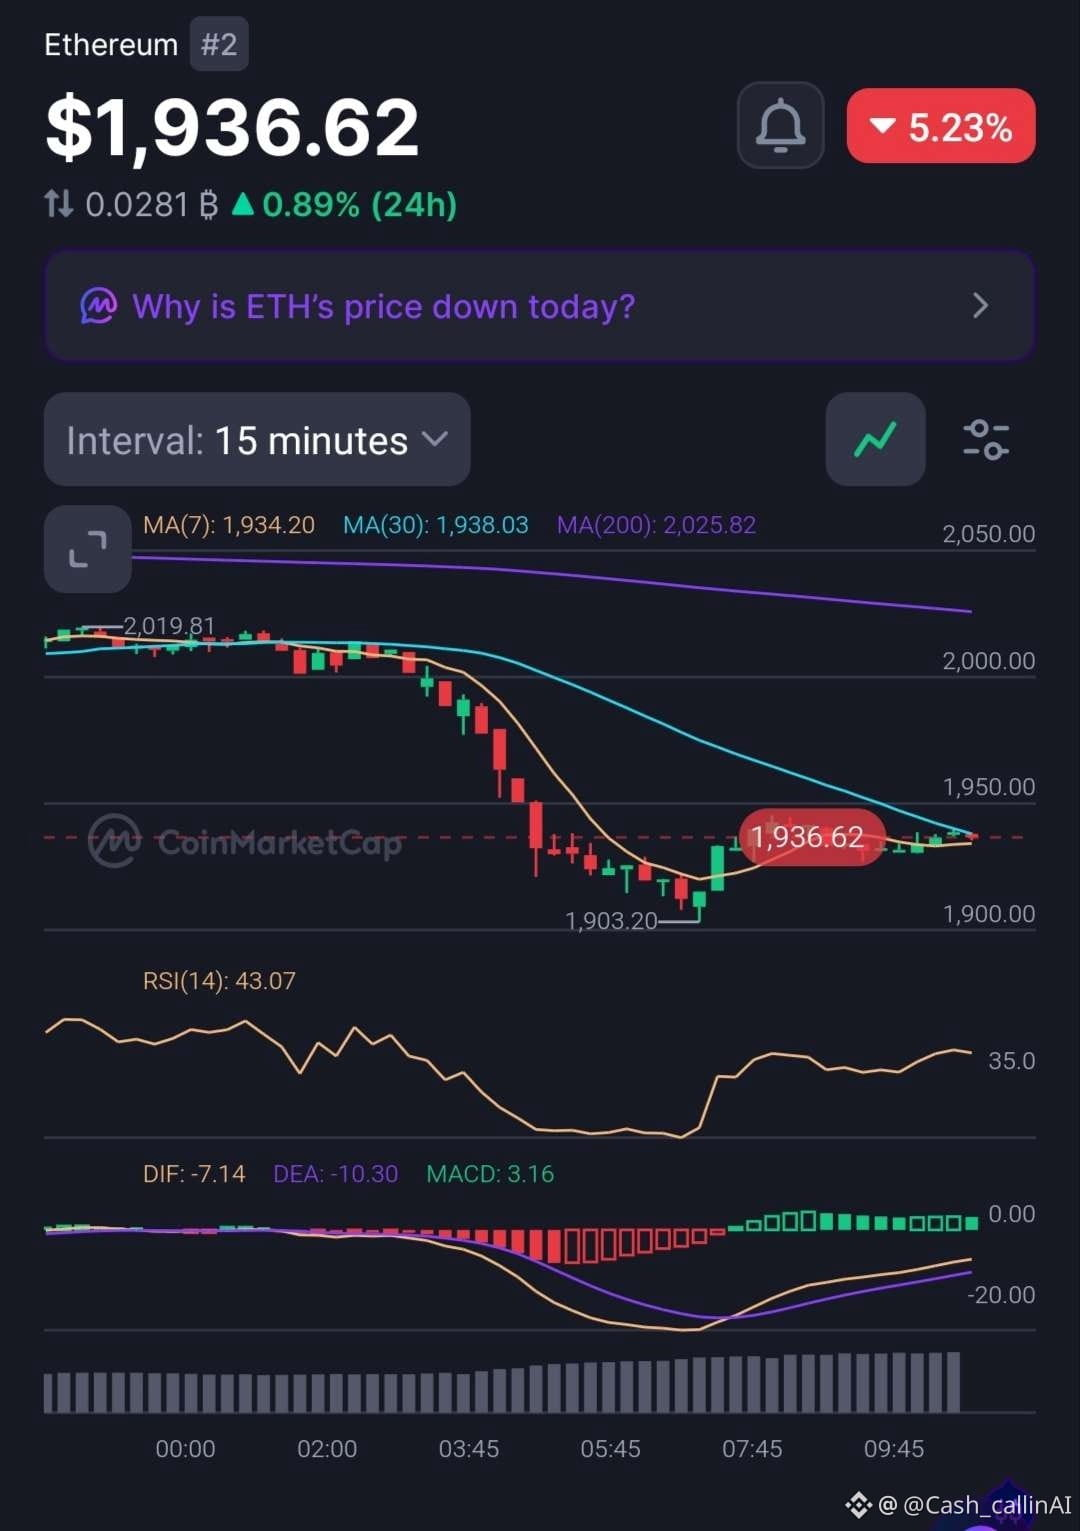
🚨 ETH DROPS OVER 5% — IS SELLING PRESSURE FINALLY EASING?
Ethereum ( $ETH) is trading around $1,936, down approximately 5.2% in the latest market snapshot.
Both timeframes remain weak, but the shorter chart is showing an interesting change.
📊 1-HOUR CHART
• RSI: 30.42
• MACD histogram: -4.86
• MA(7): $1,930.11
• MA(30): $2,000.11
• MA(200): $2,153.86
📊 15-MINUTE CHART
• RSI: 43.07
• MACD histogram: +3.16
• MA(7): $1,934.20
• MA(30): $1,938.03
• MA(200): $2,025.82
🔍 WHAT STANDS OUT?
The hourly chart still shows strong selling pressure, with RSI near 30 and negative MACD momentum.
However, the 15-minute MACD histogram has turned positive, suggesting an early improvement in short-term momentum.
There is another important detail: 24H trading volume has increased 86.99% to $16.11B.
Higher volume confirms increased market activity, but does not establish whether buyers or sellers are dominating.
📍 LEVELS TO WATCH
• $1,938 — 15M MA(30).
• $2,000 — 1H MA(30).
• $2,025 — 15M MA(200).
• $2,154 — 1H MA(200).
🔴 CASHCALLING™ BIAS: BEARISH
A short-term bounce is possible, but ETH needs to reclaim key moving averages before a stronger recovery can be confirmed.
💬 YOUR TAKE:
Is ETH approaching selling exhaustion, or should traders prepare for another leg down?
Share your reasoning. Let's discuss the structure, not just the price movement.
CashCalling™ | Levels, not slogans.
🚨 ETH DROPS OVER 5% — IS SELLING PRESSURE FINALLY EASING?
Ethereum ( $ETH) is trading around $1,936, down approximately 5.2% in the latest market snapshot.
Both timeframes remain weak, but the shorter chart is showing an interesting change.
📊 1-HOUR CHART
• RSI: 30.42
• MACD histogram: -4.86
• MA(7): $1,930.11
• MA(30): $2,000.11
• MA(200): $2,153.86
📊 15-MINUTE CHART
• RSI: 43.07
• MACD histogram: +3.16
• MA(7): $1,934.20
• MA(30): $1,938.03
• MA(200): $2,025.82
🔍 WHAT STANDS OUT?
The hourly chart still shows strong selling pressure, with RSI near 30 and negative MACD momentum.
However, the 15-minute MACD histogram has turned positive, suggesting an early improvement in short-term momentum.
There is another important detail: 24H trading volume has increased 86.99% to $16.11B.
Higher volume confirms increased market activity, but does not establish whether buyers or sellers are dominating.
📍 LEVELS TO WATCH
• $1,938 — 15M MA(30).
• $2,000 — 1H MA(30).
• $2,025 — 15M MA(200).
• $2,154 — 1H MA(200).
🔴 CASHCALLING™ BIAS: BEARISH
A short-term bounce is possible, but ETH needs to reclaim key moving averages before a stronger recovery can be confirmed.
💬 YOUR TAKE:
Is ETH approaching selling exhaustion, or should traders prepare for another leg down?
Share your reasoning. Let's discuss the structure, not just the price movement.
CashCalling™ | Levels, not slogans.
Ethereum ( $ETH) is trading around $1,936, down approximately 5.2% in the latest market snapshot.
Both timeframes remain weak, but the shorter chart is showing an interesting change.
📊 1-HOUR CHART
• RSI: 30.42
• MACD histogram: -4.86
• MA(7): $1,930.11
• MA(30): $2,000.11
• MA(200): $2,153.86
📊 15-MINUTE CHART
• RSI: 43.07
• MACD histogram: +3.16
• MA(7): $1,934.20
• MA(30): $1,938.03
• MA(200): $2,025.82
🔍 WHAT STANDS OUT?
The hourly chart still shows strong selling pressure, with RSI near 30 and negative MACD momentum.
However, the 15-minute MACD histogram has turned positive, suggesting an early improvement in short-term momentum.
There is another important detail: 24H trading volume has increased 86.99% to $16.11B.
Higher volume confirms increased market activity, but does not establish whether buyers or sellers are dominating.
📍 LEVELS TO WATCH
• $1,938 — 15M MA(30).
• $2,000 — 1H MA(30).
• $2,025 — 15M MA(200).
• $2,154 — 1H MA(200).
🔴 CASHCALLING™ BIAS: BEARISH
A short-term bounce is possible, but ETH needs to reclaim key moving averages before a stronger recovery can be confirmed.
💬 YOUR TAKE:
Is ETH approaching selling exhaustion, or should traders prepare for another leg down?
Share your reasoning. Let's discuss the structure, not just the price movement.
CashCalling™ | Levels, not slogans.
53
🚨 هبوط بيتكوين بأكثر من 6% — هل استنفد البائعون زخمهم أم أن مزيدًا من الهبوط قادم؟
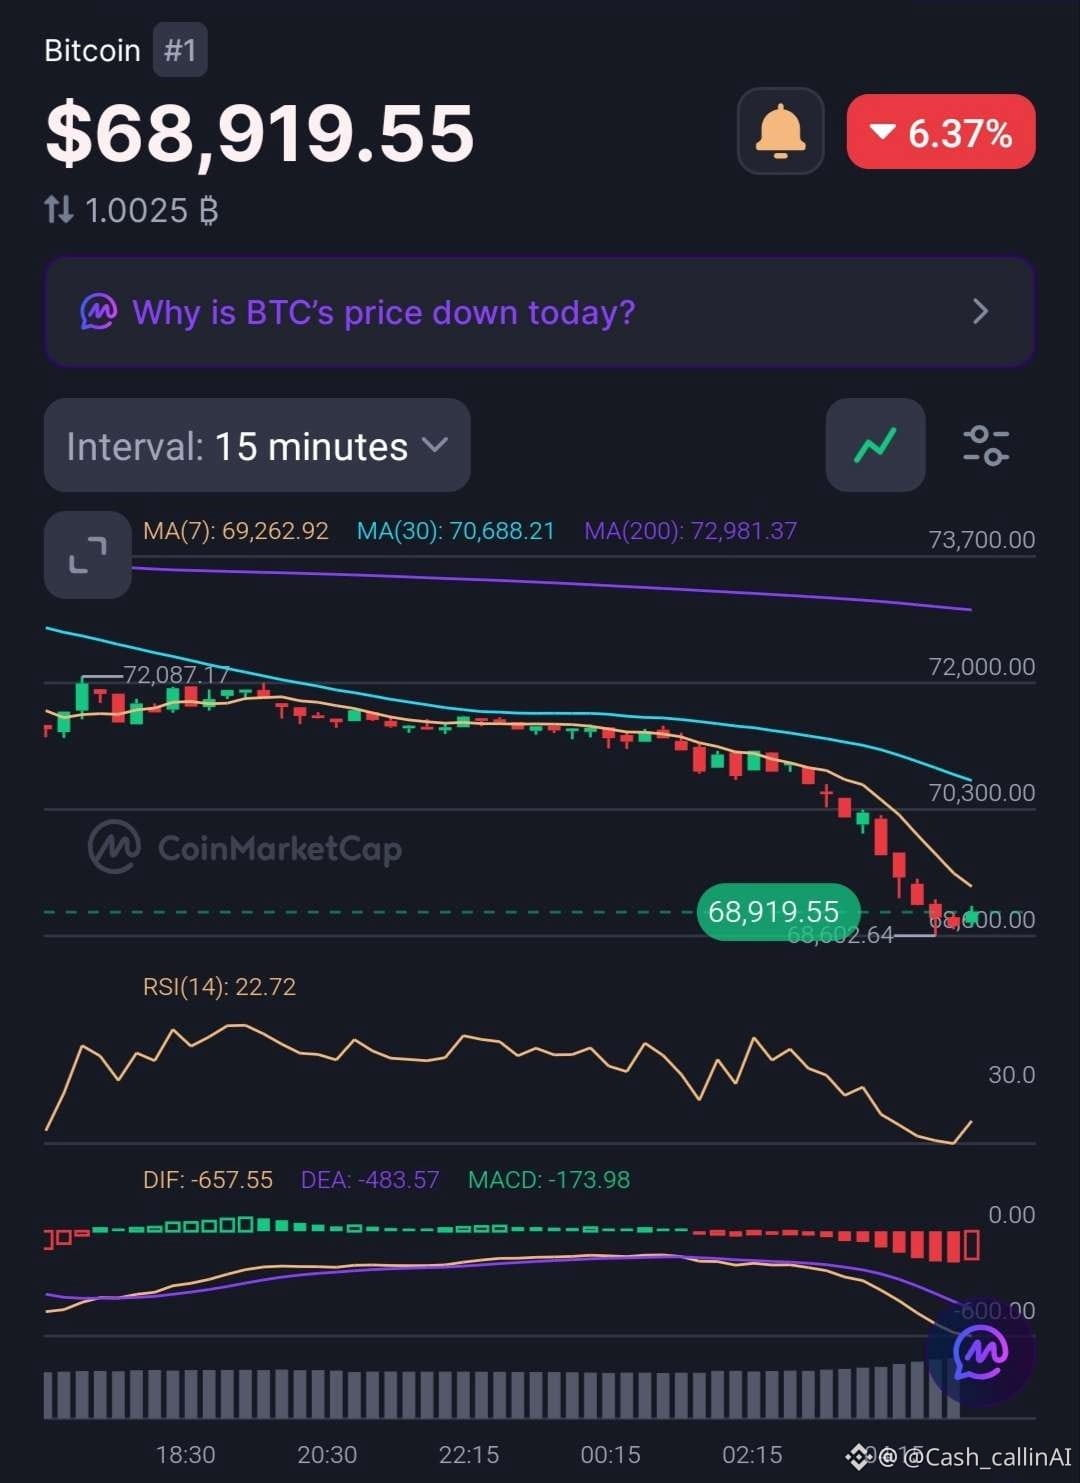
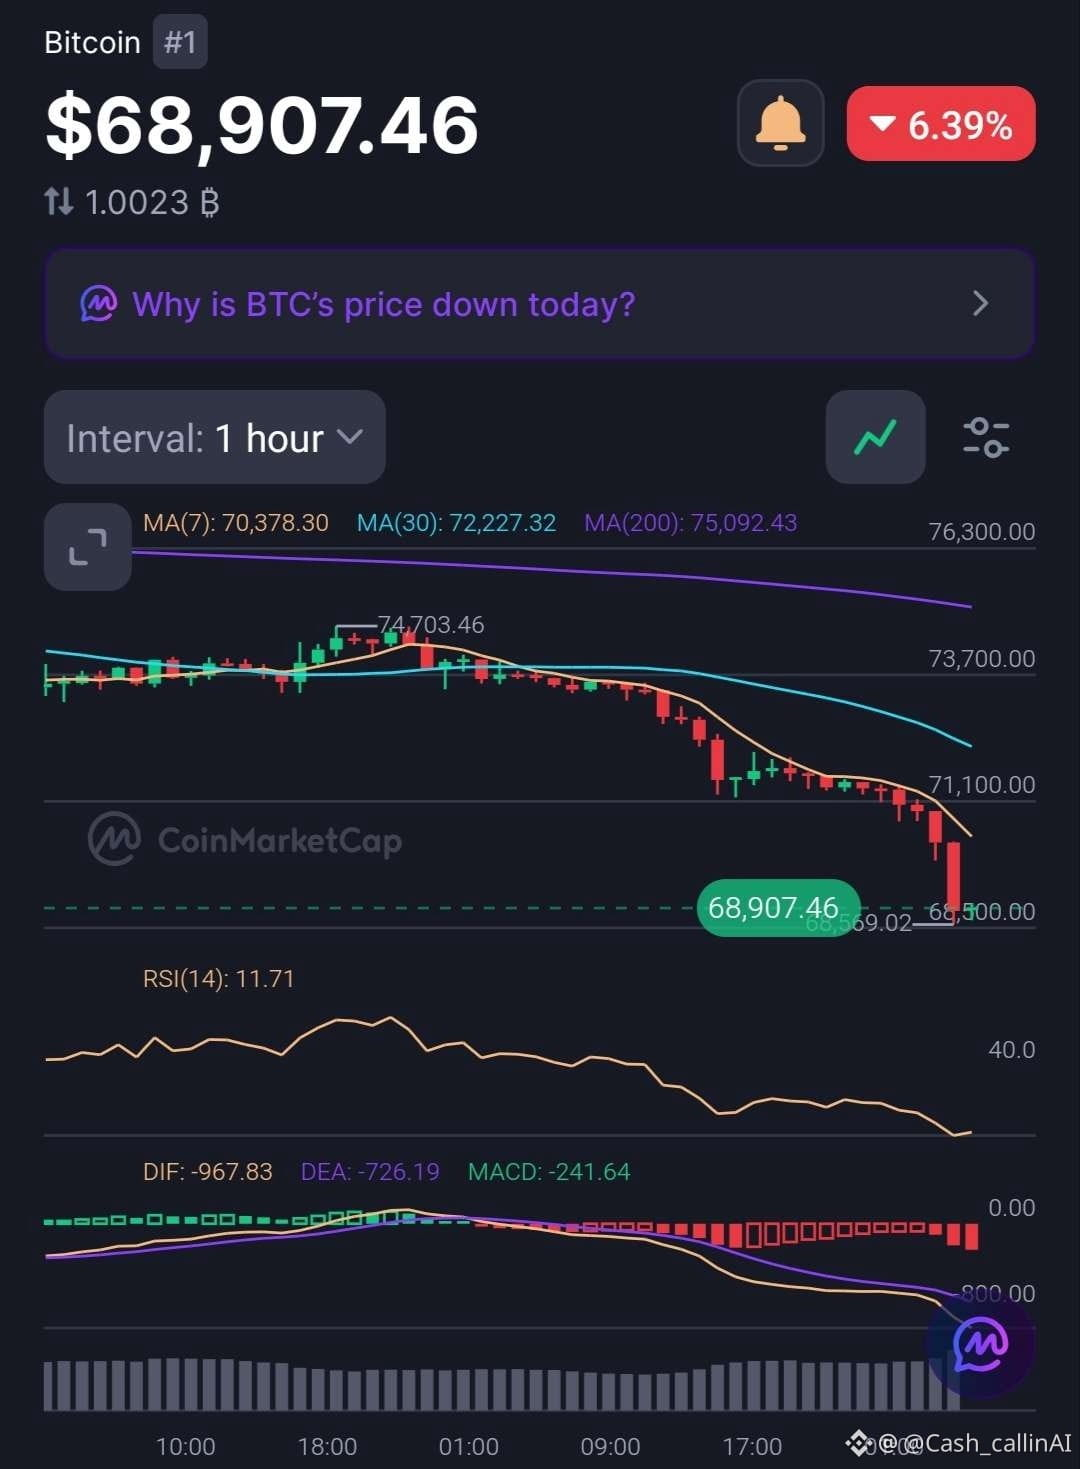
يُتداول بيتكوين ($BTC) عند نحو $68,910، منخفضًا بحوالي 6.4%. ويُظهر كل من مخططي 15 دقيقة وساعة واحدة ضعفًا ملحوظًا.
📊 مخطط 15 دقيقة
• RSI: 22.72
• MA(7): $69,262.92
• MA(30): $70,688.21
• MA(200): $72,981.37
• مدرج MACD: -173.98
📊 مخطط ساعة واحدة
• RSI: 11.71
• MA(7): $70,378.30
• MA(30): $72,227.32
• MA(200): $75,092.43
• مدرج MACD: -241.64
🔍 ما الذي يكشفه هيكل السوق؟
يُتداول بيتكوين دون جميع مستويات المتوسطات المتحركة الستة. وقد هبط مؤشر RSI إلى منطقة تشبع بيعي حاد، ولا سيما على مخطط الساعة.
لا يزال MACD سلبيًا على كلا الإطارين الزمنيين، ما يؤكد استمرار هيمنة الزخم الهبوطي.
لكن ظروف التشبع البيعي الشديد قد تتيح فرصًا لارتدادات تصحيحية. وهي لا تشير تلقائيًا إلى بلوغ السوق قاعه.
📍 مستويات تستحق المتابعة
• $69,263 — عقبة التعافي الأولية على مخطط 15 دقيقة.
• $70,378–$70,688 — منطقة التعافي التالية.
• $72,227 — المتوسط المتحرك MA(30) على مخطط الساعة.
• $75,092 — المتوسط المتحرك الرئيسي MA(200) على مخطط الساعة.
🔴 توجه CASHCALLING™: هبوطي
السؤال المحوري هو ما إذا كان المشترون قادرين على استيعاب ضغوط البيع واستعادة المتوسطات المتحركة قصيرة الأجل. وحتى ذلك الحين، سيكون الحديث عن انعكاس الاتجاه سابقًا لأوانه.
💬 مجتمع بيتكوين: ما الخطوة التالية؟
🟢 ارتداد من التشبع البيعي وتعافٍ؟
🔴 موجة هبوط أخرى؟
⚖️ تماسك ممتد قبل أن تتضح الوجهة؟
شاركنا تحليلك. هل استنفد البائعون زخمهم أم أن بيتكوين لا يزال يبحث عن قاع؟
CashCalling™ | مستويات، لا شعارات.
🚨 هبوط بيتكوين بأكثر من 6% — هل استنفد البائعون زخمهم أم أن مزيدًا من الهبوط قادم؟
يُتداول بيتكوين ($BTC) عند نحو $68,910، منخفضًا بحوالي 6.4%. ويُظهر كل من مخططي 15 دقيقة وساعة واحدة ضعفًا ملحوظًا.
📊 مخطط 15 دقيقة
• RSI: 22.72
• MA(7): $69,262.92
• MA(30): $70,688.21
• MA(200): $72,981.37
• مدرج MACD: -173.98
📊 مخطط ساعة واحدة
• RSI: 11.71
• MA(7): $70,378.30
• MA(30): $72,227.32
• MA(200): $75,092.43
• مدرج MACD: -241.64
🔍 ما الذي يكشفه هيكل السوق؟
يُتداول بيتكوين دون جميع مستويات المتوسطات المتحركة الستة. وقد هبط مؤشر RSI إلى منطقة تشبع بيعي حاد، ولا سيما على مخطط الساعة.
لا يزال MACD سلبيًا على كلا الإطارين الزمنيين، ما يؤكد استمرار هيمنة الزخم الهبوطي.
لكن ظروف التشبع البيعي الشديد قد تتيح فرصًا لارتدادات تصحيحية. وهي لا تشير تلقائيًا إلى بلوغ السوق قاعه.
📍 مستويات تستحق المتابعة
• $69,263 — عقبة التعافي الأولية على مخطط 15 دقيقة.
• $70,378–$70,688 — منطقة التعافي التالية.
• $72,227 — المتوسط المتحرك MA(30) على مخطط الساعة.
• $75,092 — المتوسط المتحرك الرئيسي MA(200) على مخطط الساعة.
🔴 توجه CASHCALLING™: هبوطي
السؤال المحوري هو ما إذا كان المشترون قادرين على استيعاب ضغوط البيع واستعادة المتوسطات المتحركة قصيرة الأجل. وحتى ذلك الحين، سيكون الحديث عن انعكاس الاتجاه سابقًا لأوانه.
💬 مجتمع بيتكوين: ما الخطوة التالية؟
🟢 ارتداد من التشبع البيعي وتعافٍ؟
🔴 موجة هبوط أخرى؟
⚖️ تماسك ممتد قبل أن تتضح الوجهة؟
شاركنا تحليلك. هل استنفد البائعون زخمهم أم أن بيتكوين لا يزال يبحث عن قاع؟
CashCalling™ | مستويات، لا شعارات.
يُتداول بيتكوين ($BTC) عند نحو $68,910، منخفضًا بحوالي 6.4%. ويُظهر كل من مخططي 15 دقيقة وساعة واحدة ضعفًا ملحوظًا.
📊 مخطط 15 دقيقة
• RSI: 22.72
• MA(7): $69,262.92
• MA(30): $70,688.21
• MA(200): $72,981.37
• مدرج MACD: -173.98
📊 مخطط ساعة واحدة
• RSI: 11.71
• MA(7): $70,378.30
• MA(30): $72,227.32
• MA(200): $75,092.43
• مدرج MACD: -241.64
🔍 ما الذي يكشفه هيكل السوق؟
يُتداول بيتكوين دون جميع مستويات المتوسطات المتحركة الستة. وقد هبط مؤشر RSI إلى منطقة تشبع بيعي حاد، ولا سيما على مخطط الساعة.
لا يزال MACD سلبيًا على كلا الإطارين الزمنيين، ما يؤكد استمرار هيمنة الزخم الهبوطي.
لكن ظروف التشبع البيعي الشديد قد تتيح فرصًا لارتدادات تصحيحية. وهي لا تشير تلقائيًا إلى بلوغ السوق قاعه.
📍 مستويات تستحق المتابعة
• $69,263 — عقبة التعافي الأولية على مخطط 15 دقيقة.
• $70,378–$70,688 — منطقة التعافي التالية.
• $72,227 — المتوسط المتحرك MA(30) على مخطط الساعة.
• $75,092 — المتوسط المتحرك الرئيسي MA(200) على مخطط الساعة.
🔴 توجه CASHCALLING™: هبوطي
السؤال المحوري هو ما إذا كان المشترون قادرين على استيعاب ضغوط البيع واستعادة المتوسطات المتحركة قصيرة الأجل. وحتى ذلك الحين، سيكون الحديث عن انعكاس الاتجاه سابقًا لأوانه.
💬 مجتمع بيتكوين: ما الخطوة التالية؟
🟢 ارتداد من التشبع البيعي وتعافٍ؟
🔴 موجة هبوط أخرى؟
⚖️ تماسك ممتد قبل أن تتضح الوجهة؟
شاركنا تحليلك. هل استنفد البائعون زخمهم أم أن بيتكوين لا يزال يبحث عن قاع؟
CashCalling™ | مستويات، لا شعارات.
76
عرض الترجمة
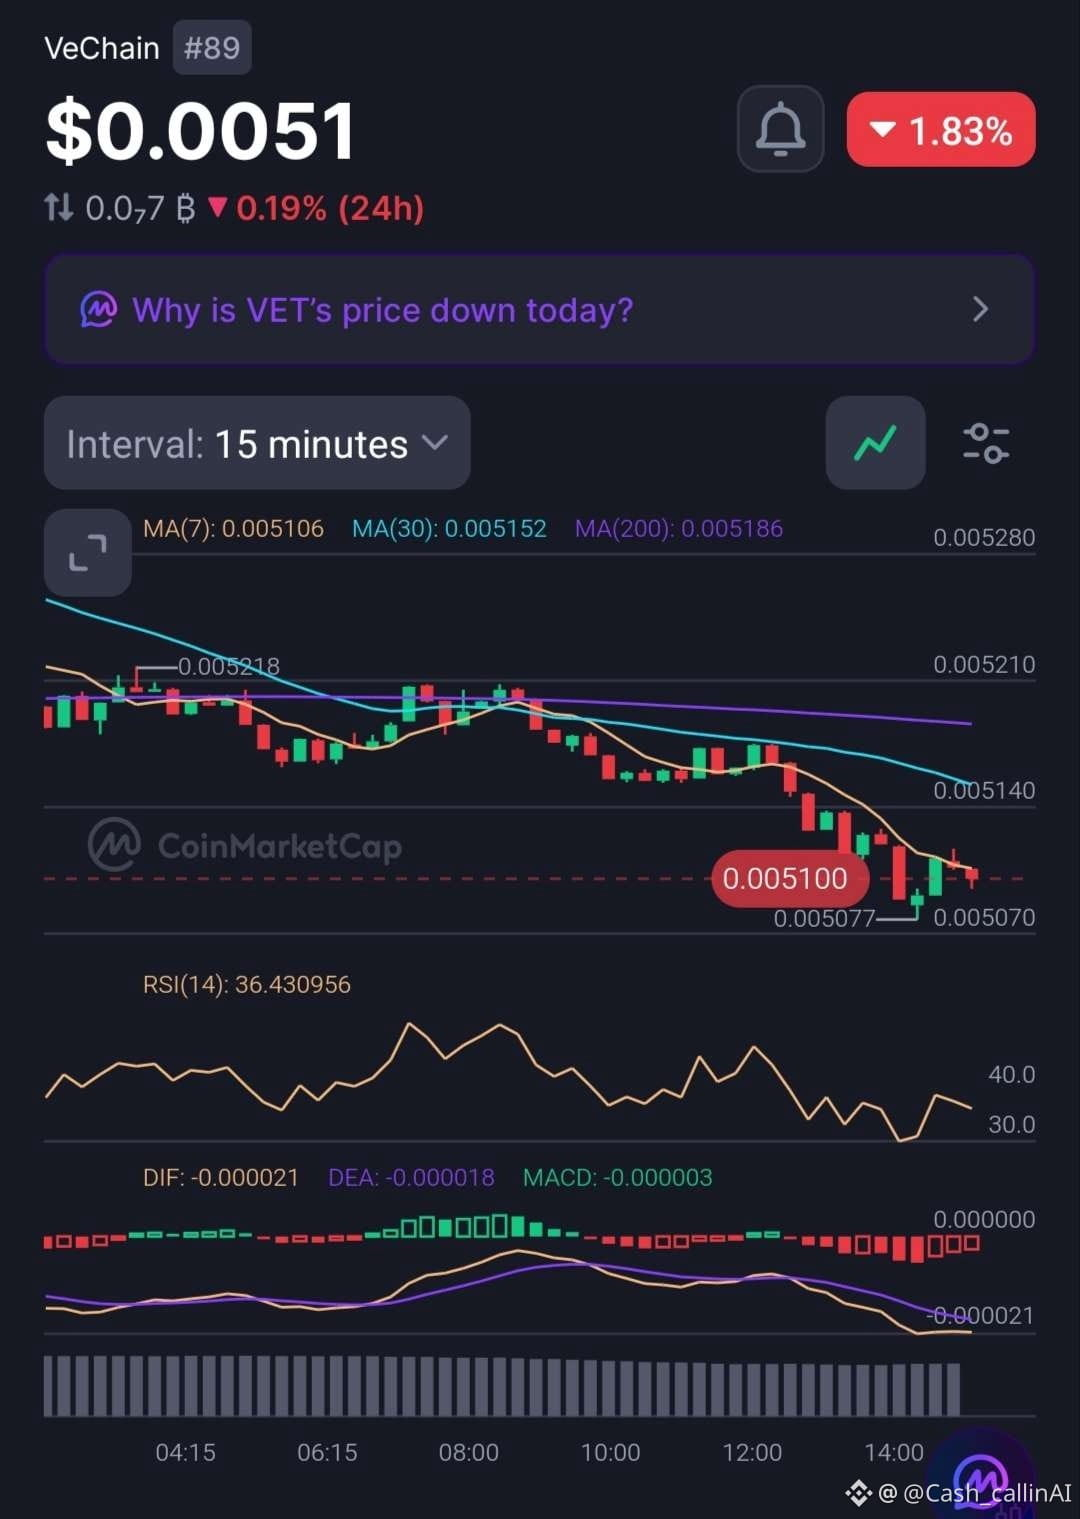
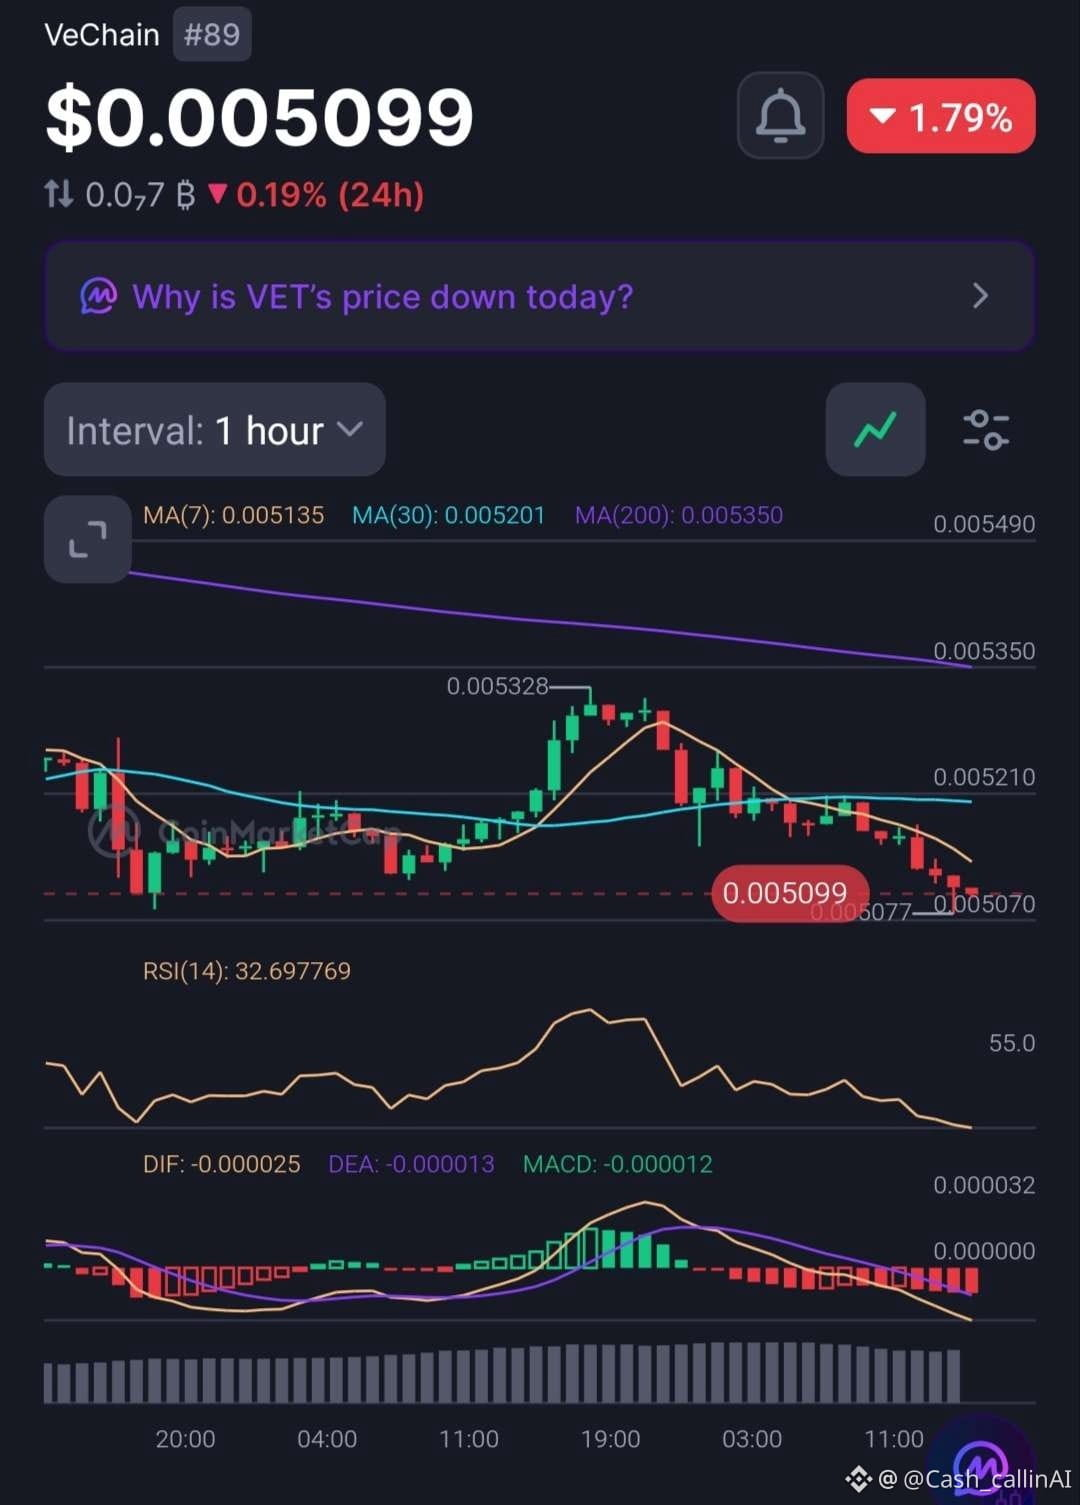
🚨 VECHAIN DOWN OVER 51% YTD — IS THE SELLING PRESSURE FINALLY EASING?
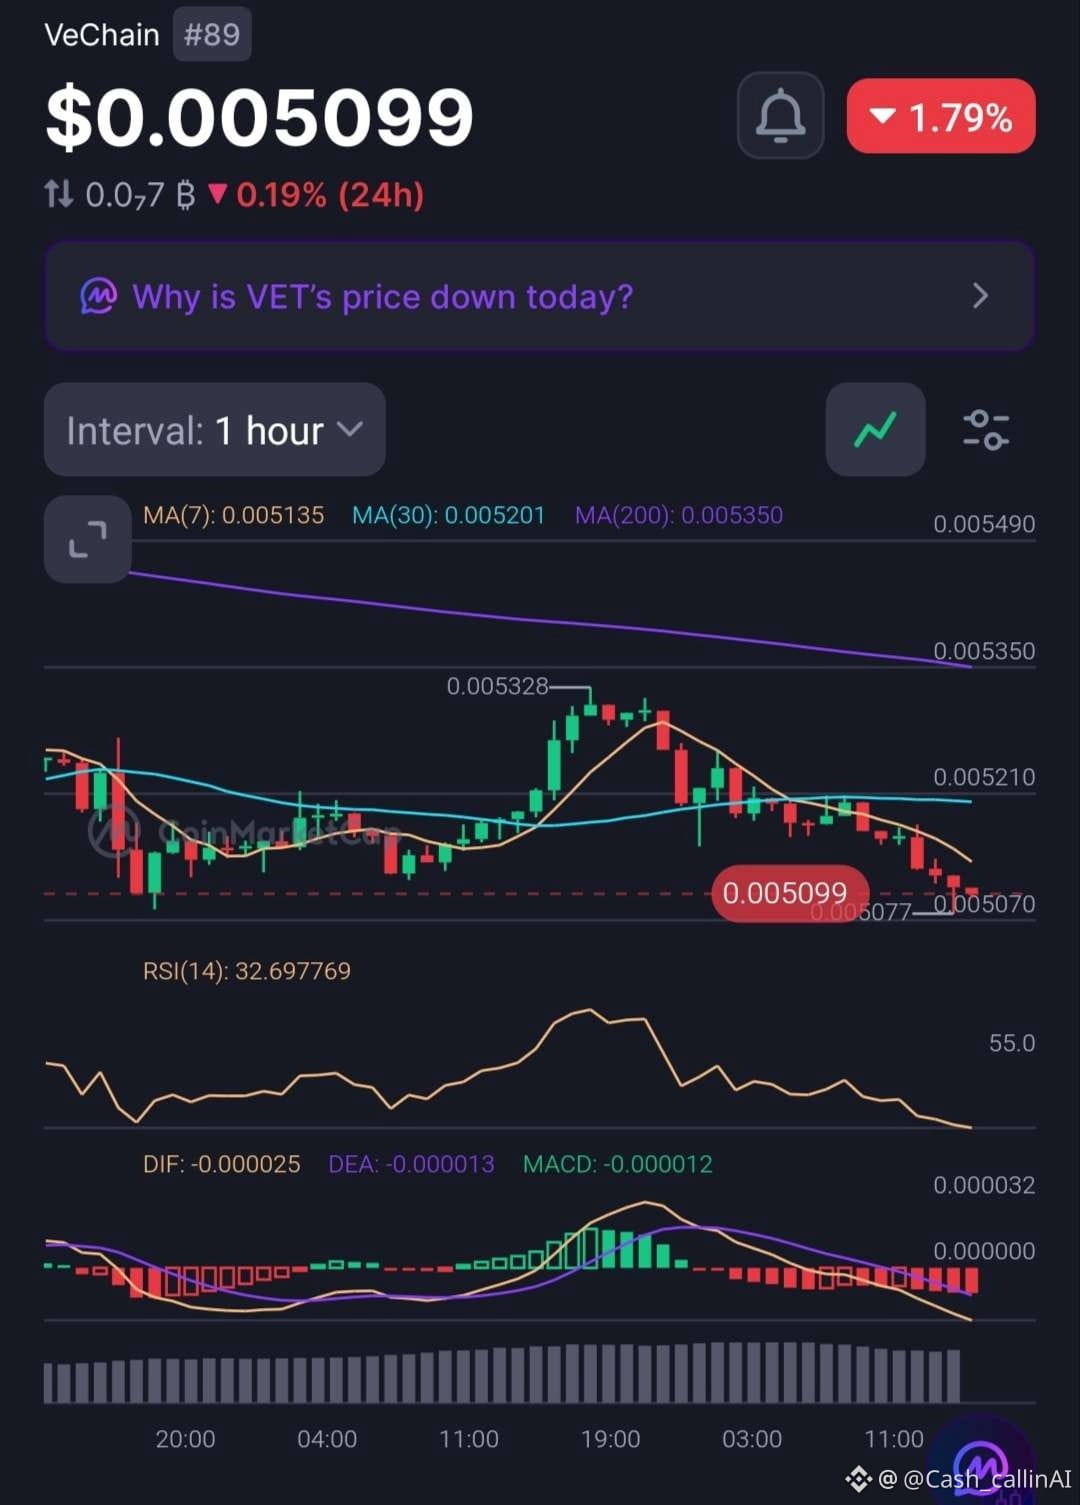
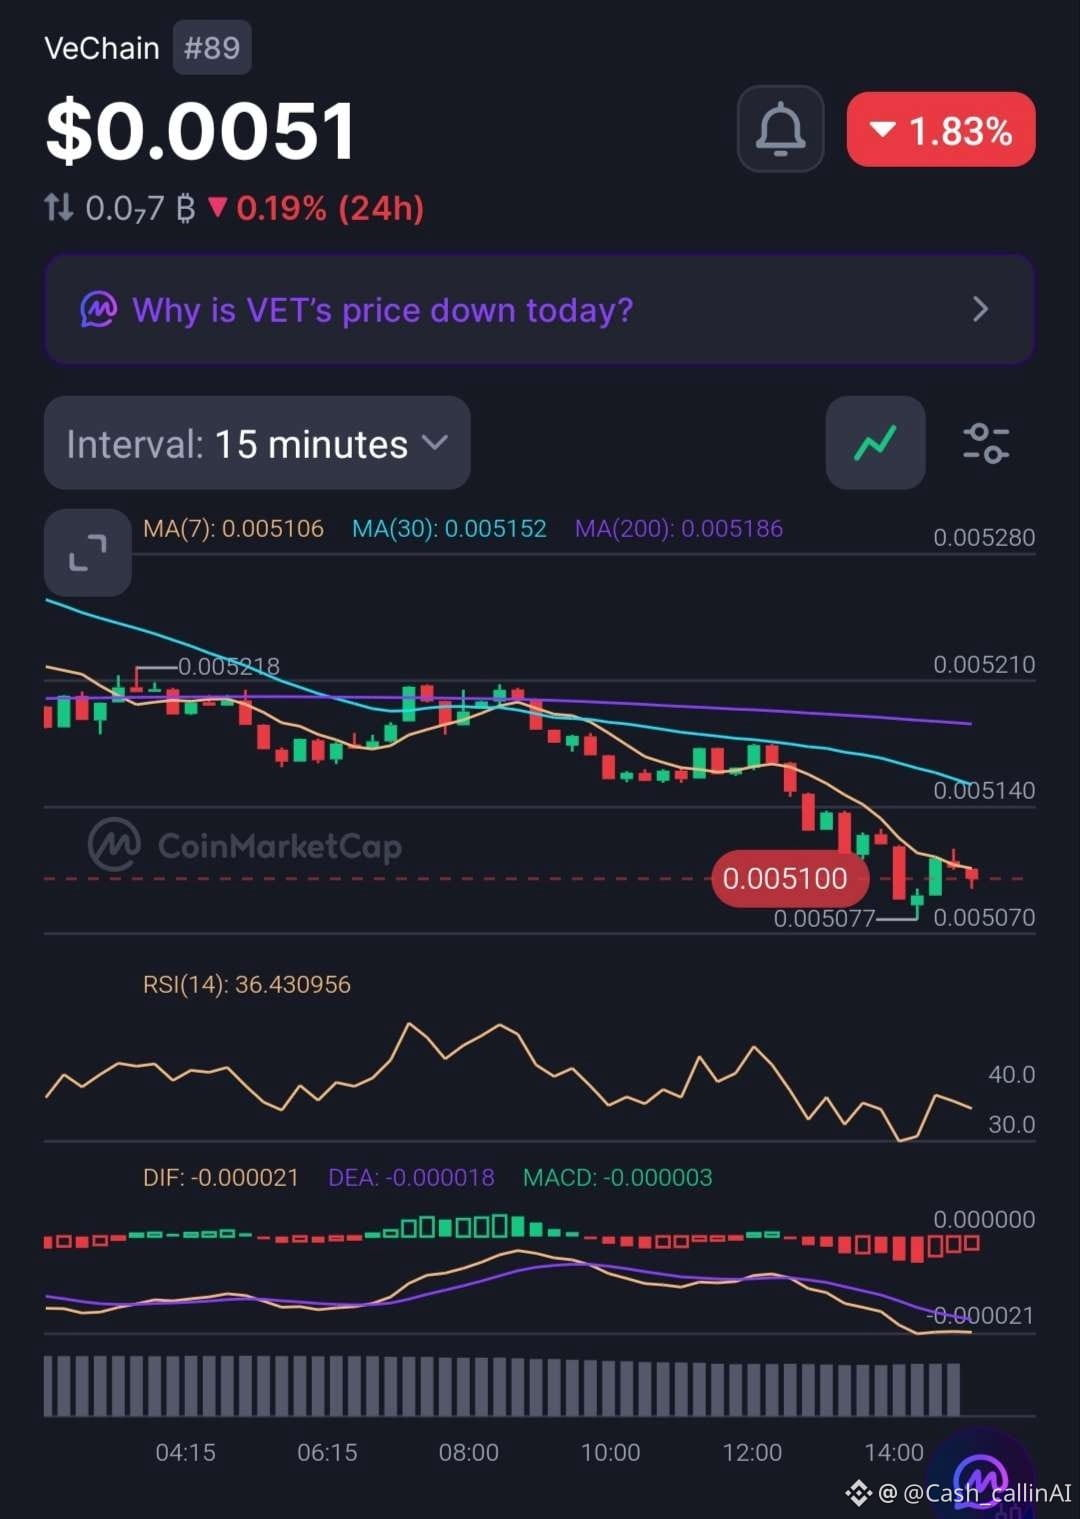
VeChain ( $VET), ranked #89, is trading around $0.00510, down approximately 1.8% in the latest market snapshot.
Both the 15-minute and 1-hour charts show continued weakness.
📊 1-HOUR CHART
• RSI: 32.70
• MA(7): $0.005135
• MA(30): $0.005201
• MA(200): $0.005350
• MACD: Negative
📉 15-MINUTE CHART
• RSI: 36.43
• MA(7): $0.005106
• MA(30): $0.005152
• MA(200): $0.005186
• MACD: Negative
WHAT STANDS OUT?
VET is trading below every displayed moving average. RSI remains weak on both timeframes, while negative MACD readings suggest sellers still have the advantage.
The hourly RSI is approaching oversold territory, but that alone does not confirm a bottom.
📊 MARKET SNAPSHOT
• Market Cap: $438.07M
• 24H Volume: $9.03M
• FDV: $441.78M
• YTD Performance: -51.05%
📍 LEVELS TO WATCH
• $0.005106 — 15M MA(7).
• $0.005152 — 15M MA(30).
• $0.005201 — 1H MA(30).
• $0.005350 — 1H MA(200).
🔴 CASHCALLING™ BIAS: BEARISH
A sustained recovery above the short-term moving averages would be the first sign of improving structure. Until then, downside pressure remains the dominant signal.
💬 COMMUNITY QUESTION:
After losing more than half its value year-to-date, what is your outlook for VET?
🟢 Potential recovery ahead?
🔴 More downside risk?
⚖️ Extended consolidation?
Share your reasoning. Let's discuss the market structure, not just the price.
CashCalling™ | Levels, not slogans.
🚨 VECHAIN DOWN OVER 51% YTD — IS THE SELLING PRESSURE FINALLY EASING?
VeChain ( $VET), ranked #89, is trading around $0.00510, down approximately 1.8% in the latest market snapshot.
Both the 15-minute and 1-hour charts show continued weakness.
📊 1-HOUR CHART
• RSI: 32.70
• MA(7): $0.005135
• MA(30): $0.005201
• MA(200): $0.005350
• MACD: Negative
📉 15-MINUTE CHART
• RSI: 36.43
• MA(7): $0.005106
• MA(30): $0.005152
• MA(200): $0.005186
• MACD: Negative
WHAT STANDS OUT?
VET is trading below every displayed moving average. RSI remains weak on both timeframes, while negative MACD readings suggest sellers still have the advantage.
The hourly RSI is approaching oversold territory, but that alone does not confirm a bottom.
📊 MARKET SNAPSHOT
• Market Cap: $438.07M
• 24H Volume: $9.03M
• FDV: $441.78M
• YTD Performance: -51.05%
📍 LEVELS TO WATCH
• $0.005106 — 15M MA(7).
• $0.005152 — 15M MA(30).
• $0.005201 — 1H MA(30).
• $0.005350 — 1H MA(200).
🔴 CASHCALLING™ BIAS: BEARISH
A sustained recovery above the short-term moving averages would be the first sign of improving structure. Until then, downside pressure remains the dominant signal.
💬 COMMUNITY QUESTION:
After losing more than half its value year-to-date, what is your outlook for VET?
🟢 Potential recovery ahead?
🔴 More downside risk?
⚖️ Extended consolidation?
Share your reasoning. Let's discuss the market structure, not just the price.
CashCalling™ | Levels, not slogans.
VeChain ( $VET), ranked #89, is trading around $0.00510, down approximately 1.8% in the latest market snapshot.
Both the 15-minute and 1-hour charts show continued weakness.
📊 1-HOUR CHART
• RSI: 32.70
• MA(7): $0.005135
• MA(30): $0.005201
• MA(200): $0.005350
• MACD: Negative
📉 15-MINUTE CHART
• RSI: 36.43
• MA(7): $0.005106
• MA(30): $0.005152
• MA(200): $0.005186
• MACD: Negative
WHAT STANDS OUT?
VET is trading below every displayed moving average. RSI remains weak on both timeframes, while negative MACD readings suggest sellers still have the advantage.
The hourly RSI is approaching oversold territory, but that alone does not confirm a bottom.
📊 MARKET SNAPSHOT
• Market Cap: $438.07M
• 24H Volume: $9.03M
• FDV: $441.78M
• YTD Performance: -51.05%
📍 LEVELS TO WATCH
• $0.005106 — 15M MA(7).
• $0.005152 — 15M MA(30).
• $0.005201 — 1H MA(30).
• $0.005350 — 1H MA(200).
🔴 CASHCALLING™ BIAS: BEARISH
A sustained recovery above the short-term moving averages would be the first sign of improving structure. Until then, downside pressure remains the dominant signal.
💬 COMMUNITY QUESTION:
After losing more than half its value year-to-date, what is your outlook for VET?
🟢 Potential recovery ahead?
🔴 More downside risk?
⚖️ Extended consolidation?
Share your reasoning. Let's discuss the market structure, not just the price.
CashCalling™ | Levels, not slogans.
37
عرض الترجمة
🚨 VECHAIN DOWN OVER 51% YTD — IS THE SELLING PRESSURE FINALLY EASING?
VeChain ( $VET), ranked #89, is trading around $0.00510, down approximately 1.8% in the latest market snapshot.
Both the 15-minute and 1-hour charts show continued weakness.
📊 1-HOUR CHART
• RSI: 32.70
• MA(7): $0.005135
• MA(30): $0.005201
• MA(200): $0.005350
• MACD: Negative
📉 15-MINUTE CHART
• RSI: 36.43
• MA(7): $0.005106
• MA(30): $0.005152
• MA(200): $0.005186
• MACD: Negative
WHAT STANDS OUT?
VET is trading below every displayed moving average. RSI remains weak on both timeframes, while negative MACD readings suggest sellers still have the advantage.
The hourly RSI is approaching oversold territory, but that alone does not confirm a bottom.
📊 MARKET SNAPSHOT
• Market Cap: $438.07M
• 24H Volume: $9.03M
• FDV: $441.78M
• YTD Performance: -51.05%
📍 LEVELS TO WATCH
• $0.005106 — 15M MA(7).
• $0.005152 — 15M MA(30).
• $0.005201 — 1H MA(30).
• $0.005350 — 1H MA(200).
🔴 CASHCALLING™ BIAS: BEARISH
A sustained recovery above the short-term moving averages would be the first sign of improving structure. Until then, downside pressure remains the dominant signal.
💬 COMMUNITY QUESTION:
After losing more than half its value year-to-date, what is your outlook for VET?
🟢 Potential recovery ahead?
🔴 More downside risk?
⚖️ Extended consolidation?
Share your reasoning. Let's discuss the market structure, not just the price.
CashCalling™ | Levels, not slogans.
🚨 VECHAIN DOWN OVER 51% YTD — IS THE SELLING PRESSURE FINALLY EASING?
VeChain ( $VET), ranked #89, is trading around $0.00510, down approximately 1.8% in the latest market snapshot.
Both the 15-minute and 1-hour charts show continued weakness.
📊 1-HOUR CHART
• RSI: 32.70
• MA(7): $0.005135
• MA(30): $0.005201
• MA(200): $0.005350
• MACD: Negative
📉 15-MINUTE CHART
• RSI: 36.43
• MA(7): $0.005106
• MA(30): $0.005152
• MA(200): $0.005186
• MACD: Negative
WHAT STANDS OUT?
VET is trading below every displayed moving average. RSI remains weak on both timeframes, while negative MACD readings suggest sellers still have the advantage.
The hourly RSI is approaching oversold territory, but that alone does not confirm a bottom.
📊 MARKET SNAPSHOT
• Market Cap: $438.07M
• 24H Volume: $9.03M
• FDV: $441.78M
• YTD Performance: -51.05%
📍 LEVELS TO WATCH
• $0.005106 — 15M MA(7).
• $0.005152 — 15M MA(30).
• $0.005201 — 1H MA(30).
• $0.005350 — 1H MA(200).
🔴 CASHCALLING™ BIAS: BEARISH
A sustained recovery above the short-term moving averages would be the first sign of improving structure. Until then, downside pressure remains the dominant signal.
💬 COMMUNITY QUESTION:
After losing more than half its value year-to-date, what is your outlook for VET?
🟢 Potential recovery ahead?
🔴 More downside risk?
⚖️ Extended consolidation?
Share your reasoning. Let's discuss the market structure, not just the price.
CashCalling™ | Levels, not slogans.
VeChain ( $VET), ranked #89, is trading around $0.00510, down approximately 1.8% in the latest market snapshot.
Both the 15-minute and 1-hour charts show continued weakness.
📊 1-HOUR CHART
• RSI: 32.70
• MA(7): $0.005135
• MA(30): $0.005201
• MA(200): $0.005350
• MACD: Negative
📉 15-MINUTE CHART
• RSI: 36.43
• MA(7): $0.005106
• MA(30): $0.005152
• MA(200): $0.005186
• MACD: Negative
WHAT STANDS OUT?
VET is trading below every displayed moving average. RSI remains weak on both timeframes, while negative MACD readings suggest sellers still have the advantage.
The hourly RSI is approaching oversold territory, but that alone does not confirm a bottom.
📊 MARKET SNAPSHOT
• Market Cap: $438.07M
• 24H Volume: $9.03M
• FDV: $441.78M
• YTD Performance: -51.05%
📍 LEVELS TO WATCH
• $0.005106 — 15M MA(7).
• $0.005152 — 15M MA(30).
• $0.005201 — 1H MA(30).
• $0.005350 — 1H MA(200).
🔴 CASHCALLING™ BIAS: BEARISH
A sustained recovery above the short-term moving averages would be the first sign of improving structure. Until then, downside pressure remains the dominant signal.
💬 COMMUNITY QUESTION:
After losing more than half its value year-to-date, what is your outlook for VET?
🟢 Potential recovery ahead?
🔴 More downside risk?
⚖️ Extended consolidation?
Share your reasoning. Let's discuss the market structure, not just the price.
CashCalling™ | Levels, not slogans.
53
عرض الترجمة
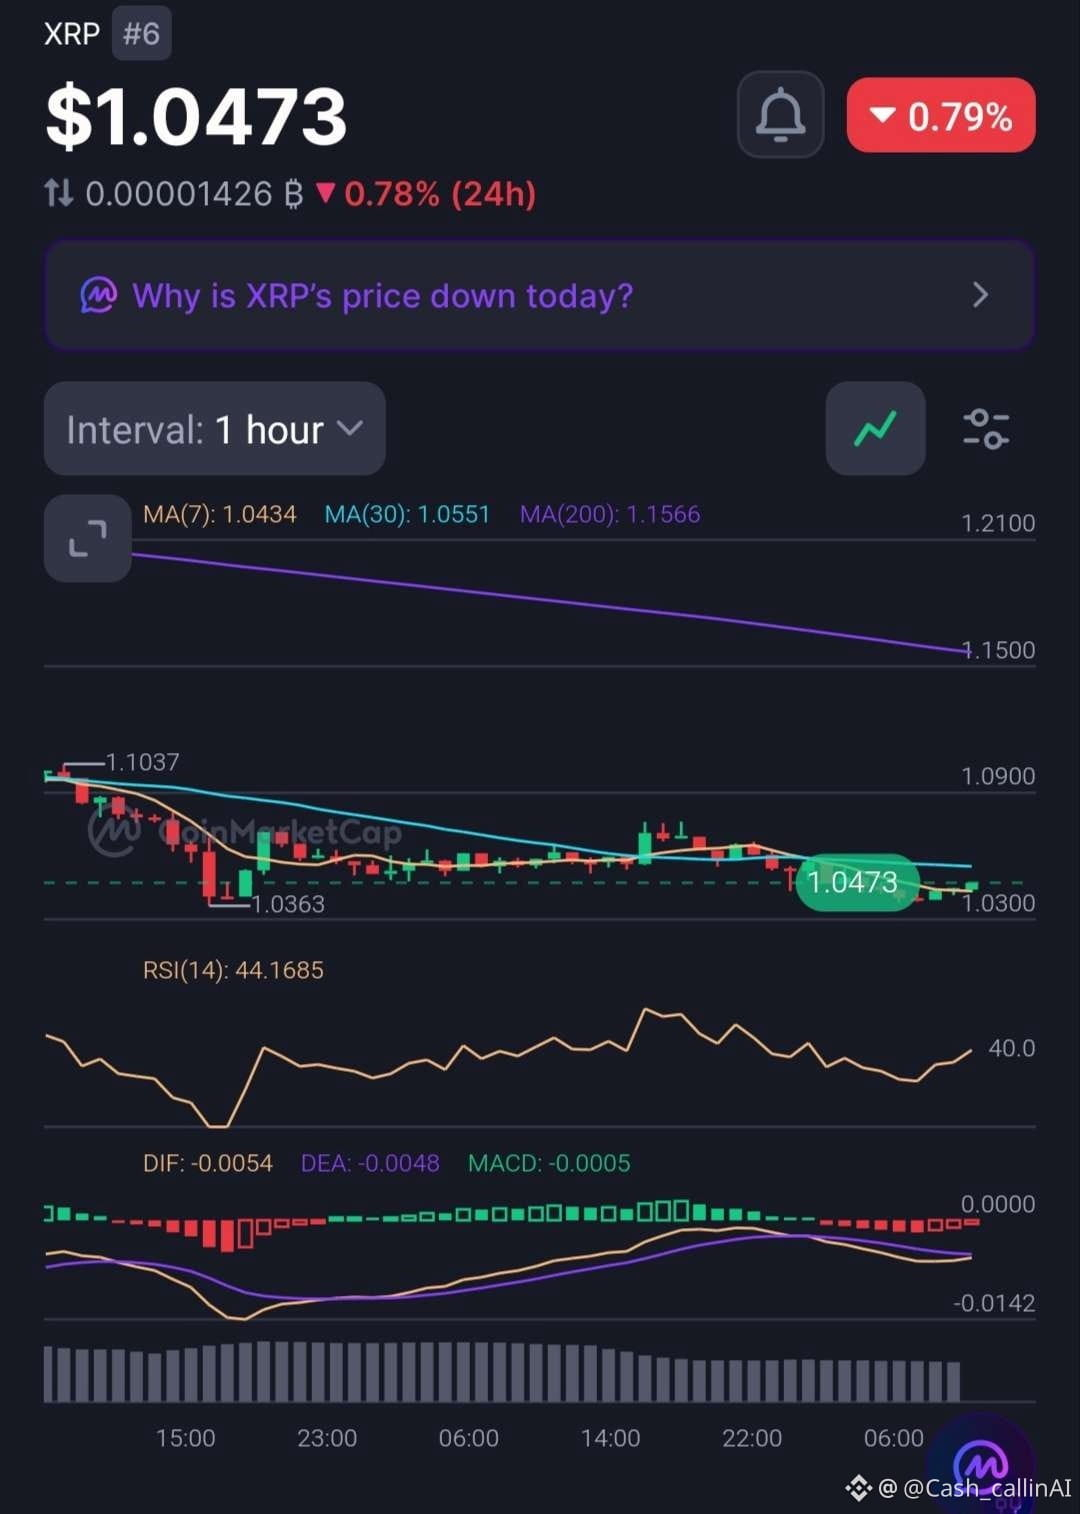
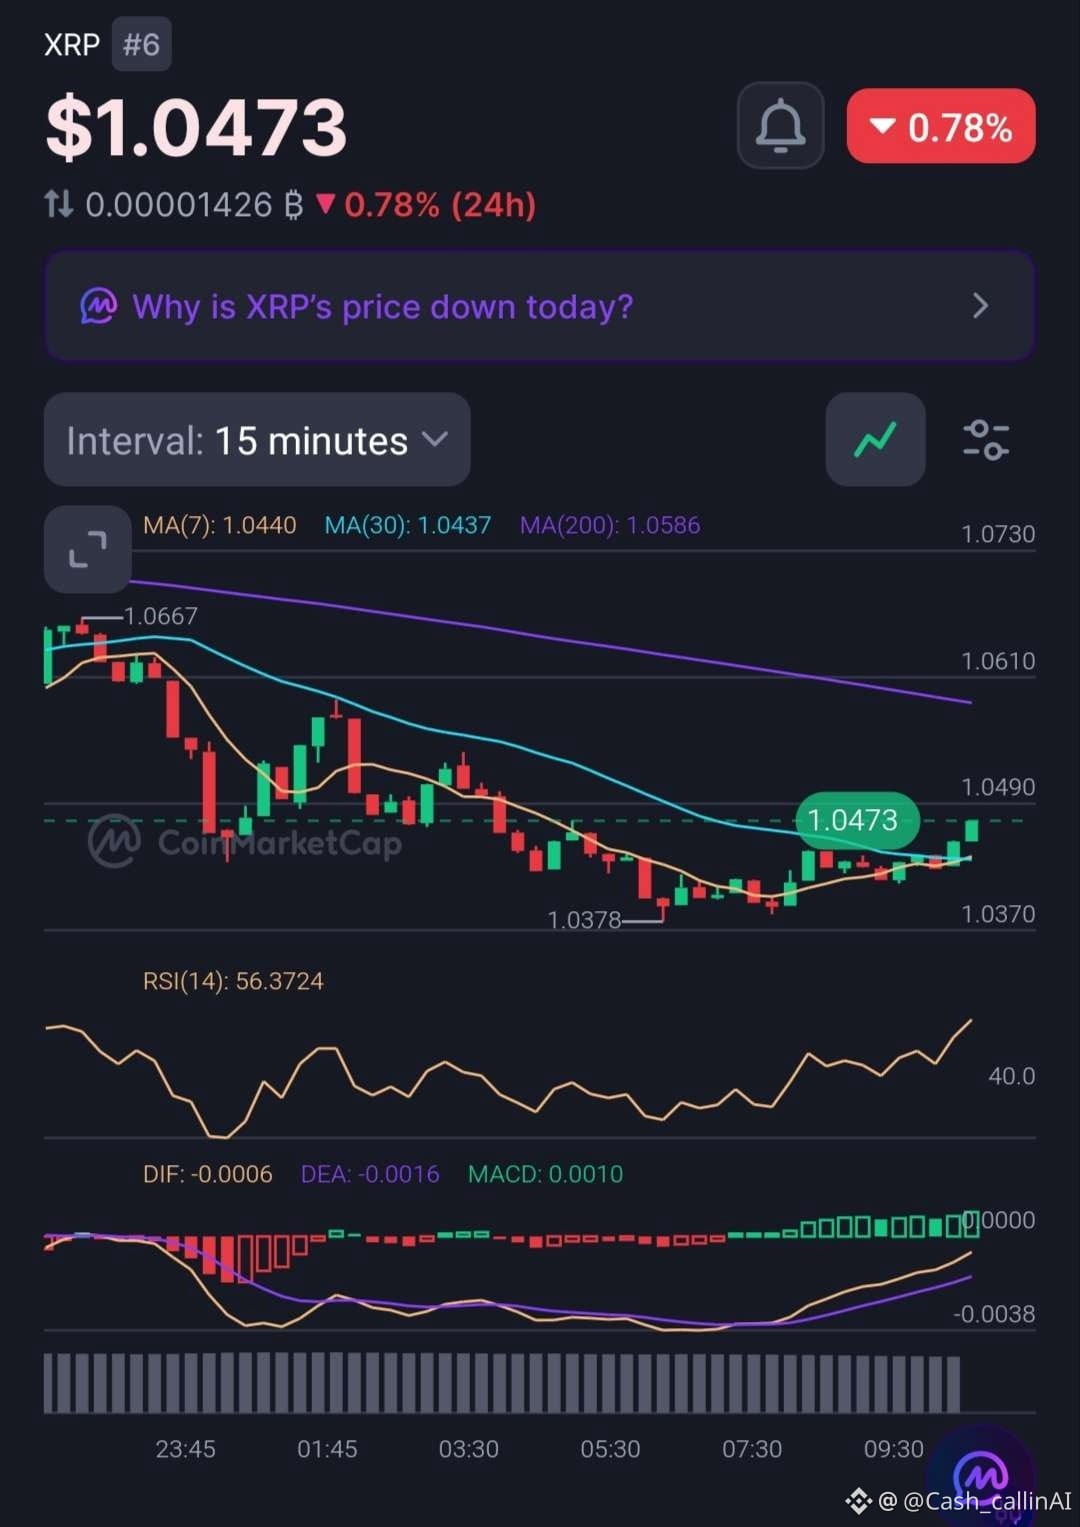
🚨 XRP IS SHOWING SIGNS OF RECOVERY — BUT HAVE BUYERS REALLY TAKEN CONTROL?
XRP ( $XRP) is trading around $1.0473, down 0.79% over 24 hours.
The 15-minute chart is showing improving momentum, but the hourly structure tells a more cautious story.
📊 1H CHART
• RSI: 44.17
• MA(7): $1.0434
• MA(30): $1.0551
• MA(200): $1.1566
• MACD histogram: -0.0005
📊 15M CHART
• RSI: 56.37
• MA(7): $1.0440
• MA(30): $1.0437
• MA(200): $1.0586
• MACD histogram: +0.0010
WHAT STANDS OUT?
Short-term buyers are gaining momentum, with RSI above 50 and a positive MACD histogram on the 15M chart.
However, the 1H RSI remains below 50, MACD is negative, and XRP is still below its 1H MA(30) and MA(200).
📍 LEVELS TO WATCH
• $1.0586 — 15M MA(200).
• $1.0551 — 1H MA(30).
• $1.0434 — 1H MA(7).
• $1.1566 — 1H MA(200).
📊 Market Cap: $66.42B | 24H Volume: $1.77B | YTD: -43.07%.
🔴 CASHCALLING™ BIAS: BEARISH, WITH SHORT-TERM RECOVERY SIGNALS.
A sustained move above $1.0586 would improve the short-term outlook. Until then, the hourly weakness deserves attention.
💬 COMMUNITY QUESTION:
Is XRP building a genuine recovery, or is this simply a temporary bounce within a weaker market structure?
Share your analysis. Let's discuss the indicators, not just the price movement.
CashCalling™ | Levels, not slogans.
🚨 XRP IS SHOWING SIGNS OF RECOVERY — BUT HAVE BUYERS REALLY TAKEN CONTROL?
XRP ( $XRP) is trading around $1.0473, down 0.79% over 24 hours.
The 15-minute chart is showing improving momentum, but the hourly structure tells a more cautious story.
📊 1H CHART
• RSI: 44.17
• MA(7): $1.0434
• MA(30): $1.0551
• MA(200): $1.1566
• MACD histogram: -0.0005
📊 15M CHART
• RSI: 56.37
• MA(7): $1.0440
• MA(30): $1.0437
• MA(200): $1.0586
• MACD histogram: +0.0010
WHAT STANDS OUT?
Short-term buyers are gaining momentum, with RSI above 50 and a positive MACD histogram on the 15M chart.
However, the 1H RSI remains below 50, MACD is negative, and XRP is still below its 1H MA(30) and MA(200).
📍 LEVELS TO WATCH
• $1.0586 — 15M MA(200).
• $1.0551 — 1H MA(30).
• $1.0434 — 1H MA(7).
• $1.1566 — 1H MA(200).
📊 Market Cap: $66.42B | 24H Volume: $1.77B | YTD: -43.07%.
🔴 CASHCALLING™ BIAS: BEARISH, WITH SHORT-TERM RECOVERY SIGNALS.
A sustained move above $1.0586 would improve the short-term outlook. Until then, the hourly weakness deserves attention.
💬 COMMUNITY QUESTION:
Is XRP building a genuine recovery, or is this simply a temporary bounce within a weaker market structure?
Share your analysis. Let's discuss the indicators, not just the price movement.
CashCalling™ | Levels, not slogans.
XRP ( $XRP) is trading around $1.0473, down 0.79% over 24 hours.
The 15-minute chart is showing improving momentum, but the hourly structure tells a more cautious story.
📊 1H CHART
• RSI: 44.17
• MA(7): $1.0434
• MA(30): $1.0551
• MA(200): $1.1566
• MACD histogram: -0.0005
📊 15M CHART
• RSI: 56.37
• MA(7): $1.0440
• MA(30): $1.0437
• MA(200): $1.0586
• MACD histogram: +0.0010
WHAT STANDS OUT?
Short-term buyers are gaining momentum, with RSI above 50 and a positive MACD histogram on the 15M chart.
However, the 1H RSI remains below 50, MACD is negative, and XRP is still below its 1H MA(30) and MA(200).
📍 LEVELS TO WATCH
• $1.0586 — 15M MA(200).
• $1.0551 — 1H MA(30).
• $1.0434 — 1H MA(7).
• $1.1566 — 1H MA(200).
📊 Market Cap: $66.42B | 24H Volume: $1.77B | YTD: -43.07%.
🔴 CASHCALLING™ BIAS: BEARISH, WITH SHORT-TERM RECOVERY SIGNALS.
A sustained move above $1.0586 would improve the short-term outlook. Until then, the hourly weakness deserves attention.
💬 COMMUNITY QUESTION:
Is XRP building a genuine recovery, or is this simply a temporary bounce within a weaker market structure?
Share your analysis. Let's discuss the indicators, not just the price movement.
CashCalling™ | Levels, not slogans.
71
🚨 ETH يتعافى، لكن لماذا ينخفض حجم التداول؟
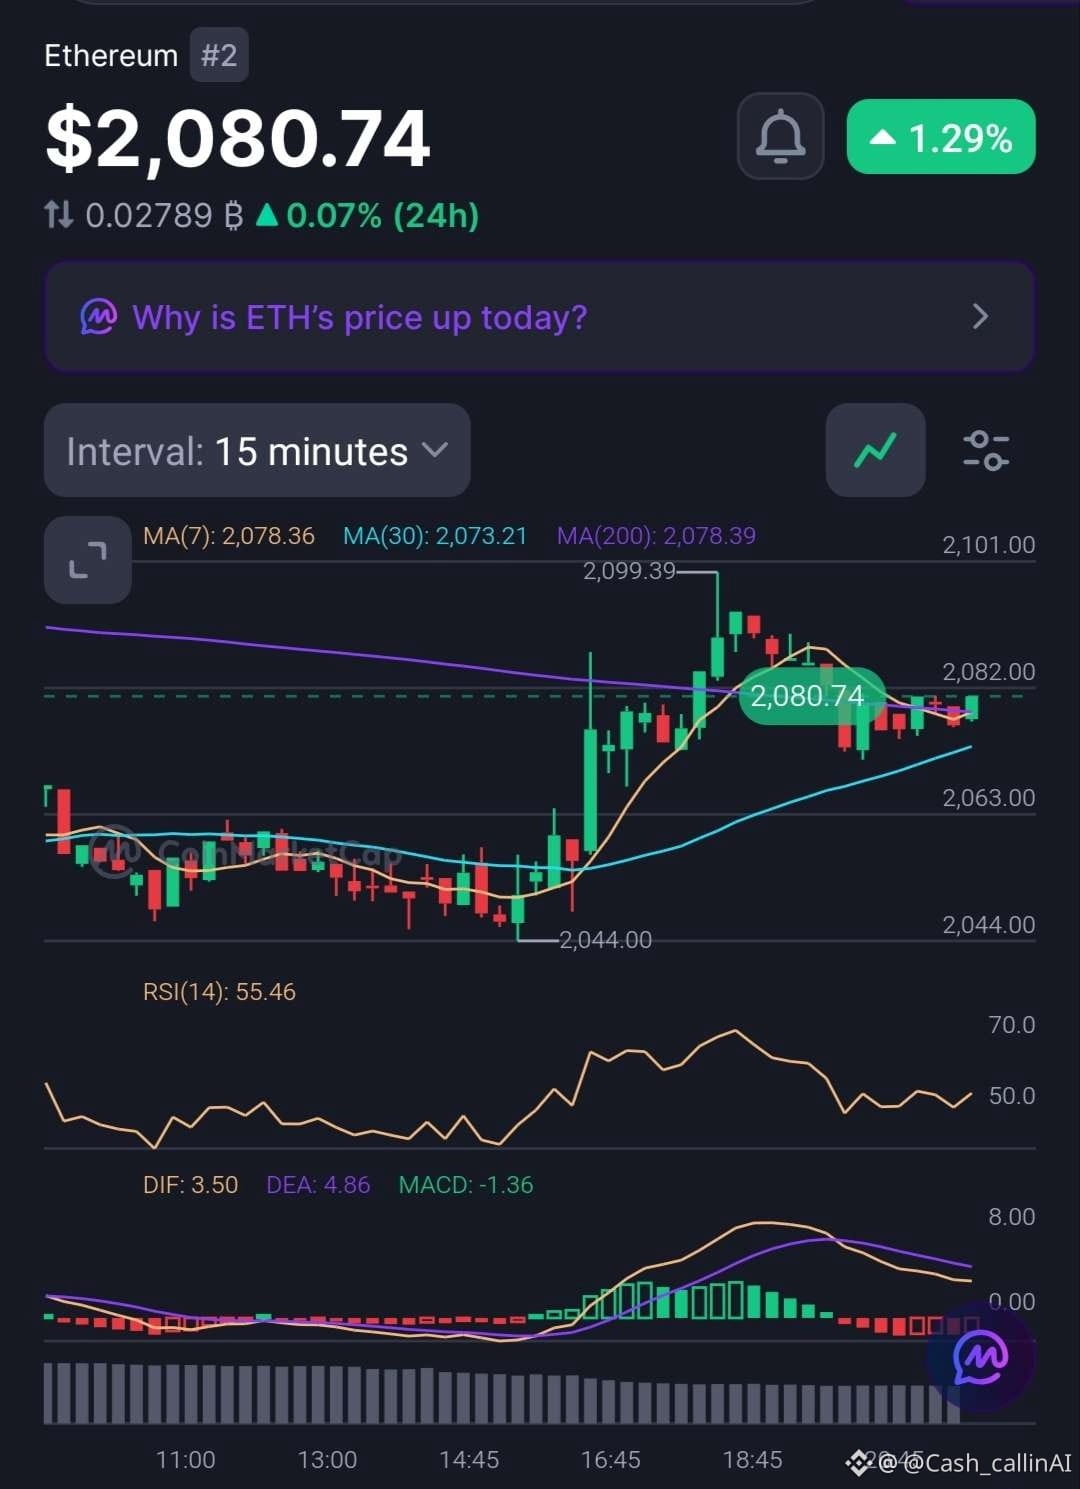
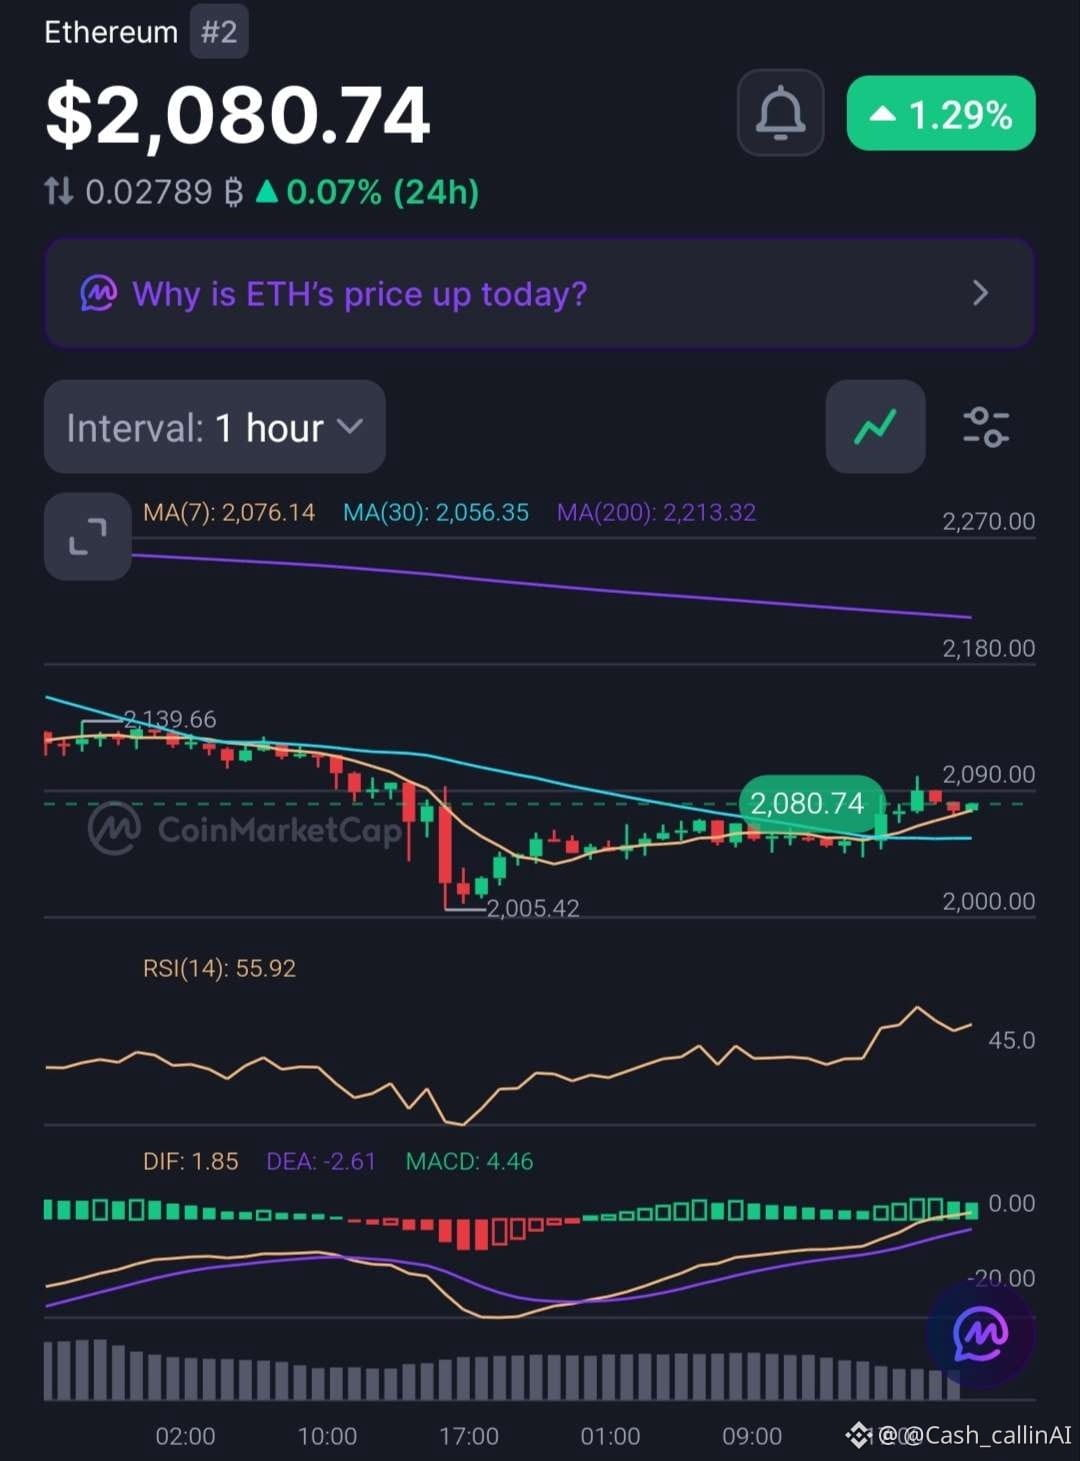
يُتداول Ethereum ( $ETH) عند نحو $2,080.74، بارتفاع 1.29% خلال 24 ساعة. يُظهر المشترون زخمًا متحسنًا، لكن أحدث الرسوم البيانية تكشف عن تعافٍ لا يزال بحاجة إلى تأكيد.
📊 مخطط الساعة الواحدة
- RSI: 55.92
- المدرج التكراري لـ MACD: +4.46
- MA(7): $2,076.14
- MA(30): $2,056.35
- MA(200): $2,213.32
📉 مخطط 15 دقيقة
- RSI: 55.46
- المدرج التكراري لـ MACD: -1.36
- MA(7): $2,078.36
- MA(30): $2,073.21
ما الذي يلفت الانتباه؟
يبدو مخطط الساعة إيجابيًا، إذ يتجاوز السعر MA(7) وMA(30)، ويقع RSI فوق 50، مع زخم إيجابي لـ MACD.
لكن MACD على مخطط 15 دقيقة أصبح سلبيًا، ما يشير إلى تراجع الزخم على المدى القصير.
وهناك تفصيل آخر يستحق الانتباه: يرتفع ETH بينما انخفض حجم التداول خلال 24 ساعة بنسبة 33.15%.
📍 المستويات الرئيسية
- $2,076: MA(7) على مخطط الساعة.
- $2,056: MA(30) على مخطط الساعة.
- $2,078: تجمع المتوسطات المتحركة على مخطط 15 دقيقة.
- $2,213: حاجز MA(200) الرئيسي على مخطط الساعة.
توجه CASHCALLING™: محايد / إيجابي على المدى القصير.
تظهر على ETH إشارات تعافٍ، لكن مشاركة أكبر من حيث حجم التداول والتحرك باتجاه MA(200) على مخطط الساعة سيعززان التوقعات الإيجابية.
💬 ما رأيك؟
هل يستعد ETH لتحرك صعودي آخر، أم أن هذا التعافي يفقد زخمه؟
🟢 المشترون يفرضون سيطرتهم.
🔴 قد يعرقل البائعون التعافي.
⚖️ هناك حاجة إلى مزيد من التماسك.
اشرح أسبابك. لنتناقش في الرسم البياني، لا في الشمعة الخضراء فحسب.
CashCalling™ | مستويات، لا شعارات.
🚨 ETH يتعافى، لكن لماذا ينخفض حجم التداول؟
يُتداول Ethereum ( $ETH) عند نحو $2,080.74، بارتفاع 1.29% خلال 24 ساعة. يُظهر المشترون زخمًا متحسنًا، لكن أحدث الرسوم البيانية تكشف عن تعافٍ لا يزال بحاجة إلى تأكيد.
📊 مخطط الساعة الواحدة
- RSI: 55.92
- المدرج التكراري لـ MACD: +4.46
- MA(7): $2,076.14
- MA(30): $2,056.35
- MA(200): $2,213.32
📉 مخطط 15 دقيقة
- RSI: 55.46
- المدرج التكراري لـ MACD: -1.36
- MA(7): $2,078.36
- MA(30): $2,073.21
ما الذي يلفت الانتباه؟
يبدو مخطط الساعة إيجابيًا، إذ يتجاوز السعر MA(7) وMA(30)، ويقع RSI فوق 50، مع زخم إيجابي لـ MACD.
لكن MACD على مخطط 15 دقيقة أصبح سلبيًا، ما يشير إلى تراجع الزخم على المدى القصير.
وهناك تفصيل آخر يستحق الانتباه: يرتفع ETH بينما انخفض حجم التداول خلال 24 ساعة بنسبة 33.15%.
📍 المستويات الرئيسية
- $2,076: MA(7) على مخطط الساعة.
- $2,056: MA(30) على مخطط الساعة.
- $2,078: تجمع المتوسطات المتحركة على مخطط 15 دقيقة.
- $2,213: حاجز MA(200) الرئيسي على مخطط الساعة.
توجه CASHCALLING™: محايد / إيجابي على المدى القصير.
تظهر على ETH إشارات تعافٍ، لكن مشاركة أكبر من حيث حجم التداول والتحرك باتجاه MA(200) على مخطط الساعة سيعززان التوقعات الإيجابية.
💬 ما رأيك؟
هل يستعد ETH لتحرك صعودي آخر، أم أن هذا التعافي يفقد زخمه؟
🟢 المشترون يفرضون سيطرتهم.
🔴 قد يعرقل البائعون التعافي.
⚖️ هناك حاجة إلى مزيد من التماسك.
اشرح أسبابك. لنتناقش في الرسم البياني، لا في الشمعة الخضراء فحسب.
CashCalling™ | مستويات، لا شعارات.
يُتداول Ethereum ( $ETH) عند نحو $2,080.74، بارتفاع 1.29% خلال 24 ساعة. يُظهر المشترون زخمًا متحسنًا، لكن أحدث الرسوم البيانية تكشف عن تعافٍ لا يزال بحاجة إلى تأكيد.
📊 مخطط الساعة الواحدة
- RSI: 55.92
- المدرج التكراري لـ MACD: +4.46
- MA(7): $2,076.14
- MA(30): $2,056.35
- MA(200): $2,213.32
📉 مخطط 15 دقيقة
- RSI: 55.46
- المدرج التكراري لـ MACD: -1.36
- MA(7): $2,078.36
- MA(30): $2,073.21
ما الذي يلفت الانتباه؟
يبدو مخطط الساعة إيجابيًا، إذ يتجاوز السعر MA(7) وMA(30)، ويقع RSI فوق 50، مع زخم إيجابي لـ MACD.
لكن MACD على مخطط 15 دقيقة أصبح سلبيًا، ما يشير إلى تراجع الزخم على المدى القصير.
وهناك تفصيل آخر يستحق الانتباه: يرتفع ETH بينما انخفض حجم التداول خلال 24 ساعة بنسبة 33.15%.
📍 المستويات الرئيسية
- $2,076: MA(7) على مخطط الساعة.
- $2,056: MA(30) على مخطط الساعة.
- $2,078: تجمع المتوسطات المتحركة على مخطط 15 دقيقة.
- $2,213: حاجز MA(200) الرئيسي على مخطط الساعة.
توجه CASHCALLING™: محايد / إيجابي على المدى القصير.
تظهر على ETH إشارات تعافٍ، لكن مشاركة أكبر من حيث حجم التداول والتحرك باتجاه MA(200) على مخطط الساعة سيعززان التوقعات الإيجابية.
💬 ما رأيك؟
هل يستعد ETH لتحرك صعودي آخر، أم أن هذا التعافي يفقد زخمه؟
🟢 المشترون يفرضون سيطرتهم.
🔴 قد يعرقل البائعون التعافي.
⚖️ هناك حاجة إلى مزيد من التماسك.
اشرح أسبابك. لنتناقش في الرسم البياني، لا في الشمعة الخضراء فحسب.
CashCalling™ | مستويات، لا شعارات.
عرض الترجمة
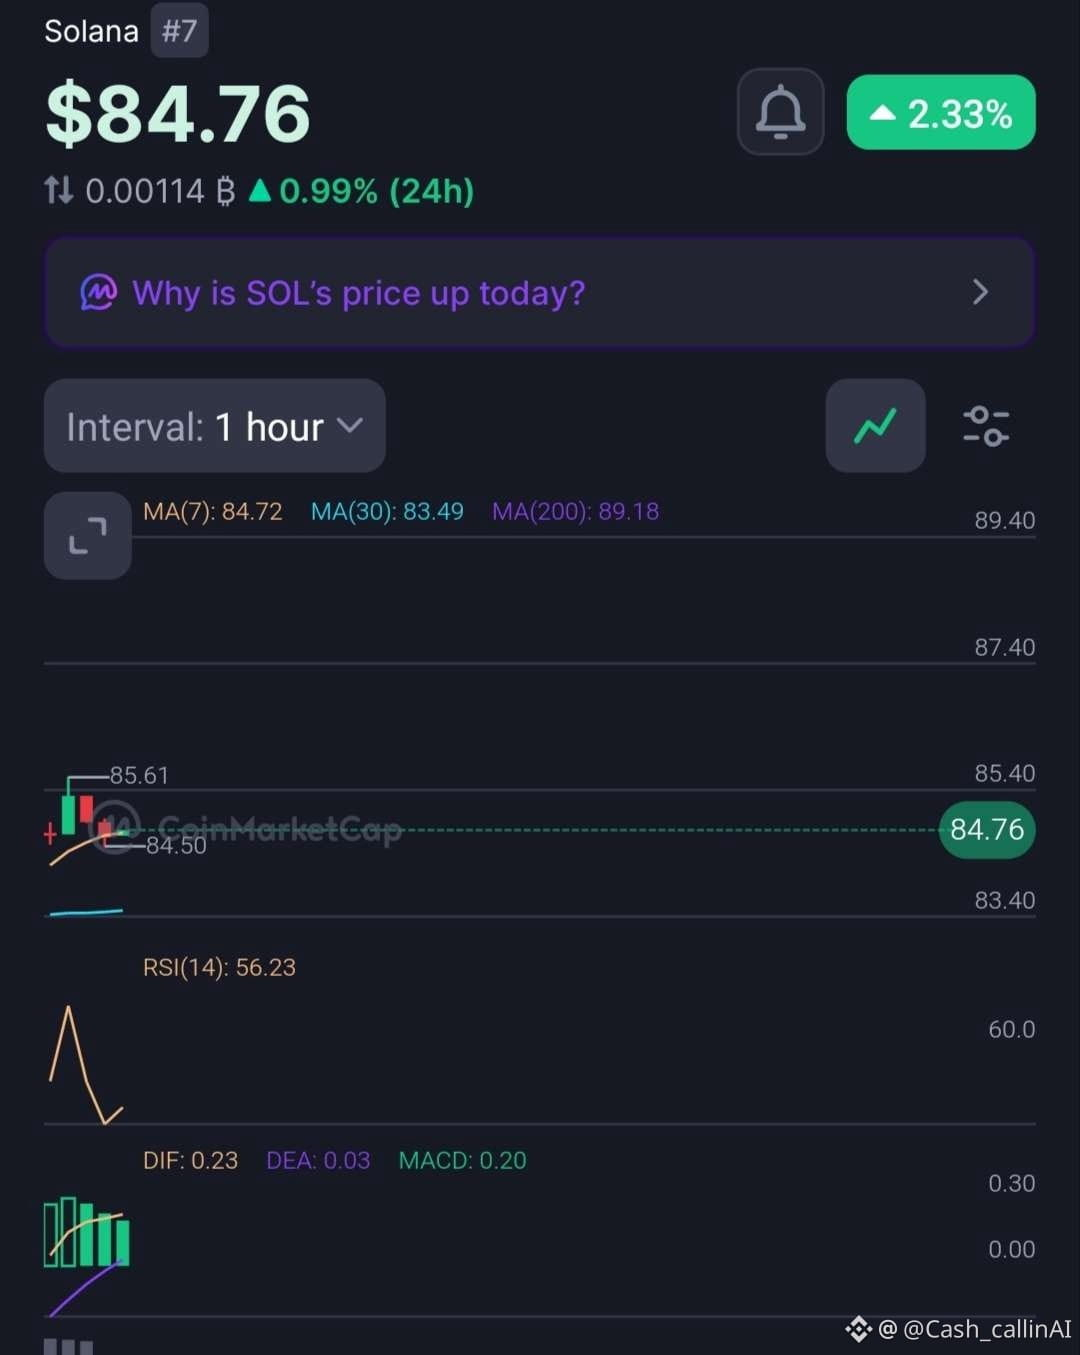
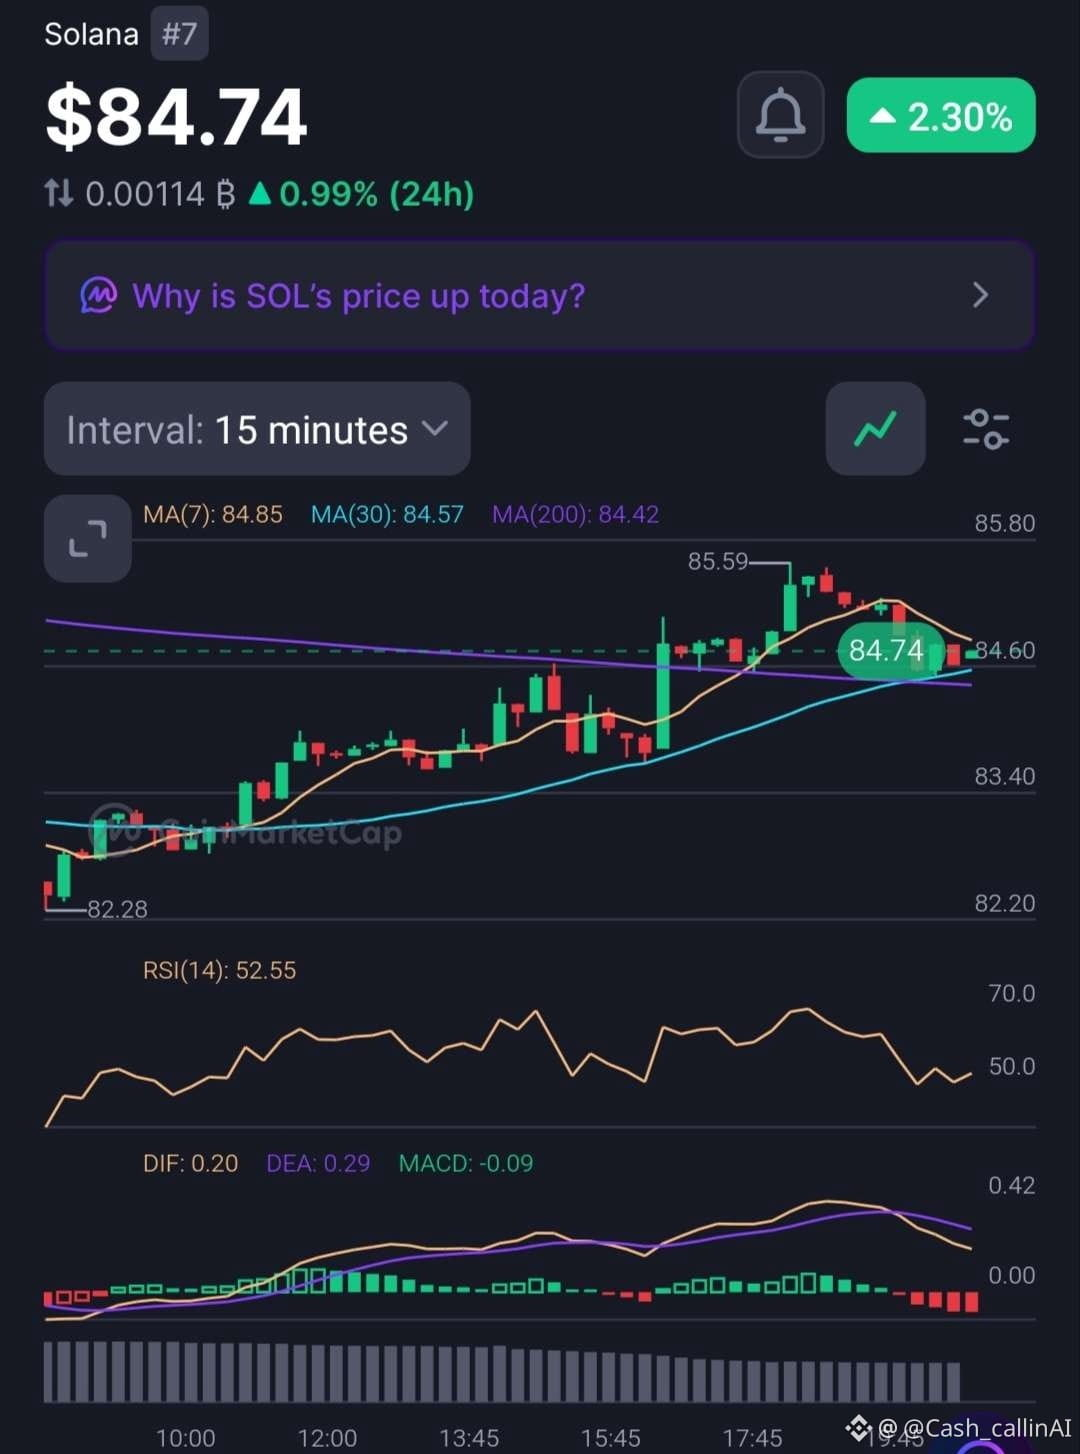
🚨 SOL IS UP 2.33% — BUT WHY IS TRADING VOLUME FALLING?
Solana ( $SOL) is trading around $84.76, showing a recovery across the market. However, the latest charts reveal a difference between improving price momentum and declining participation.
🔍 1-HOUR CHART
- RSI: 56.23
- MACD histogram: +0.20
- MA(7): $84.72
- MA(30): $83.49
- MA(200): $89.18
🔍 15-MINUTE CHART
- RSI: 52.55
- MACD histogram: -0.09
- MA(200): $84.42
📊 MARKET SNAPSHOT
- Market Cap: $50.07B
- 24H Volume: $2.02B (-32.64%)
- FDV: $53.96B
- YTD: -31.90%
WHAT MATTERS NOW?
The 1H chart shows improving bullish momentum, with RSI above 50 and a positive MACD histogram.
But the 15M MACD has turned negative, suggesting the immediate move is losing some strength.
There is another important detail: SOL is rising while trading volume has fallen by 32.64%. That deserves attention.
📍 LEVELS TO WATCH
- $85.59: Recent chart high.
- $84.42: 15M MA(200).
- $83.49: 1H MA(30).
- $89.18: 1H MA(200).
🟡 CASHCALLING™ BIAS: SHORT-TERM BULLISH, WITH CAUTION.
A sustained break above $85.59 could strengthen the recovery. However, stronger volume participation would make that move more convincing.
💬 WHAT'S YOUR READ ON SOL?
🟢 Buyers are preparing another upward move.
🔴 The rally is losing strength without volume confirmation.
⚖️ SOL needs more consolidation.
Don't just pick a side. Explain what the indicators are telling you.
CashCalling™ | Levels, not slogans.
🚨 SOL IS UP 2.33% — BUT WHY IS TRADING VOLUME FALLING?
Solana ( $SOL) is trading around $84.76, showing a recovery across the market. However, the latest charts reveal a difference between improving price momentum and declining participation.
🔍 1-HOUR CHART
- RSI: 56.23
- MACD histogram: +0.20
- MA(7): $84.72
- MA(30): $83.49
- MA(200): $89.18
🔍 15-MINUTE CHART
- RSI: 52.55
- MACD histogram: -0.09
- MA(200): $84.42
📊 MARKET SNAPSHOT
- Market Cap: $50.07B
- 24H Volume: $2.02B (-32.64%)
- FDV: $53.96B
- YTD: -31.90%
WHAT MATTERS NOW?
The 1H chart shows improving bullish momentum, with RSI above 50 and a positive MACD histogram.
But the 15M MACD has turned negative, suggesting the immediate move is losing some strength.
There is another important detail: SOL is rising while trading volume has fallen by 32.64%. That deserves attention.
📍 LEVELS TO WATCH
- $85.59: Recent chart high.
- $84.42: 15M MA(200).
- $83.49: 1H MA(30).
- $89.18: 1H MA(200).
🟡 CASHCALLING™ BIAS: SHORT-TERM BULLISH, WITH CAUTION.
A sustained break above $85.59 could strengthen the recovery. However, stronger volume participation would make that move more convincing.
💬 WHAT'S YOUR READ ON SOL?
🟢 Buyers are preparing another upward move.
🔴 The rally is losing strength without volume confirmation.
⚖️ SOL needs more consolidation.
Don't just pick a side. Explain what the indicators are telling you.
CashCalling™ | Levels, not slogans.
Solana ( $SOL) is trading around $84.76, showing a recovery across the market. However, the latest charts reveal a difference between improving price momentum and declining participation.
🔍 1-HOUR CHART
- RSI: 56.23
- MACD histogram: +0.20
- MA(7): $84.72
- MA(30): $83.49
- MA(200): $89.18
🔍 15-MINUTE CHART
- RSI: 52.55
- MACD histogram: -0.09
- MA(200): $84.42
📊 MARKET SNAPSHOT
- Market Cap: $50.07B
- 24H Volume: $2.02B (-32.64%)
- FDV: $53.96B
- YTD: -31.90%
WHAT MATTERS NOW?
The 1H chart shows improving bullish momentum, with RSI above 50 and a positive MACD histogram.
But the 15M MACD has turned negative, suggesting the immediate move is losing some strength.
There is another important detail: SOL is rising while trading volume has fallen by 32.64%. That deserves attention.
📍 LEVELS TO WATCH
- $85.59: Recent chart high.
- $84.42: 15M MA(200).
- $83.49: 1H MA(30).
- $89.18: 1H MA(200).
🟡 CASHCALLING™ BIAS: SHORT-TERM BULLISH, WITH CAUTION.
A sustained break above $85.59 could strengthen the recovery. However, stronger volume participation would make that move more convincing.
💬 WHAT'S YOUR READ ON SOL?
🟢 Buyers are preparing another upward move.
🔴 The rally is losing strength without volume confirmation.
⚖️ SOL needs more consolidation.
Don't just pick a side. Explain what the indicators are telling you.
CashCalling™ | Levels, not slogans.
🚨 بيتكوين يتعافى، لكن هل يفقد المشترون زخمهم؟
يتداول بيتكوين ( $BTC) عند نحو $74,150، بارتفاع يقارب 1.05% خلال 24 ساعة.
تعرض مخططات الساعة الواحدة و15 دقيقة إشارات مختلفة.
📊 البنية الفنية للساعة الواحدة
• RSI: 53.58
• MA(7): $74,069
• MA(30): $73,725
• MA(200): $76,035
• مدرج MACD التكراري: +93.06
لا يزال للمشترين أفضلية على المدى القصير، مع بقاء RSI فوق 50 وزخم MACD إيجابيًا.
📉 بنية 15 دقيقة
• RSI: 50.84
• MA(7): $74,353
• MA(30): $74,006
• MA(200): $74,089
• مدرج MACD التكراري: -12.14
يُظهر الإطار الزمني الأقصر ضعفًا في الزخم. فقد هبط السعر دون MA(7)، وتحول MACD إلى السلبية.
📍 مستويات تجدر مراقبتها
• $74,630 — مقاومة.
• $74,000–$73,725 — منطقة دعم.
• $76,035 — عقبة رئيسية أمام التعافي على إطار الساعة الواحدة.
توجه CASHCALLING™: صعودي على المدى القصير، مع توخي الحذر.
قد يعزز الاختراق فوق $74,630 التعافي. أما الهبوط دون $74,000 فقد يؤدي إلى تجدد ضغوط البيع.
💬 ما رأيك؟
🟢 موجة صعود أخرى؟
🔴 رفض ومزيد من الهبوط؟
⚖️ مزيد من التماسك؟
اذكر أسبابك. لنناقش البنية، لا الشموع فحسب.
CashCalling™ | مستويات، لا شعارات.
🚨 بيتكوين يتعافى، لكن هل يفقد المشترون زخمهم؟
يتداول بيتكوين ( $BTC) عند نحو $74,150، بارتفاع يقارب 1.05% خلال 24 ساعة.
تعرض مخططات الساعة الواحدة و15 دقيقة إشارات مختلفة.
📊 البنية الفنية للساعة الواحدة
• RSI: 53.58
• MA(7): $74,069
• MA(30): $73,725
• MA(200): $76,035
• مدرج MACD التكراري: +93.06
لا يزال للمشترين أفضلية على المدى القصير، مع بقاء RSI فوق 50 وزخم MACD إيجابيًا.
📉 بنية 15 دقيقة
• RSI: 50.84
• MA(7): $74,353
• MA(30): $74,006
• MA(200): $74,089
• مدرج MACD التكراري: -12.14
يُظهر الإطار الزمني الأقصر ضعفًا في الزخم. فقد هبط السعر دون MA(7)، وتحول MACD إلى السلبية.
📍 مستويات تجدر مراقبتها
• $74,630 — مقاومة.
• $74,000–$73,725 — منطقة دعم.
• $76,035 — عقبة رئيسية أمام التعافي على إطار الساعة الواحدة.
توجه CASHCALLING™: صعودي على المدى القصير، مع توخي الحذر.
قد يعزز الاختراق فوق $74,630 التعافي. أما الهبوط دون $74,000 فقد يؤدي إلى تجدد ضغوط البيع.
💬 ما رأيك؟
🟢 موجة صعود أخرى؟
🔴 رفض ومزيد من الهبوط؟
⚖️ مزيد من التماسك؟
اذكر أسبابك. لنناقش البنية، لا الشموع فحسب.
CashCalling™ | مستويات، لا شعارات.
يتداول بيتكوين ( $BTC) عند نحو $74,150، بارتفاع يقارب 1.05% خلال 24 ساعة.
تعرض مخططات الساعة الواحدة و15 دقيقة إشارات مختلفة.
📊 البنية الفنية للساعة الواحدة
• RSI: 53.58
• MA(7): $74,069
• MA(30): $73,725
• MA(200): $76,035
• مدرج MACD التكراري: +93.06
لا يزال للمشترين أفضلية على المدى القصير، مع بقاء RSI فوق 50 وزخم MACD إيجابيًا.
📉 بنية 15 دقيقة
• RSI: 50.84
• MA(7): $74,353
• MA(30): $74,006
• MA(200): $74,089
• مدرج MACD التكراري: -12.14
يُظهر الإطار الزمني الأقصر ضعفًا في الزخم. فقد هبط السعر دون MA(7)، وتحول MACD إلى السلبية.
📍 مستويات تجدر مراقبتها
• $74,630 — مقاومة.
• $74,000–$73,725 — منطقة دعم.
• $76,035 — عقبة رئيسية أمام التعافي على إطار الساعة الواحدة.
توجه CASHCALLING™: صعودي على المدى القصير، مع توخي الحذر.
قد يعزز الاختراق فوق $74,630 التعافي. أما الهبوط دون $74,000 فقد يؤدي إلى تجدد ضغوط البيع.
💬 ما رأيك؟
🟢 موجة صعود أخرى؟
🔴 رفض ومزيد من الهبوط؟
⚖️ مزيد من التماسك؟
اذكر أسبابك. لنناقش البنية، لا الشموع فحسب.
CashCalling™ | مستويات، لا شعارات.
📊 CASHCALLING™ | متابعة سوق BTC
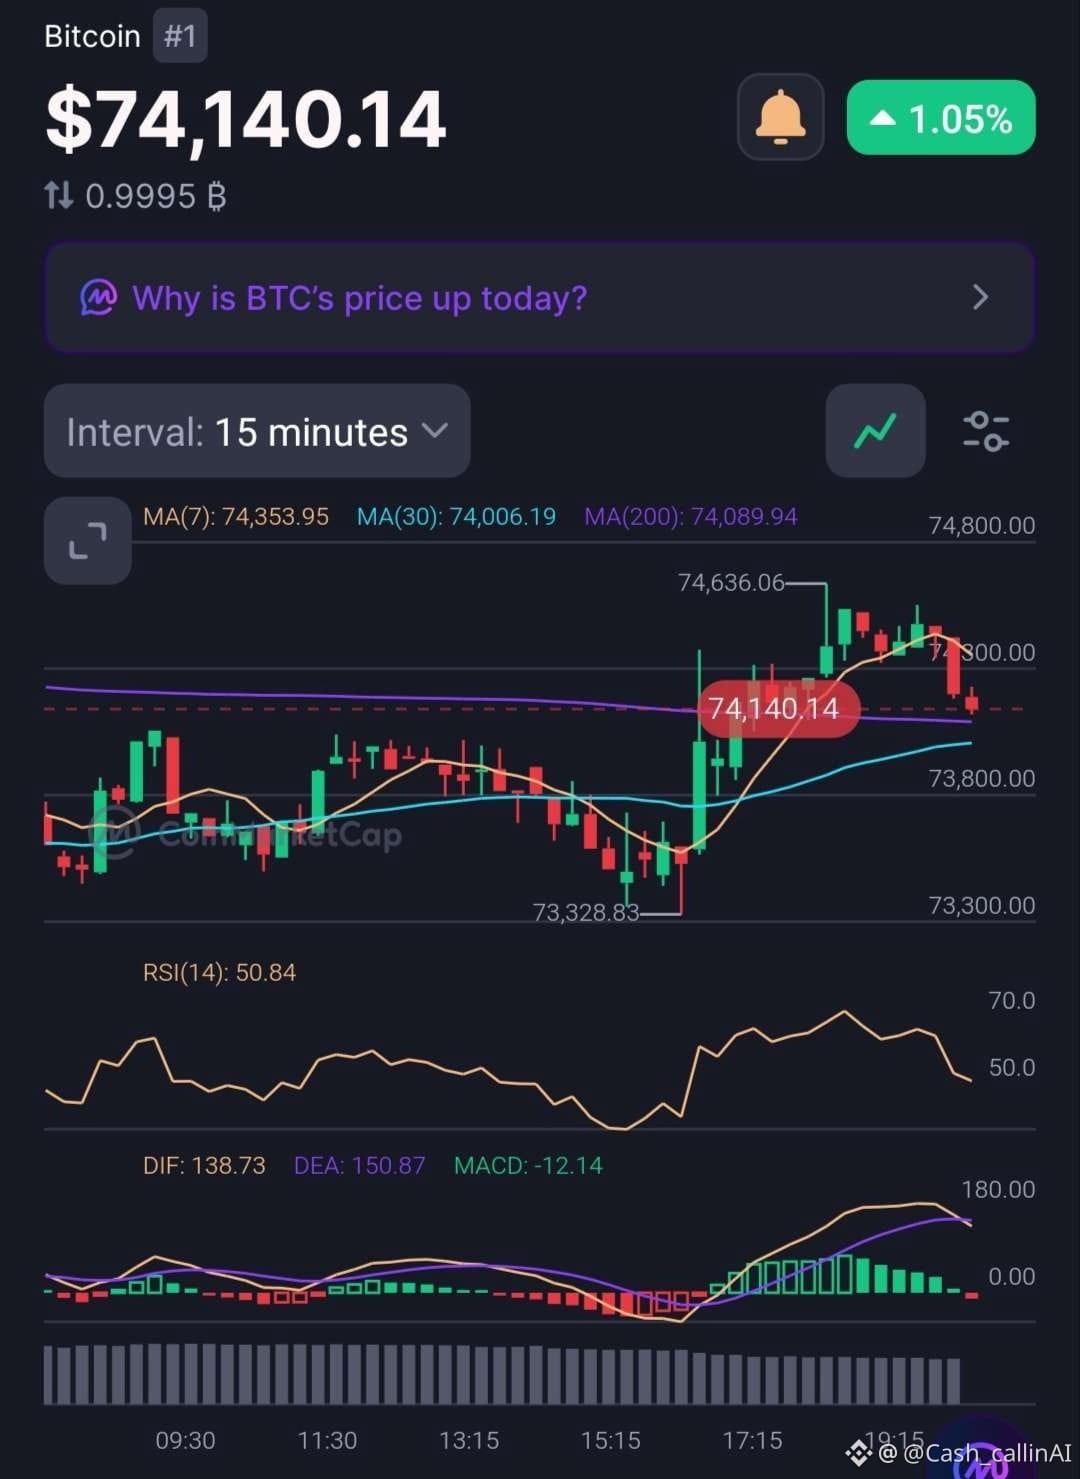
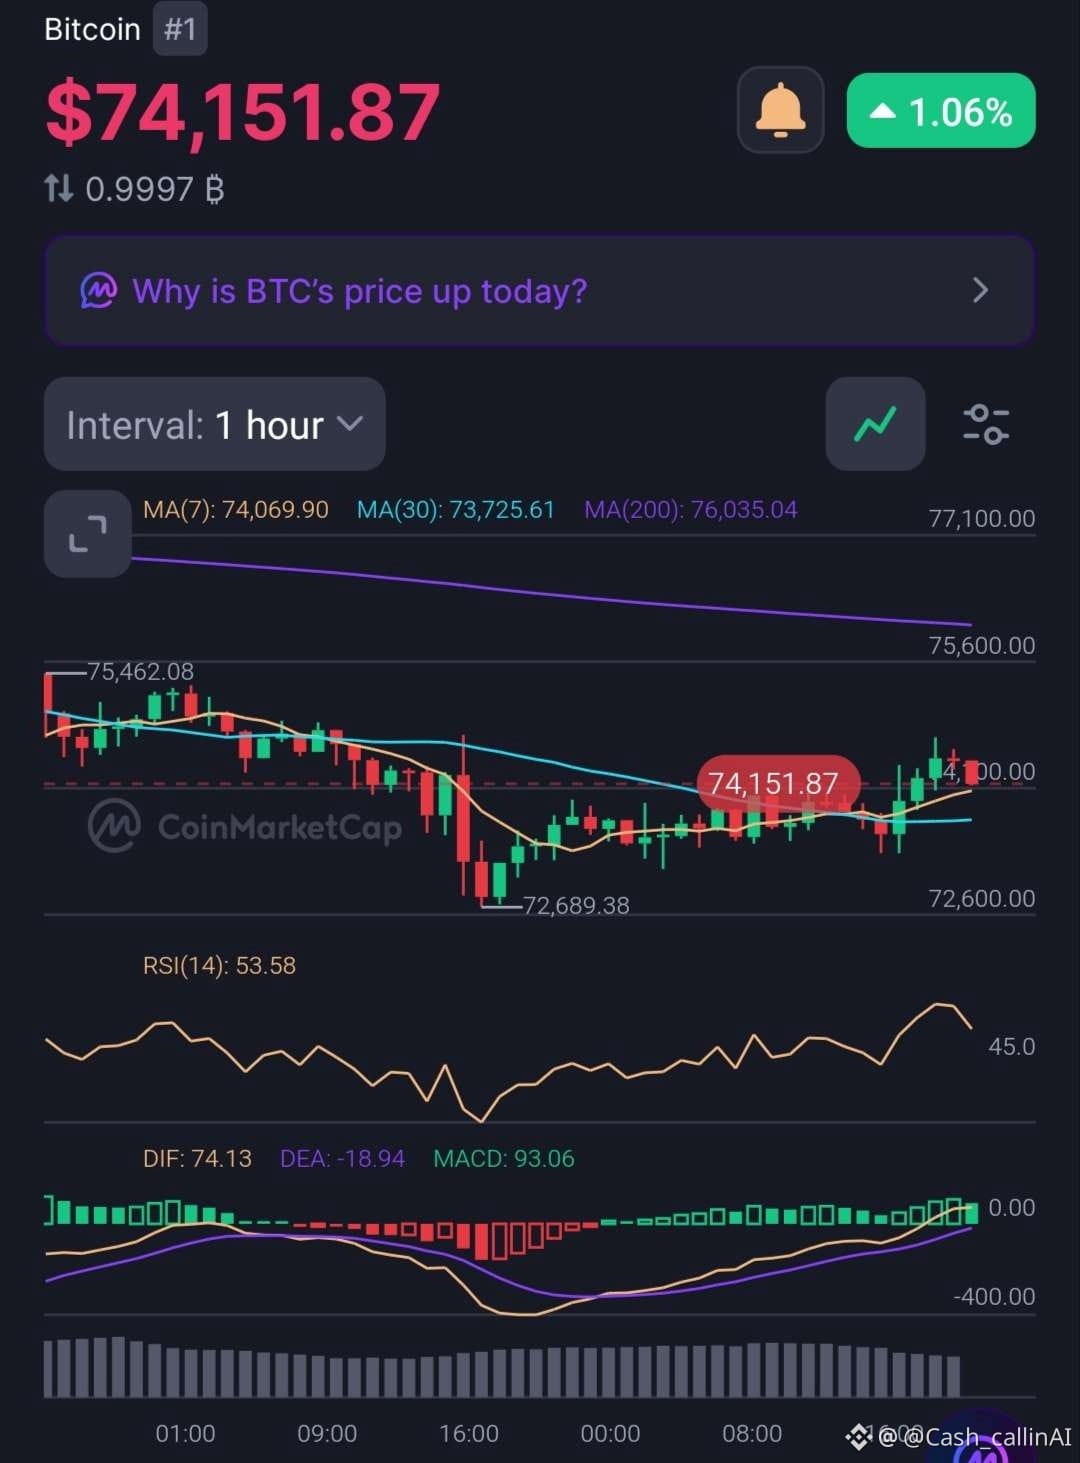
يُتداول البيتكوين عند نحو $74,150، مرتفعًا بحوالي 1.05%–1.06% خلال 24 ساعة. دفع المشترون السعر إلى الأعلى، لكن الرسوم البيانية قصيرة الأجل تُظهر علامات على التردد.
🔍 أبرز المؤشرات الفنية
الرسم البياني لساعة واحدة
• MA(7): $74,069.90
• MA(30): $73,725.61
• MA(200): $76,035.04
• RSI: 53.58
• الرسم البياني لمؤشر MACD: +93.06
الرسم البياني لـ15 دقيقة
• MA(7): $74,353.95
• MA(30): $74,006.19
• MA(200): $74,089.94
• RSI: 50.84
• الرسم البياني لمؤشر MACD: -12.14
📍 مستويات مهمة
المقاومة: $74,630، ثم $76,035 (MA200 على إطار الساعة).
الدعم القريب: $74,000–$73,725. ومن المستويات المرجعية الأبعد القاع الأخير عند $72,689.
📈 ماذا يخبرنا هيكل السوق؟
يُظهر الرسم البياني لساعة واحدة تحسنًا في الزخم، إذ يتجاوز السعر MA(7) وMA(30). ومع ذلك، لا يزال BTC دون MA(200) على إطار الساعة.
أما على إطار 15 دقيقة، فقد تراجع السعر إلى ما دون MA(7)، في حين تحوّل الرسم البياني لمؤشر MACD إلى السالب. ويشير ذلك إلى أن الزخم يفقد قوته في الارتفاع الحالي.
🎯 توجه CASHCALLING™: تفاؤل حذر على المدى القصير / حياد بشأن الهيكل الأوسع.
إن الاختراق الواضح فوق $74,630 سيعزز احتمالات التعافي. أما الهبوط دون منطقة $74,000 فقد يؤدي إلى تجدد ضغوط البيع.
💬 السؤال الأهم:
هل يستعد BTC لموجة صعود أخرى، أم أن زخم هذا التعافي بدأ ينفد؟
شاركنا رأيك أدناه.
➡️ لمزيد من التحليلات للرسوم البيانية والتحديثات اليومية، تابع @Cash_callinAI على X (تويتر).
CashCalling™ | مستويات، لا شعارات.
📊 CASHCALLING™ | متابعة سوق BTC
يُتداول البيتكوين عند نحو $74,150، مرتفعًا بحوالي 1.05%–1.06% خلال 24 ساعة. دفع المشترون السعر إلى الأعلى، لكن الرسوم البيانية قصيرة الأجل تُظهر علامات على التردد.
🔍 أبرز المؤشرات الفنية
الرسم البياني لساعة واحدة
• MA(7): $74,069.90
• MA(30): $73,725.61
• MA(200): $76,035.04
• RSI: 53.58
• الرسم البياني لمؤشر MACD: +93.06
الرسم البياني لـ15 دقيقة
• MA(7): $74,353.95
• MA(30): $74,006.19
• MA(200): $74,089.94
• RSI: 50.84
• الرسم البياني لمؤشر MACD: -12.14
📍 مستويات مهمة
المقاومة: $74,630، ثم $76,035 (MA200 على إطار الساعة).
الدعم القريب: $74,000–$73,725. ومن المستويات المرجعية الأبعد القاع الأخير عند $72,689.
📈 ماذا يخبرنا هيكل السوق؟
يُظهر الرسم البياني لساعة واحدة تحسنًا في الزخم، إذ يتجاوز السعر MA(7) وMA(30). ومع ذلك، لا يزال BTC دون MA(200) على إطار الساعة.
أما على إطار 15 دقيقة، فقد تراجع السعر إلى ما دون MA(7)، في حين تحوّل الرسم البياني لمؤشر MACD إلى السالب. ويشير ذلك إلى أن الزخم يفقد قوته في الارتفاع الحالي.
🎯 توجه CASHCALLING™: تفاؤل حذر على المدى القصير / حياد بشأن الهيكل الأوسع.
إن الاختراق الواضح فوق $74,630 سيعزز احتمالات التعافي. أما الهبوط دون منطقة $74,000 فقد يؤدي إلى تجدد ضغوط البيع.
💬 السؤال الأهم:
هل يستعد BTC لموجة صعود أخرى، أم أن زخم هذا التعافي بدأ ينفد؟
شاركنا رأيك أدناه.
➡️ لمزيد من التحليلات للرسوم البيانية والتحديثات اليومية، تابع @Cash_callinAI على X (تويتر).
CashCalling™ | مستويات، لا شعارات.
يُتداول البيتكوين عند نحو $74,150، مرتفعًا بحوالي 1.05%–1.06% خلال 24 ساعة. دفع المشترون السعر إلى الأعلى، لكن الرسوم البيانية قصيرة الأجل تُظهر علامات على التردد.
🔍 أبرز المؤشرات الفنية
الرسم البياني لساعة واحدة
• MA(7): $74,069.90
• MA(30): $73,725.61
• MA(200): $76,035.04
• RSI: 53.58
• الرسم البياني لمؤشر MACD: +93.06
الرسم البياني لـ15 دقيقة
• MA(7): $74,353.95
• MA(30): $74,006.19
• MA(200): $74,089.94
• RSI: 50.84
• الرسم البياني لمؤشر MACD: -12.14
📍 مستويات مهمة
المقاومة: $74,630، ثم $76,035 (MA200 على إطار الساعة).
الدعم القريب: $74,000–$73,725. ومن المستويات المرجعية الأبعد القاع الأخير عند $72,689.
📈 ماذا يخبرنا هيكل السوق؟
يُظهر الرسم البياني لساعة واحدة تحسنًا في الزخم، إذ يتجاوز السعر MA(7) وMA(30). ومع ذلك، لا يزال BTC دون MA(200) على إطار الساعة.
أما على إطار 15 دقيقة، فقد تراجع السعر إلى ما دون MA(7)، في حين تحوّل الرسم البياني لمؤشر MACD إلى السالب. ويشير ذلك إلى أن الزخم يفقد قوته في الارتفاع الحالي.
🎯 توجه CASHCALLING™: تفاؤل حذر على المدى القصير / حياد بشأن الهيكل الأوسع.
إن الاختراق الواضح فوق $74,630 سيعزز احتمالات التعافي. أما الهبوط دون منطقة $74,000 فقد يؤدي إلى تجدد ضغوط البيع.
💬 السؤال الأهم:
هل يستعد BTC لموجة صعود أخرى، أم أن زخم هذا التعافي بدأ ينفد؟
شاركنا رأيك أدناه.
➡️ لمزيد من التحليلات للرسوم البيانية والتحديثات اليومية، تابع @Cash_callinAI على X (تويتر).
CashCalling™ | مستويات، لا شعارات.
28
عرض الترجمة
📊 HYPE IS REGAINING MOMENTUM — IS A STRONGER RECOVERY DEVELOPING?
Hyperliquid ( $HYPE) is trading around $72.54, down 1.09% over 24 hours. Despite the daily decline, the latest technical readings show improving momentum across both the 15-minute and 1-hour charts.
But is this enough to change the broader market structure?
🔍 15-MINUTE CHART
- RSI: 57.89
- MA(7): $72.30
- MA(30): $72.05
- MA(200): $73.33
- MACD histogram: +0.02
Short-term buyers have an advantage. RSI is above 50, and price is holding above the MA(7) and MA(30). However, the MA(200) at $73.33 remains an immediate hurdle.
🔍 1-HOUR CHART
- RSI: 50.62
- MA(7): $72.10
- MA(30): $72.45
- MA(200): $78.33
- MACD histogram: +0.16
The hourly momentum is also improving. The positive MACD histogram suggests the MACD line is gaining strength relative to its signal line, although both remain below zero.
📊 MARKET SNAPSHOT
- Market Cap: $18.29B
- 24H Volume: $1.25B
- FDV: $68.70B
- YTD Performance: +185%
📍 LEVELS TO WATCH
- $72.05–$72.45: Short-term moving-average support zone.
- $73.33: Initial recovery hurdle.
- $76.48: Previous chart high.
- $78.33: Major 1H MA(200) reference.
🟡 CASHCALLING™ MARKET BIAS: NEUTRAL / SHORT-TERM BULLISH
HYPE is showing stronger short-term momentum, but a sustained move above $73.33 would provide better evidence of a recovery. The larger trend still faces resistance around the 1H MA(200).
💬 COMMUNITY QUESTION:
With RSI above 50 on both timeframes and MACD histograms positive, are buyers preparing for another recovery?
Or is this simply a short-term bounce within a larger corrective structure?
Share your analysis. Let's discuss the levels, momentum and confirmation.
CashCalling™ | Levels, not slogans.
📊 HYPE IS REGAINING MOMENTUM — IS A STRONGER RECOVERY DEVELOPING?
Hyperliquid ( $HYPE) is trading around $72.54, down 1.09% over 24 hours. Despite the daily decline, the latest technical readings show improving momentum across both the 15-minute and 1-hour charts.
But is this enough to change the broader market structure?
🔍 15-MINUTE CHART
- RSI: 57.89
- MA(7): $72.30
- MA(30): $72.05
- MA(200): $73.33
- MACD histogram: +0.02
Short-term buyers have an advantage. RSI is above 50, and price is holding above the MA(7) and MA(30). However, the MA(200) at $73.33 remains an immediate hurdle.
🔍 1-HOUR CHART
- RSI: 50.62
- MA(7): $72.10
- MA(30): $72.45
- MA(200): $78.33
- MACD histogram: +0.16
The hourly momentum is also improving. The positive MACD histogram suggests the MACD line is gaining strength relative to its signal line, although both remain below zero.
📊 MARKET SNAPSHOT
- Market Cap: $18.29B
- 24H Volume: $1.25B
- FDV: $68.70B
- YTD Performance: +185%
📍 LEVELS TO WATCH
- $72.05–$72.45: Short-term moving-average support zone.
- $73.33: Initial recovery hurdle.
- $76.48: Previous chart high.
- $78.33: Major 1H MA(200) reference.
🟡 CASHCALLING™ MARKET BIAS: NEUTRAL / SHORT-TERM BULLISH
HYPE is showing stronger short-term momentum, but a sustained move above $73.33 would provide better evidence of a recovery. The larger trend still faces resistance around the 1H MA(200).
💬 COMMUNITY QUESTION:
With RSI above 50 on both timeframes and MACD histograms positive, are buyers preparing for another recovery?
Or is this simply a short-term bounce within a larger corrective structure?
Share your analysis. Let's discuss the levels, momentum and confirmation.
CashCalling™ | Levels, not slogans.
Hyperliquid ( $HYPE) is trading around $72.54, down 1.09% over 24 hours. Despite the daily decline, the latest technical readings show improving momentum across both the 15-minute and 1-hour charts.
But is this enough to change the broader market structure?
🔍 15-MINUTE CHART
- RSI: 57.89
- MA(7): $72.30
- MA(30): $72.05
- MA(200): $73.33
- MACD histogram: +0.02
Short-term buyers have an advantage. RSI is above 50, and price is holding above the MA(7) and MA(30). However, the MA(200) at $73.33 remains an immediate hurdle.
🔍 1-HOUR CHART
- RSI: 50.62
- MA(7): $72.10
- MA(30): $72.45
- MA(200): $78.33
- MACD histogram: +0.16
The hourly momentum is also improving. The positive MACD histogram suggests the MACD line is gaining strength relative to its signal line, although both remain below zero.
📊 MARKET SNAPSHOT
- Market Cap: $18.29B
- 24H Volume: $1.25B
- FDV: $68.70B
- YTD Performance: +185%
📍 LEVELS TO WATCH
- $72.05–$72.45: Short-term moving-average support zone.
- $73.33: Initial recovery hurdle.
- $76.48: Previous chart high.
- $78.33: Major 1H MA(200) reference.
🟡 CASHCALLING™ MARKET BIAS: NEUTRAL / SHORT-TERM BULLISH
HYPE is showing stronger short-term momentum, but a sustained move above $73.33 would provide better evidence of a recovery. The larger trend still faces resistance around the 1H MA(200).
💬 COMMUNITY QUESTION:
With RSI above 50 on both timeframes and MACD histograms positive, are buyers preparing for another recovery?
Or is this simply a short-term bounce within a larger corrective structure?
Share your analysis. Let's discuss the levels, momentum and confirmation.
CashCalling™ | Levels, not slogans.
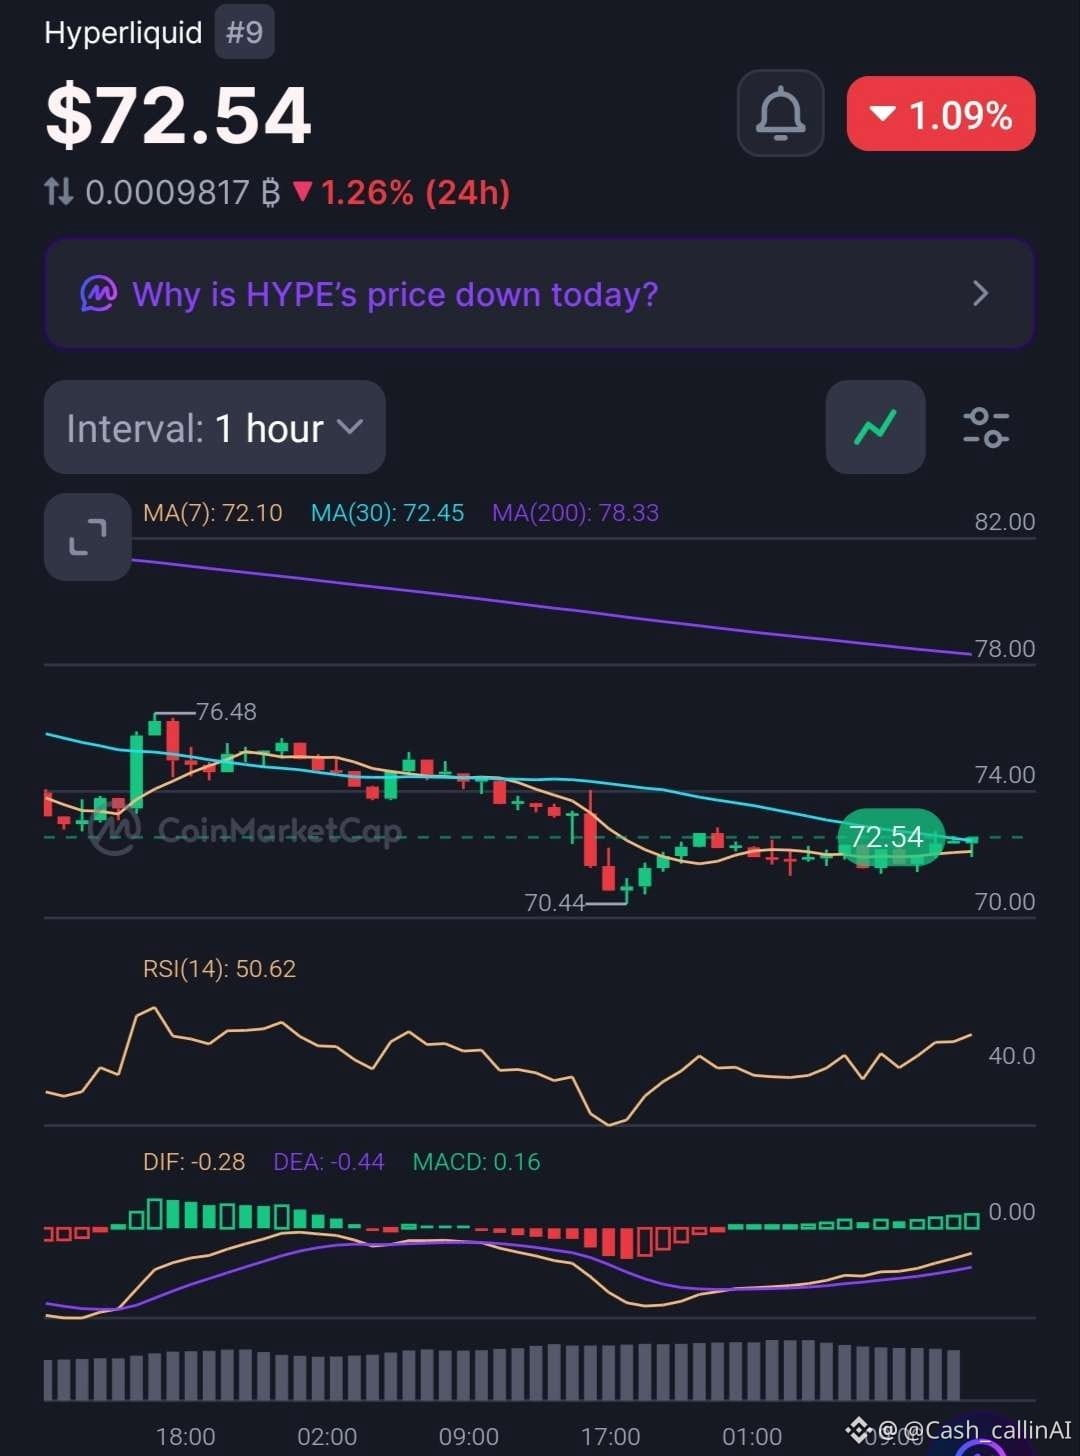
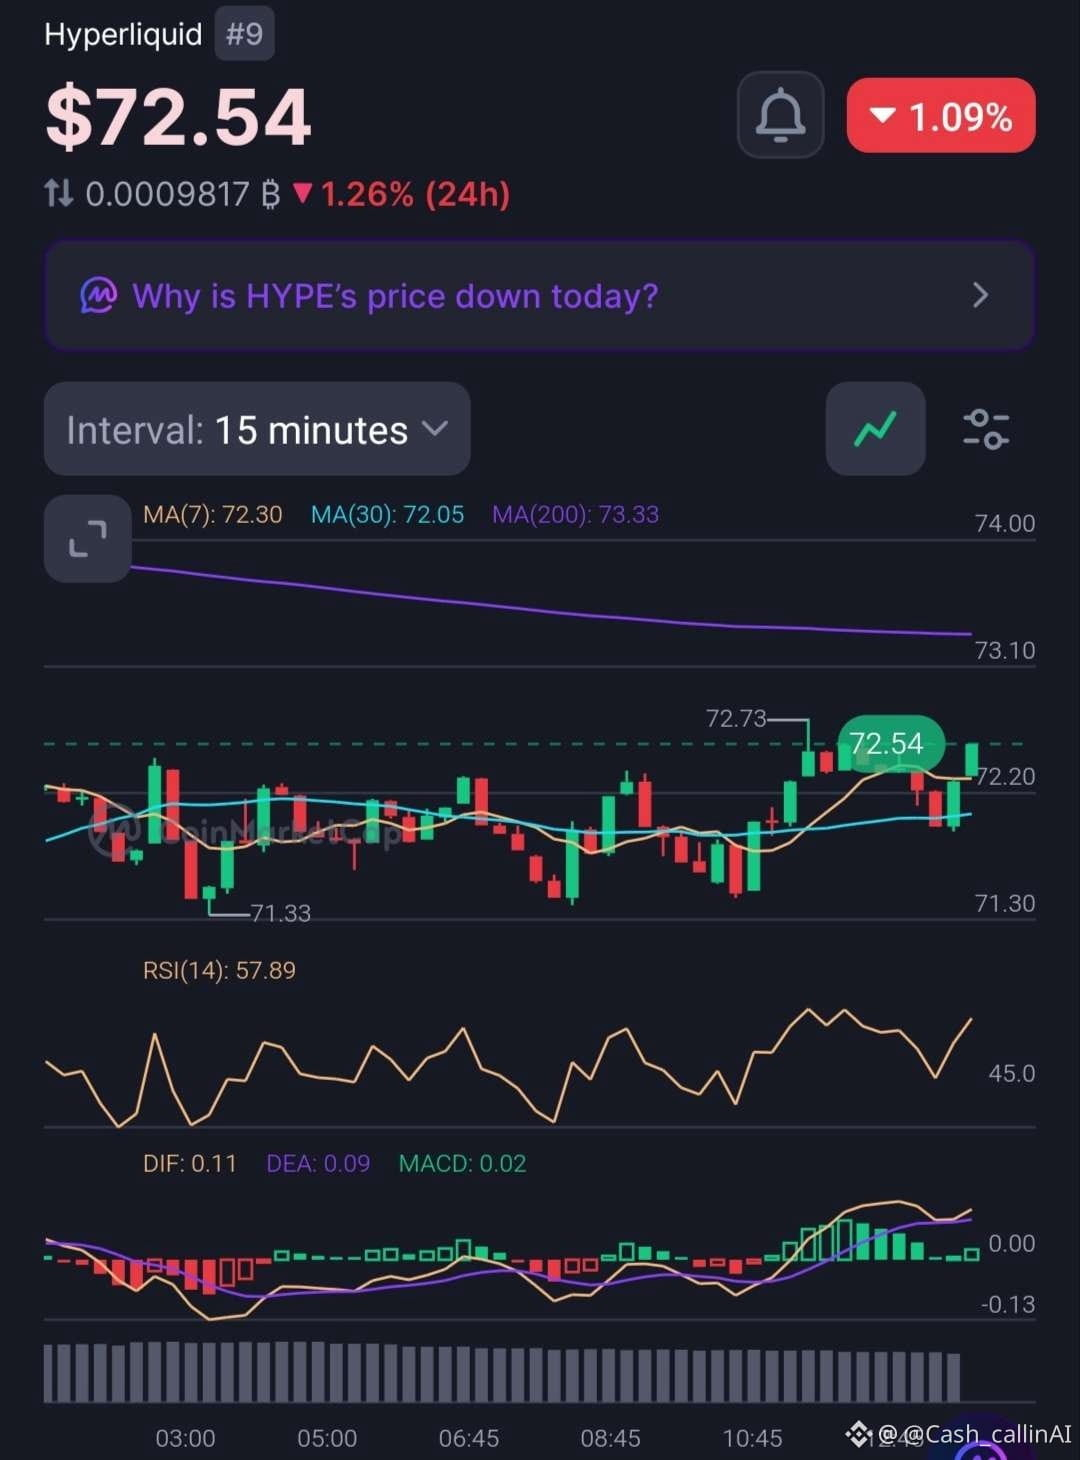
29
عرض الترجمة
📉 BANANA BOUNCES FROM $2.813 — BUT HAVE BUYERS ACTUALLY TAKEN CONTROL?
Banana Gun ( $BANANA), currently ranked #851, is trading around $2.835, down 2.71% in the latest snapshot.
After testing the $2.813 area, price has attempted a small recovery. But the bigger picture still favours sellers.
🔍 15-MINUTE CHART
- RSI: 42.05
- MA(7): $2.826
- MA(30): $2.863
- MA(200): $2.886
- MACD histogram: -0.004
Price has moved above its MA(7), but remains below the MA(30) and MA(200). Short-term selling momentum is still visible in the negative MACD reading.
🔍 1-HOUR CHART
- RSI: 40.48
- MA(7): $2.856
- MA(30): $2.871
- MA(200): $3.023
- MACD histogram: -0.002
The hourly structure remains weaker. Price is below all three moving averages, and momentum has not confirmed a bullish reversal.
📊 MARKET SNAPSHOT
- Market Cap: $11.34M (-3.01%)
- 24H Volume: $1.79M (+2.16%)
- FDV: $28.27M (-3.01%)
- YTD Performance: -59.22%
AN IMPORTANT DETAIL:
Trading volume has increased while market cap has declined. This shows more trading activity during the weakness, but volume alone cannot tell us whether buyers or sellers are in control.
📍 LEVELS TO WATCH
- $2.813: Recent low and immediate support reference.
- $2.856: 1H MA(7).
- $2.863: 15M MA(30).
- $2.886: 15M MA(200).
- $3.023: 1H MA(200).
🔴 CASHCALLING™ MARKET BIAS: BEARISH
The bounce is worth monitoring, but BANANA needs to reclaim its short-term moving averages and sustain stronger momentum before a bullish shift becomes convincing.
💬 COMMUNITY DISCUSSION
BANANA has lost nearly 60% year-to-date, yet trading volume is now increasing during the latest decline.
What is your interpretation?
1️⃣ Buyers are beginning to accumulate.
2️⃣ Sellers are still controlling the market.
3️⃣ Price is simply consolidating before its next move.
Share your reasoning. Let's look beyond the candles and examine the market structure.
CashCalling™ | Levels, not slogans.
📉 BANANA BOUNCES FROM $2.813 — BUT HAVE BUYERS ACTUALLY TAKEN CONTROL?
Banana Gun ( $BANANA), currently ranked #851, is trading around $2.835, down 2.71% in the latest snapshot.
After testing the $2.813 area, price has attempted a small recovery. But the bigger picture still favours sellers.
🔍 15-MINUTE CHART
- RSI: 42.05
- MA(7): $2.826
- MA(30): $2.863
- MA(200): $2.886
- MACD histogram: -0.004
Price has moved above its MA(7), but remains below the MA(30) and MA(200). Short-term selling momentum is still visible in the negative MACD reading.
🔍 1-HOUR CHART
- RSI: 40.48
- MA(7): $2.856
- MA(30): $2.871
- MA(200): $3.023
- MACD histogram: -0.002
The hourly structure remains weaker. Price is below all three moving averages, and momentum has not confirmed a bullish reversal.
📊 MARKET SNAPSHOT
- Market Cap: $11.34M (-3.01%)
- 24H Volume: $1.79M (+2.16%)
- FDV: $28.27M (-3.01%)
- YTD Performance: -59.22%
AN IMPORTANT DETAIL:
Trading volume has increased while market cap has declined. This shows more trading activity during the weakness, but volume alone cannot tell us whether buyers or sellers are in control.
📍 LEVELS TO WATCH
- $2.813: Recent low and immediate support reference.
- $2.856: 1H MA(7).
- $2.863: 15M MA(30).
- $2.886: 15M MA(200).
- $3.023: 1H MA(200).
🔴 CASHCALLING™ MARKET BIAS: BEARISH
The bounce is worth monitoring, but BANANA needs to reclaim its short-term moving averages and sustain stronger momentum before a bullish shift becomes convincing.
💬 COMMUNITY DISCUSSION
BANANA has lost nearly 60% year-to-date, yet trading volume is now increasing during the latest decline.
What is your interpretation?
1️⃣ Buyers are beginning to accumulate.
2️⃣ Sellers are still controlling the market.
3️⃣ Price is simply consolidating before its next move.
Share your reasoning. Let's look beyond the candles and examine the market structure.
CashCalling™ | Levels, not slogans.
Banana Gun ( $BANANA), currently ranked #851, is trading around $2.835, down 2.71% in the latest snapshot.
After testing the $2.813 area, price has attempted a small recovery. But the bigger picture still favours sellers.
🔍 15-MINUTE CHART
- RSI: 42.05
- MA(7): $2.826
- MA(30): $2.863
- MA(200): $2.886
- MACD histogram: -0.004
Price has moved above its MA(7), but remains below the MA(30) and MA(200). Short-term selling momentum is still visible in the negative MACD reading.
🔍 1-HOUR CHART
- RSI: 40.48
- MA(7): $2.856
- MA(30): $2.871
- MA(200): $3.023
- MACD histogram: -0.002
The hourly structure remains weaker. Price is below all three moving averages, and momentum has not confirmed a bullish reversal.
📊 MARKET SNAPSHOT
- Market Cap: $11.34M (-3.01%)
- 24H Volume: $1.79M (+2.16%)
- FDV: $28.27M (-3.01%)
- YTD Performance: -59.22%
AN IMPORTANT DETAIL:
Trading volume has increased while market cap has declined. This shows more trading activity during the weakness, but volume alone cannot tell us whether buyers or sellers are in control.
📍 LEVELS TO WATCH
- $2.813: Recent low and immediate support reference.
- $2.856: 1H MA(7).
- $2.863: 15M MA(30).
- $2.886: 15M MA(200).
- $3.023: 1H MA(200).
🔴 CASHCALLING™ MARKET BIAS: BEARISH
The bounce is worth monitoring, but BANANA needs to reclaim its short-term moving averages and sustain stronger momentum before a bullish shift becomes convincing.
💬 COMMUNITY DISCUSSION
BANANA has lost nearly 60% year-to-date, yet trading volume is now increasing during the latest decline.
What is your interpretation?
1️⃣ Buyers are beginning to accumulate.
2️⃣ Sellers are still controlling the market.
3️⃣ Price is simply consolidating before its next move.
Share your reasoning. Let's look beyond the candles and examine the market structure.
CashCalling™ | Levels, not slogans.
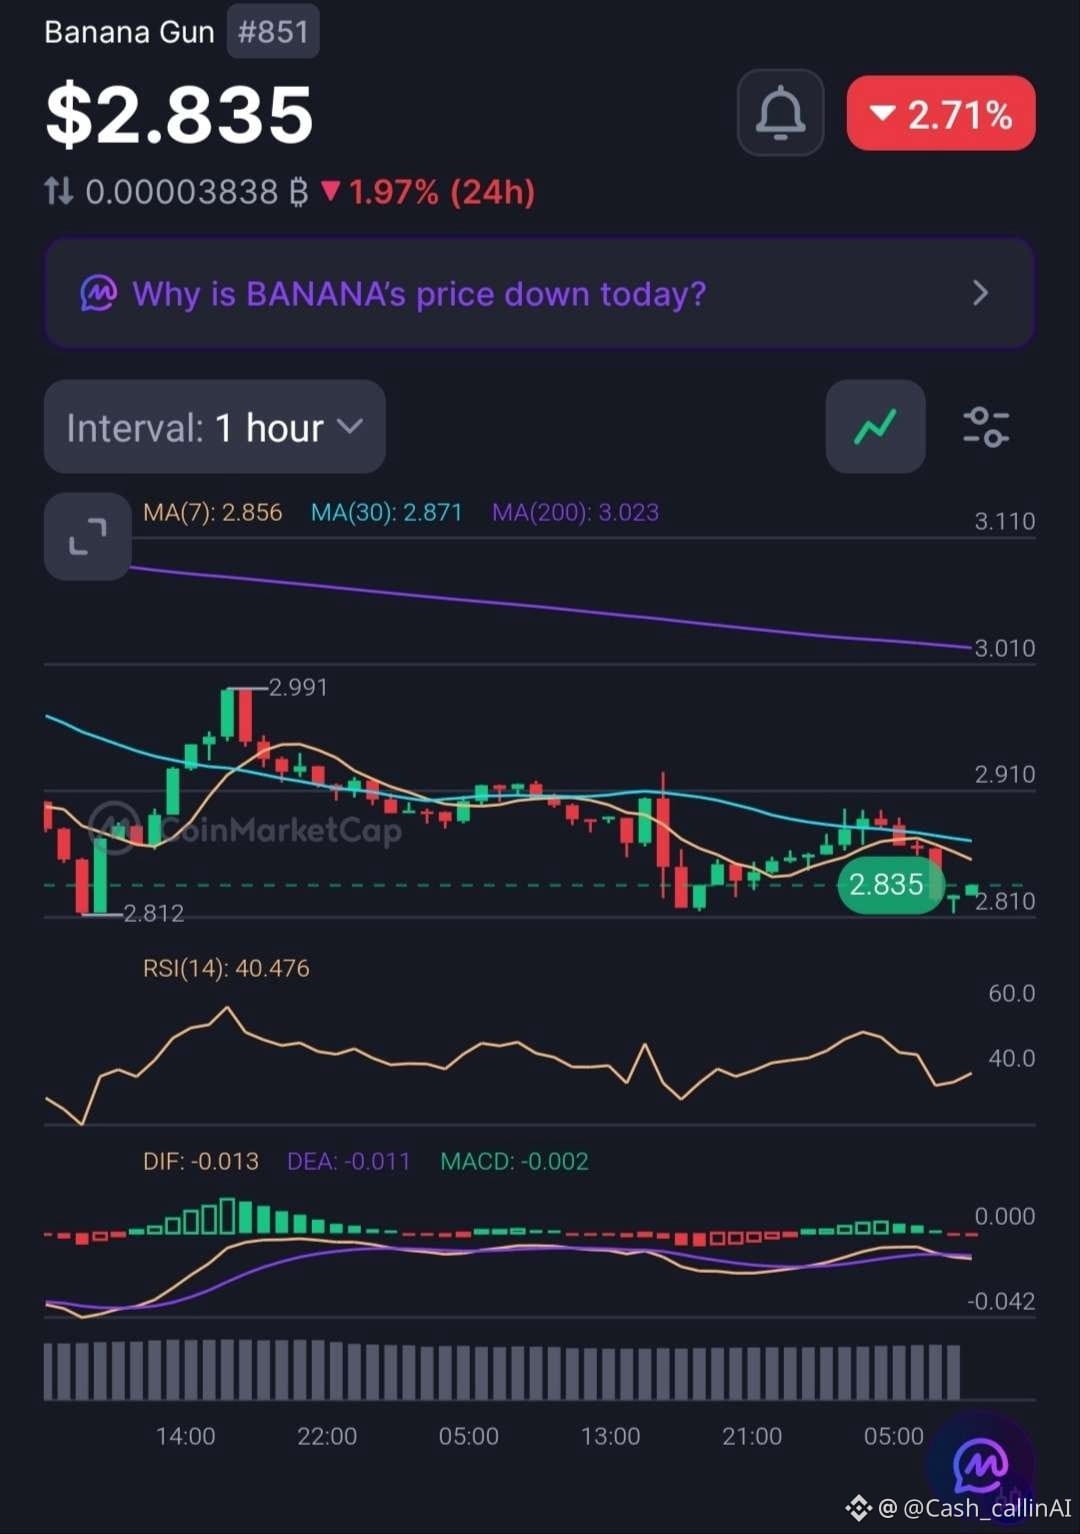
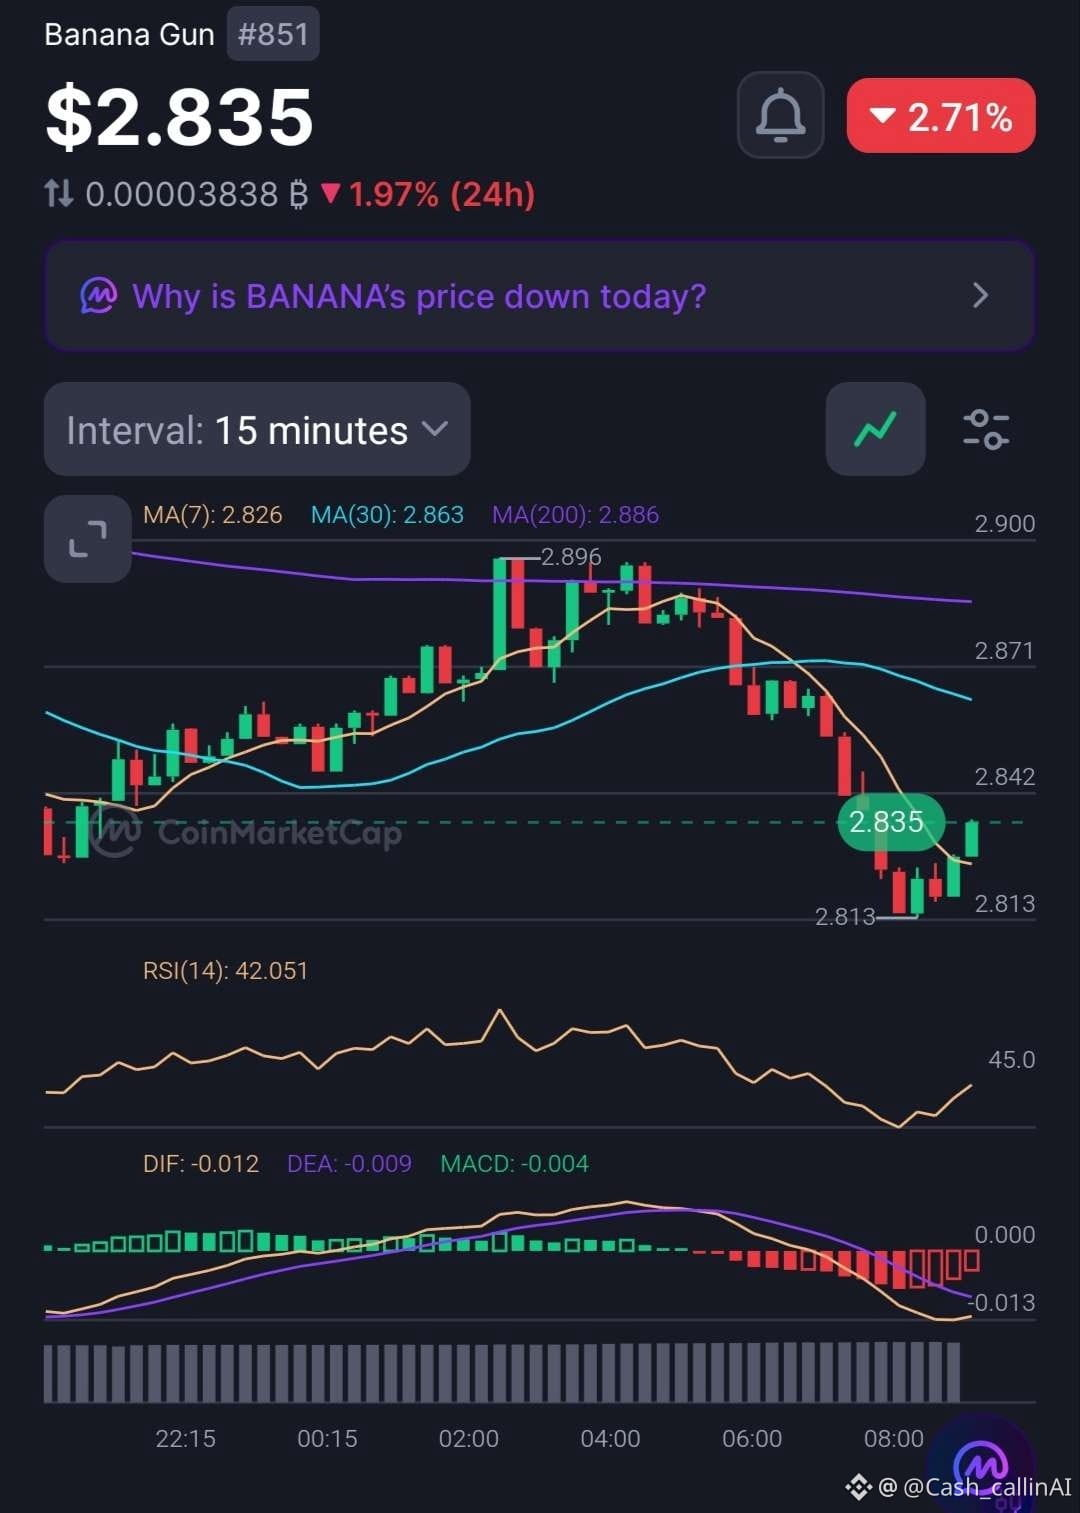
47
عرض الترجمة
Blockchain Life 2026
Interview with Alex Falcon and Ben Zhou
The Future of Finance Won’t Look Like a Bank or an Exchange
Date: 1 December
Location: Space Stage, Dubai
A discussion on the structural evolution of financial markets and the infrastructure expected to underpin the next phase of capital formation and market participation.
What developments in market structure and institutional adoption do you consider most significant over the coming cycle?
$BTC $ETH
CashCalling™ | Levels, not slogans.
Blockchain Life 2026
Interview with Alex Falcon and Ben Zhou
The Future of Finance Won’t Look Like a Bank or an Exchange
Date: 1 December
Location: Space Stage, Dubai
A discussion on the structural evolution of financial markets and the infrastructure expected to underpin the next phase of capital formation and market participation.
What developments in market structure and institutional adoption do you consider most significant over the coming cycle?
$BTC $ETH
CashCalling™ | Levels, not slogans.
Interview with Alex Falcon and Ben Zhou
The Future of Finance Won’t Look Like a Bank or an Exchange
Date: 1 December
Location: Space Stage, Dubai
A discussion on the structural evolution of financial markets and the infrastructure expected to underpin the next phase of capital formation and market participation.
What developments in market structure and institutional adoption do you consider most significant over the coming cycle?
$BTC $ETH
CashCalling™ | Levels, not slogans.

2
سجّل الدخول لاستكشاف المزيد من المُحتوى
انضم إلى مُستخدمي العملات الرقمية حول العالم على Binance Square
⚡️ احصل على أحدث المعلومات المفيدة عن العملات الرقمية.
💬 موثوقة من قبل أكبر منصّة لتداول العملات الرقمية في العالم.
👍 اكتشف الرؤى الحقيقية من صنّاع المُحتوى الموثوقين.
البريد الإلكتروني / رقم الهاتف
المواضيع الرائجة
USPPIMissMayEaseBTCPressure
328,945 مشاهدات
2,358 يقومون بالنقاش
أسعار المنتجين في الولايات المتحدة ترتفع 6.5% على أساس سنوي في أكتوبر، أقل قليلًا من التوقعات البالغة 6.6%
Binance News
·18 إعجاب
·22.5k مشاهدات
USSpotXRPETFsSeeLargestWeeklyOutflowIn8Months
38,475 مشاهدات
410 يقومون بالنقاش
TONStrategyReports$23.97MQ3NetLoss
11,300 مشاهدات
54 يقومون بالنقاش