
Kamile Uray 1
54 منشورات

Kamile Uray 1
إبلاغ
حظر المُستخدم
Economist, Halkbank Financial Analysis Expert, Strategic Planning Manager of the Ministry of Commerce, Trader & Investor & Trainer
0 تتابع
2 المتابعون
4 إعجاب
منشورات
عرض الترجمة
#BTC US producer inflation data is due today; markets tend to tread cautiously on data release days and experience sharp volatility once the figures are announced.
Therefore, short-term traders, in particular, should exercise caution.
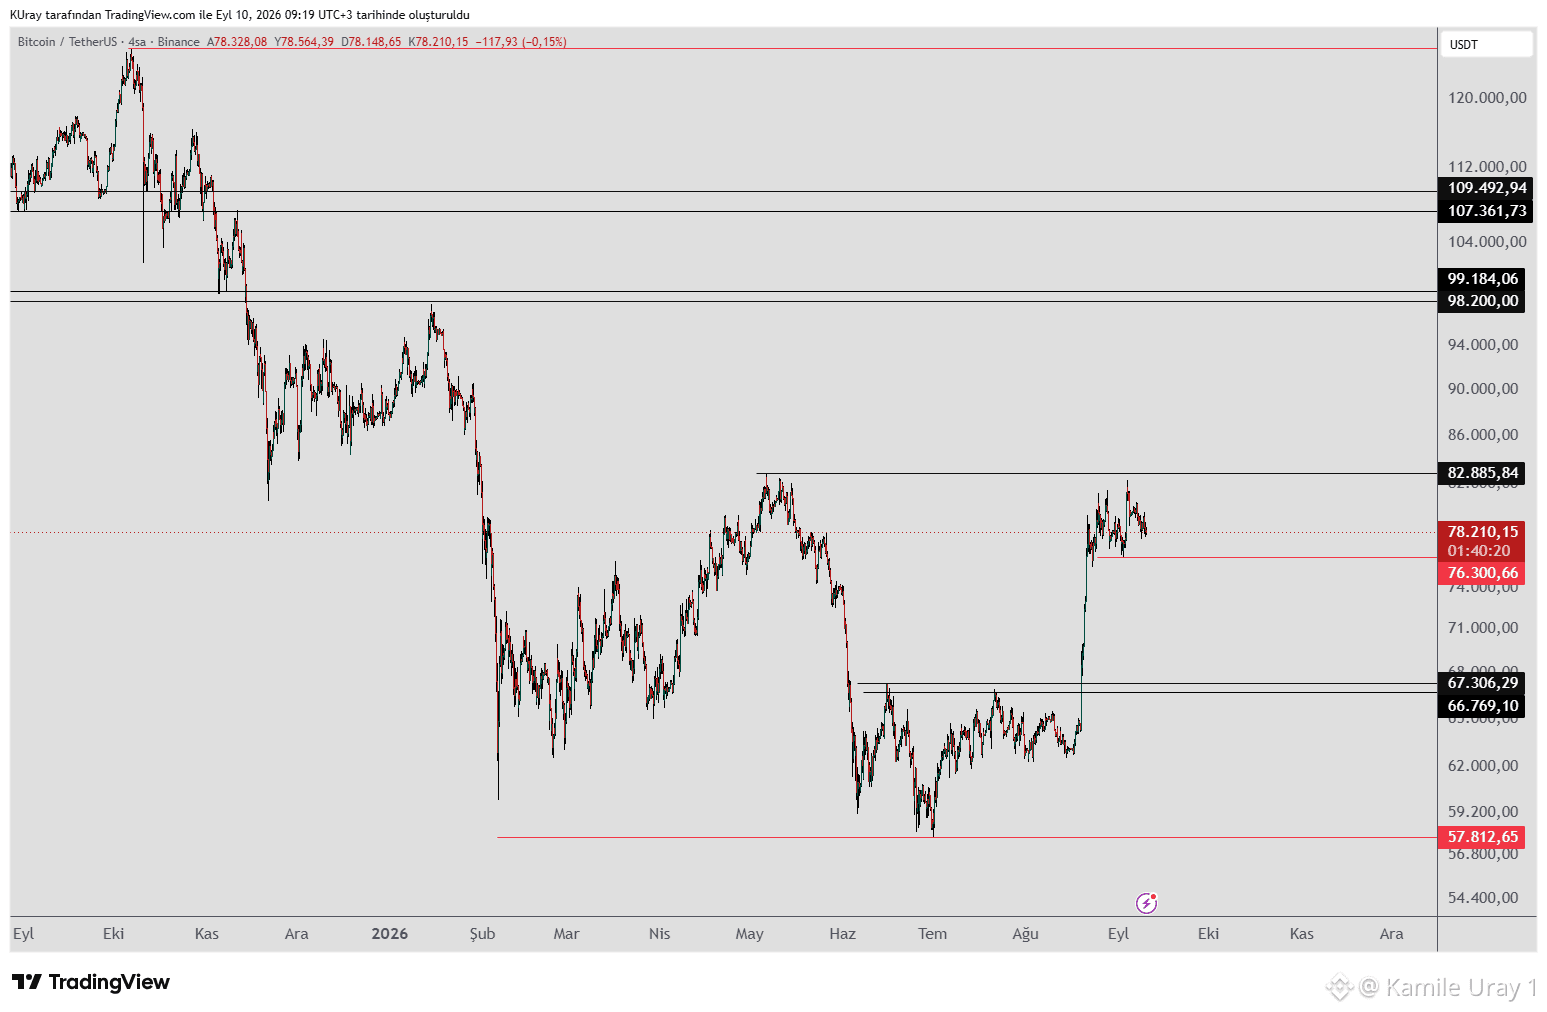
As for BTC, the levels we are monitoring are clear: the potential for an upward move remains as long as the price stays above 76,300.
If a daily or weekly close occurs above 82,885, it would mark the first higher high relative to the most recent downward wave. This would provide a further signal that the uptrend is likely to continue, allowing us to monitor higher resistance levels thereafter.
If the price closes below 76,300, there is a possibility of testing the support zone around 67,000–66,000. Such a decline could form the final shoulder of a potential inverse head-and-shoulders (H&S) pattern. If the price subsequently holds above 83,000, the pattern would be activated, and a continued rise toward higher resistance levels would be expected.
#BTC US producer inflation data is due today; markets tend to tread cautiously on data release days and experience sharp volatility once the figures are announced.
Therefore, short-term traders, in particular, should exercise caution.
As for BTC, the levels we are monitoring are clear: the potential for an upward move remains as long as the price stays above 76,300.
If a daily or weekly close occurs above 82,885, it would mark the first higher high relative to the most recent downward wave. This would provide a further signal that the uptrend is likely to continue, allowing us to monitor higher resistance levels thereafter.
If the price closes below 76,300, there is a possibility of testing the support zone around 67,000–66,000. Such a decline could form the final shoulder of a potential inverse head-and-shoulders (H&S) pattern. If the price subsequently holds above 83,000, the pattern would be activated, and a continued rise toward higher resistance levels would be expected.
Therefore, short-term traders, in particular, should exercise caution.
As for BTC, the levels we are monitoring are clear: the potential for an upward move remains as long as the price stays above 76,300.
If a daily or weekly close occurs above 82,885, it would mark the first higher high relative to the most recent downward wave. This would provide a further signal that the uptrend is likely to continue, allowing us to monitor higher resistance levels thereafter.
If the price closes below 76,300, there is a possibility of testing the support zone around 67,000–66,000. Such a decline could form the final shoulder of a potential inverse head-and-shoulders (H&S) pattern. If the price subsequently holds above 83,000, the pattern would be activated, and a continued rise toward higher resistance levels would be expected.
65
عرض الترجمة
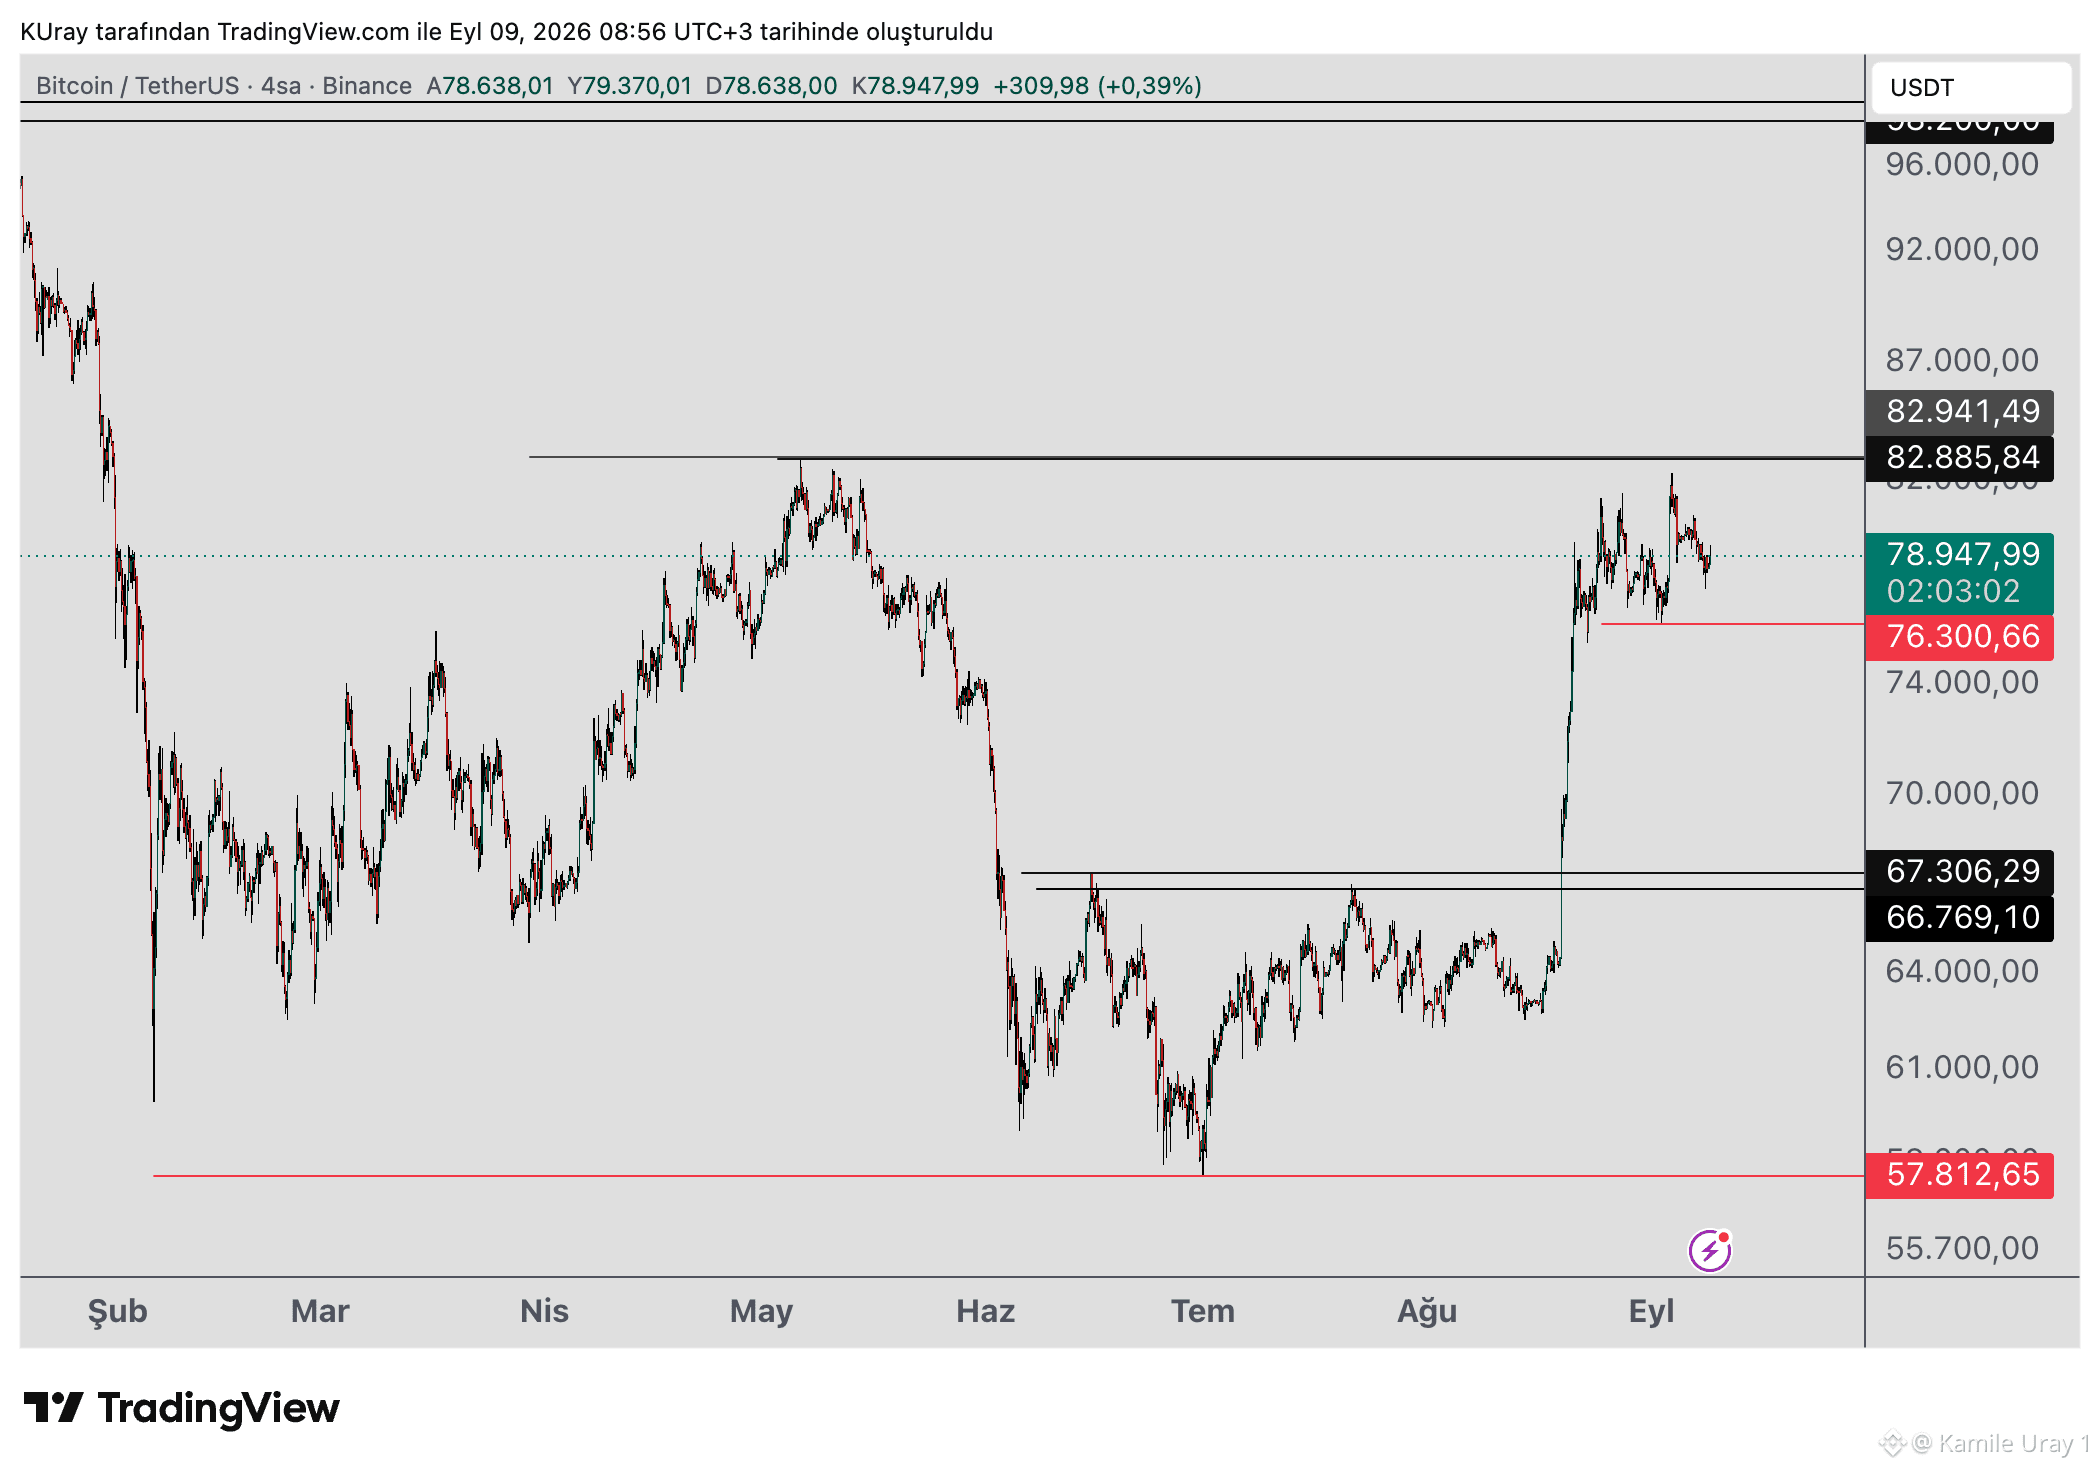
#BTC The potential for an upward move remains as long as it stays above the 76,300 level. If a daily or weekly close occurs above 82,885, it would mark the first higher peak relative to the most recent downward wave. This would provide a further signal that the uptrend is likely to continue, after which higher resistance levels can be monitored. If the price closes below 76,300, there is a possibility of testing the support zone around 67,000–66,000. Such a decline could form the final shoulder of a potential inverse head-and-shoulders (H&S) pattern. If it holds above 83,000, the pattern would become active, and the price would be expected to continue rising toward higher resistance levels.
#BTC The potential for an upward move remains as long as it stays above the 76,300 level. If a daily or weekly close occurs above 82,885, it would mark the first higher peak relative to the most recent downward wave. This would provide a further signal that the uptrend is likely to continue, after which higher resistance levels can be monitored. If the price closes below 76,300, there is a possibility of testing the support zone around 67,000–66,000. Such a decline could form the final shoulder of a potential inverse head-and-shoulders (H&S) pattern. If it holds above 83,000, the pattern would become active, and the price would be expected to continue rising toward higher resistance levels.
56
عرض الترجمة
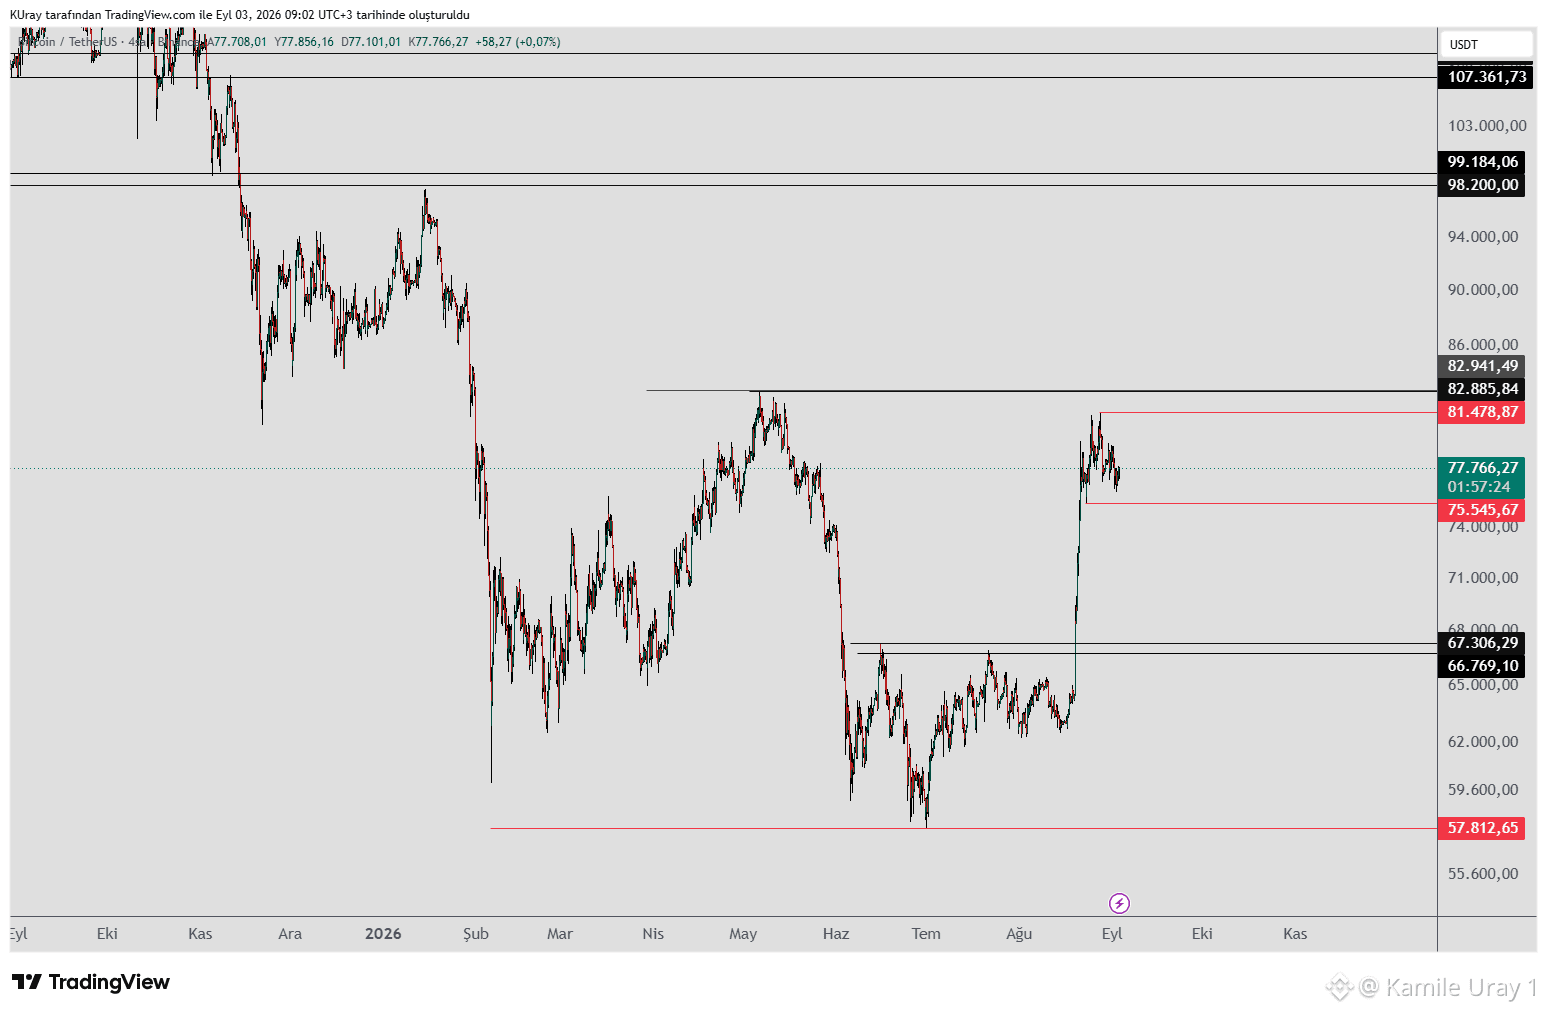
#BTC has been moving within the 81,478–75,545 range—a $6,000 spread—for the past eight days.
If the price closes below 75,545, there is a possibility of testing the support zone around 67,000–66,000. Such a decline could form the final shoulder of a potential Inverse Head and Shoulders (IH&S) pattern. Although a drop is anticipated, the potential for a larger bullish IH&S pattern is emerging; if the price holds above 83,000, the pattern would activate, and a continued rise toward upper resistance levels would be expected.
If daily and weekly closes occur above 82,885, it would mark the first higher high relative to the most recent downward wave, providing another positive signal that the upward trend is likely to continue.
#BTC has been moving within the 81,478–75,545 range—a $6,000 spread—for the past eight days.
If the price closes below 75,545, there is a possibility of testing the support zone around 67,000–66,000. Such a decline could form the final shoulder of a potential Inverse Head and Shoulders (IH&S) pattern. Although a drop is anticipated, the potential for a larger bullish IH&S pattern is emerging; if the price holds above 83,000, the pattern would activate, and a continued rise toward upper resistance levels would be expected.
If daily and weekly closes occur above 82,885, it would mark the first higher high relative to the most recent downward wave, providing another positive signal that the upward trend is likely to continue.
If the price closes below 75,545, there is a possibility of testing the support zone around 67,000–66,000. Such a decline could form the final shoulder of a potential Inverse Head and Shoulders (IH&S) pattern. Although a drop is anticipated, the potential for a larger bullish IH&S pattern is emerging; if the price holds above 83,000, the pattern would activate, and a continued rise toward upper resistance levels would be expected.
If daily and weekly closes occur above 82,885, it would mark the first higher high relative to the most recent downward wave, providing another positive signal that the upward trend is likely to continue.
72
عرض الترجمة
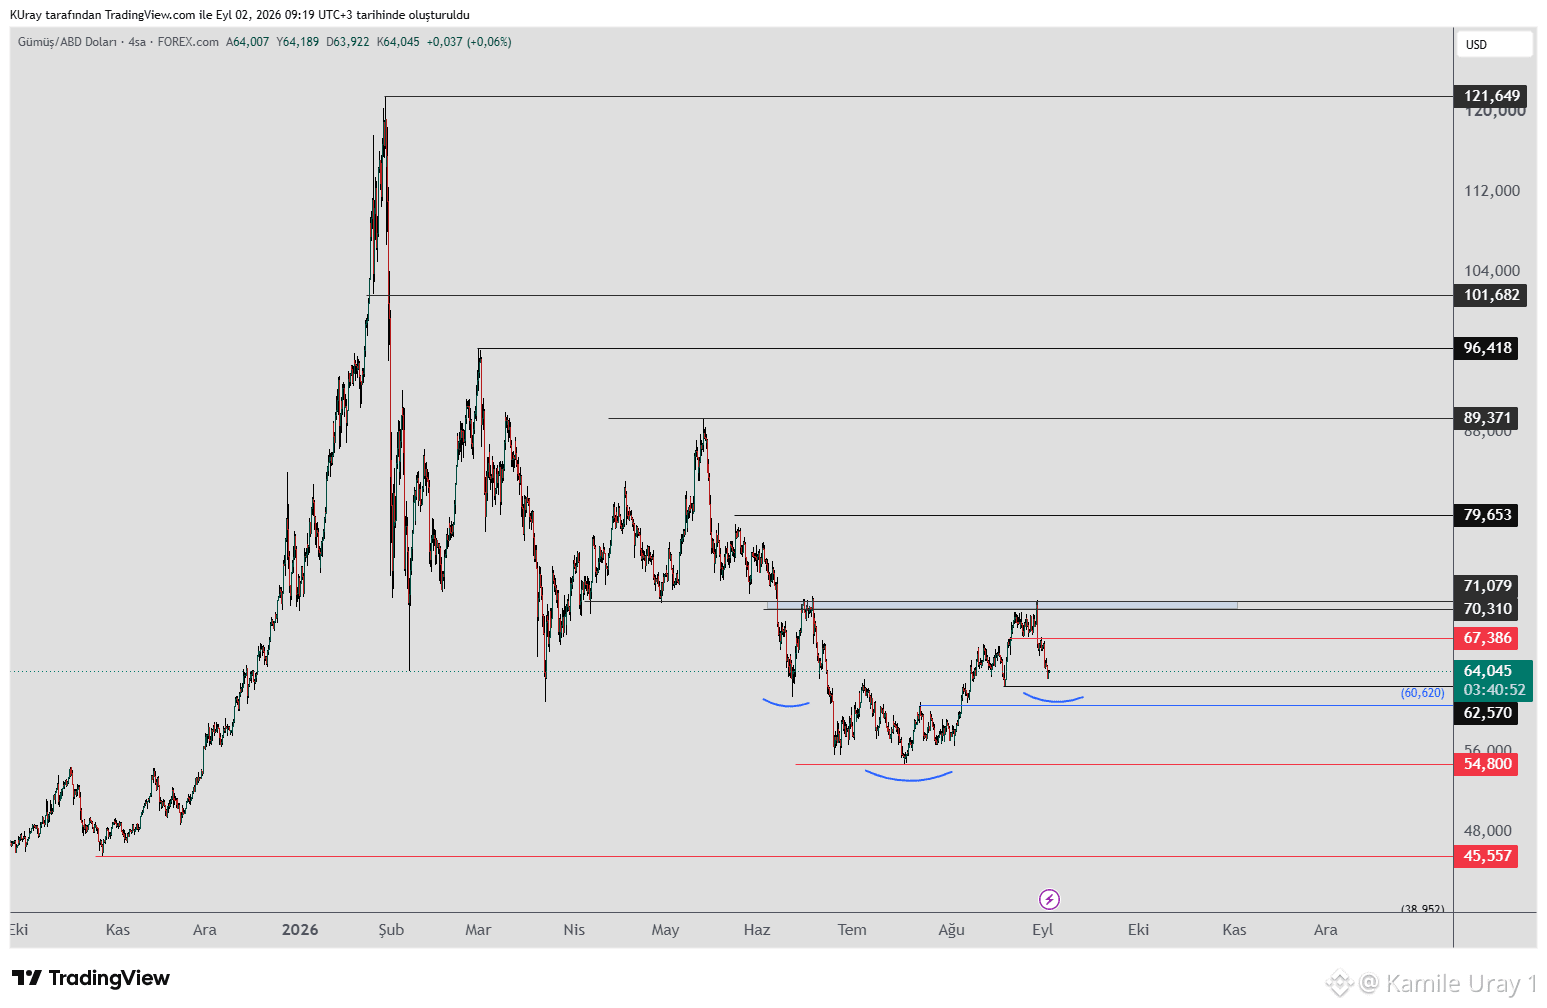
For #XAG (Silver), we will be monitoring the resistance at the "blue box" on the daily chart. Specifically, if the price breaks above the blue box located in the 70–71 range and closes there, further upward movement is expected; we can then look toward the 79 and 89 resistance levels.
The potential for an upward move remains as long as the price stays above the 62 level. If it drops below 62, we will monitor lower support levels. A renewed rise is expected if the price finds support during declines.
Looking at the price waves, the downward movements continue to appear as corrections to the overall uptrend.
For #XAG (Silver), we will be monitoring the resistance at the "blue box" on the daily chart. Specifically, if the price breaks above the blue box located in the 70–71 range and closes there, further upward movement is expected; we can then look toward the 79 and 89 resistance levels.
The potential for an upward move remains as long as the price stays above the 62 level. If it drops below 62, we will monitor lower support levels. A renewed rise is expected if the price finds support during declines.
Looking at the price waves, the downward movements continue to appear as corrections to the overall uptrend.
The potential for an upward move remains as long as the price stays above the 62 level. If it drops below 62, we will monitor lower support levels. A renewed rise is expected if the price finds support during declines.
Looking at the price waves, the downward movements continue to appear as corrections to the overall uptrend.
58
عرض الترجمة
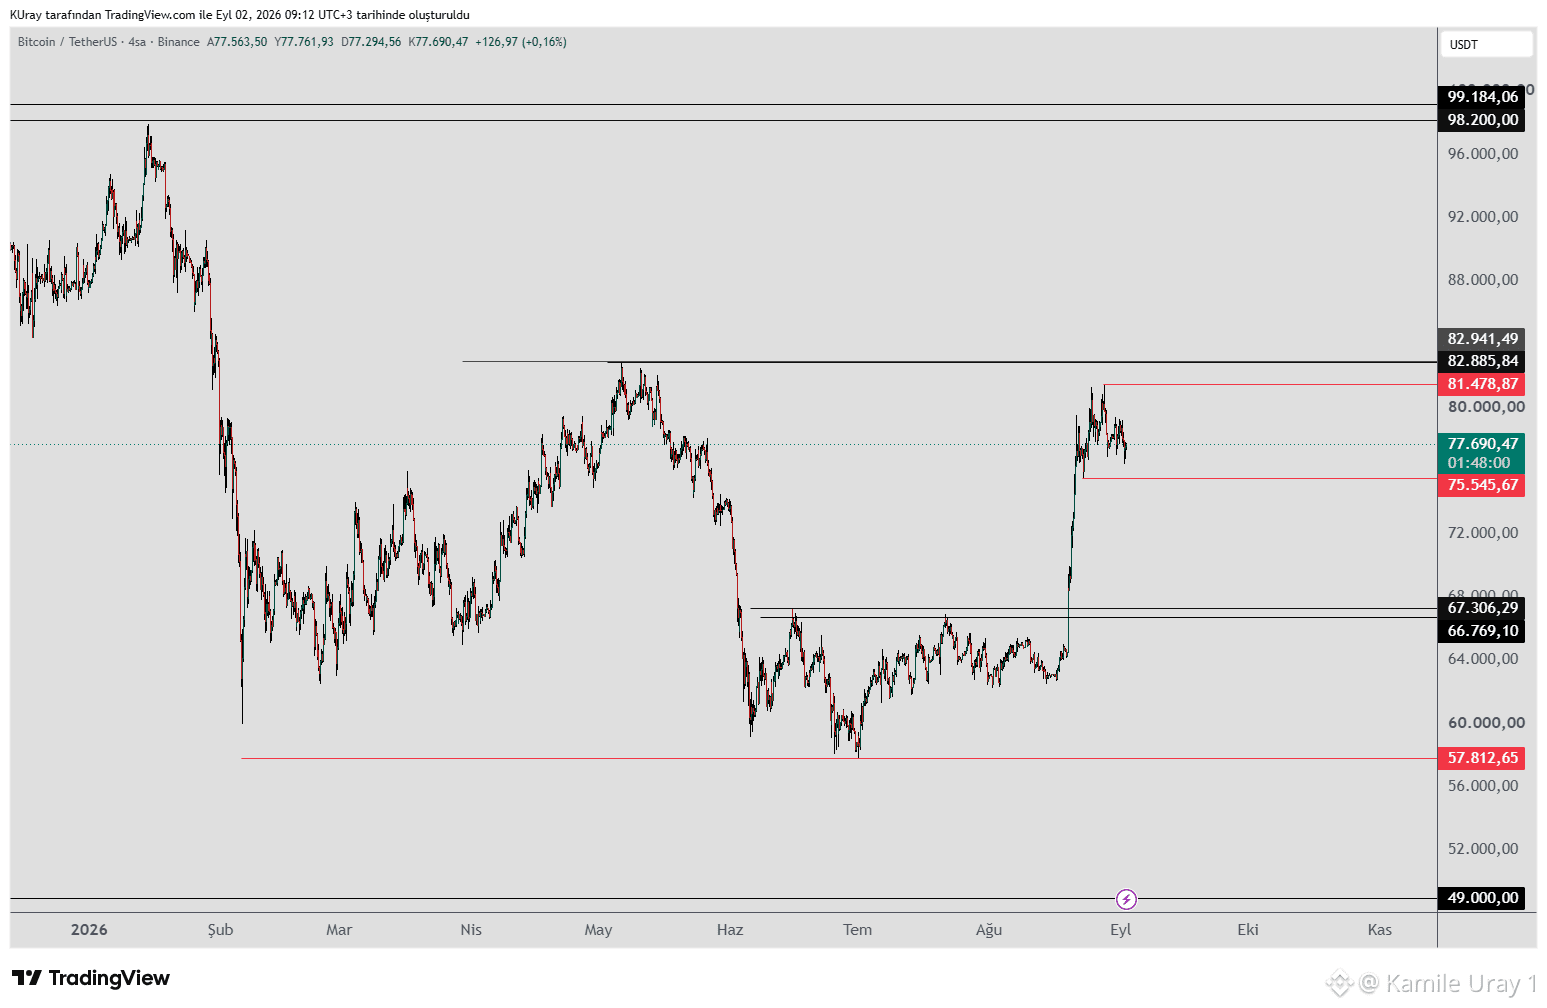
#BTC remains unchanged, trading within the 81,478–75,545 range. The current structure reinforces the likelihood of a continued decline; notably, the rebound following the last downward wave failed to close above the previous peak.
If the price closes below 75,545, it may test the support zone around 67,000–66,000.
These declines could potentially form the final shoulder of an Inverse Head and Shoulders (H&S) pattern.
Although a decline is anticipated, the possibility of a larger bullish Inverse H&S pattern is emerging.
If the price holds above 83,000, the pattern would activate, and a continued rise toward upper resistance levels would be expected.
A daily or weekly close above 82,885 would mark the first higher peak relative to the recent downward wave, serving as a positive signal that the upward trend is likely to continue.
#BTC remains unchanged, trading within the 81,478–75,545 range. The current structure reinforces the likelihood of a continued decline; notably, the rebound following the last downward wave failed to close above the previous peak.
If the price closes below 75,545, it may test the support zone around 67,000–66,000.
These declines could potentially form the final shoulder of an Inverse Head and Shoulders (H&S) pattern.
Although a decline is anticipated, the possibility of a larger bullish Inverse H&S pattern is emerging.
If the price holds above 83,000, the pattern would activate, and a continued rise toward upper resistance levels would be expected.
A daily or weekly close above 82,885 would mark the first higher peak relative to the recent downward wave, serving as a positive signal that the upward trend is likely to continue.
If the price closes below 75,545, it may test the support zone around 67,000–66,000.
These declines could potentially form the final shoulder of an Inverse Head and Shoulders (H&S) pattern.
Although a decline is anticipated, the possibility of a larger bullish Inverse H&S pattern is emerging.
If the price holds above 83,000, the pattern would activate, and a continued rise toward upper resistance levels would be expected.
A daily or weekly close above 82,885 would mark the first higher peak relative to the recent downward wave, serving as a positive signal that the upward trend is likely to continue.
71
عرض الترجمة
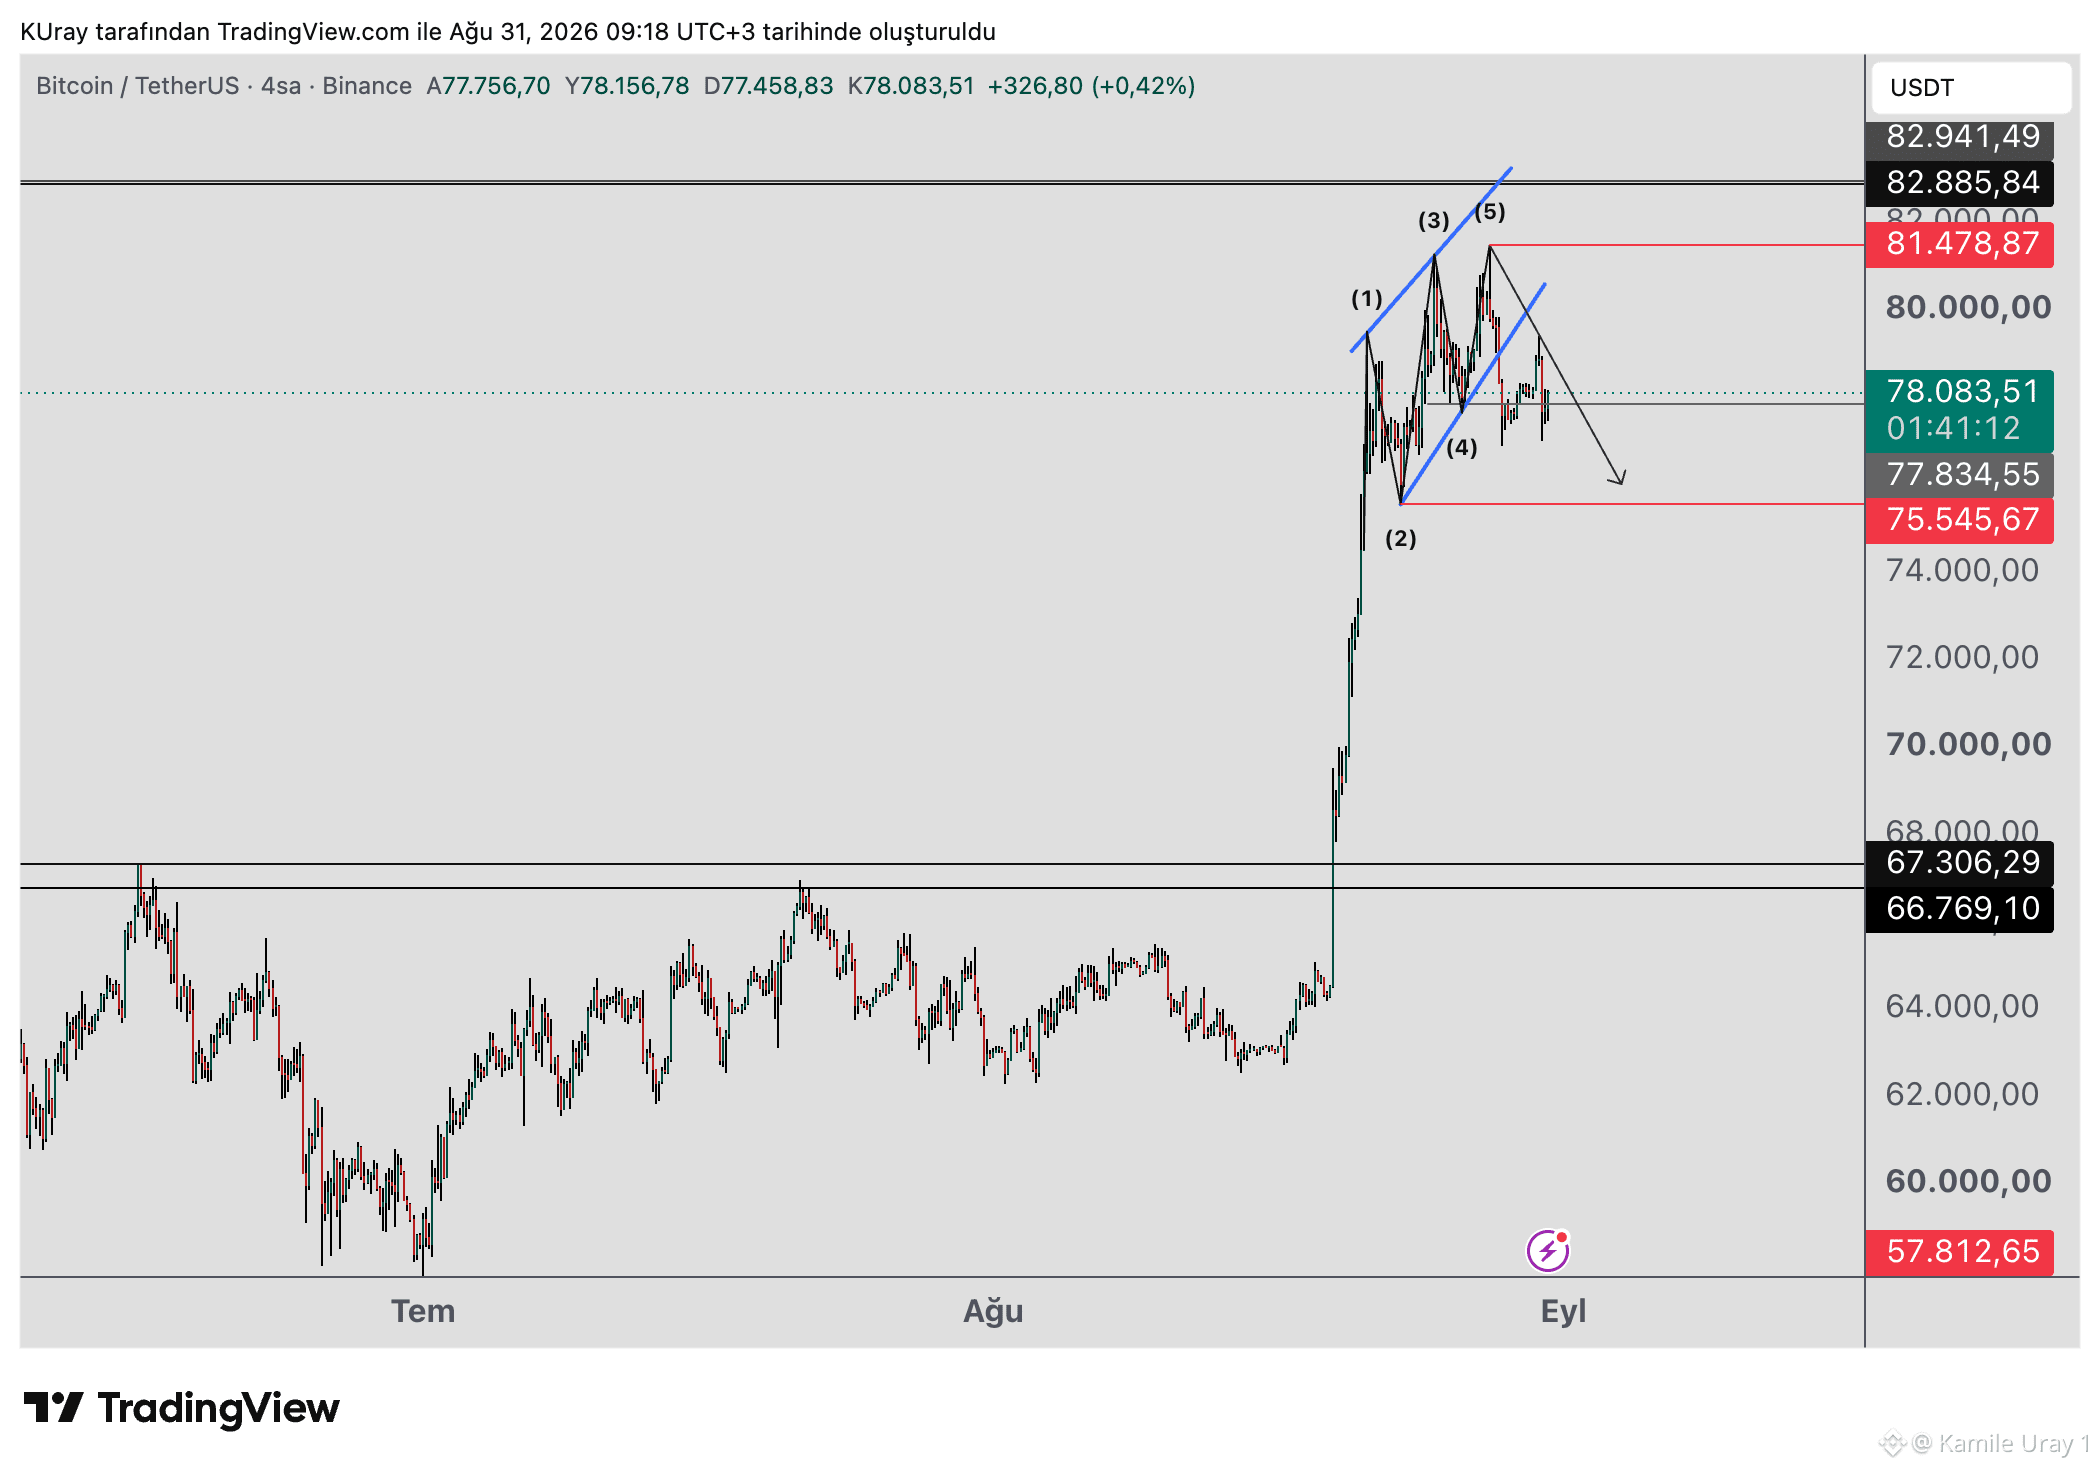
#BTC dropped before it could complete the Wolfe Wave pattern; the wedge structure played out instead. Sell pressure had built up at the peaks marked '3' and '5' within the wedge. Candlesticks with long upper wicks formed at the highs—a key indicator that this structure was likely to trigger a move. Additionally, an RSI divergence during the rise provided a secondary bearish signal, confirming the wedge's validity. We will now monitor the 81,478 peak; failure to close a 4-hour candle above this level implies the decline will continue. The 75,545 level serves as the first support during the drop; if the price holds below this, the decline could extend further, potentially testing the support zone around 67,000–66,000. This decline likely forms the final shoulder of an Inverse Head and Shoulders (IH&S) pattern; if the price holds above 83,000, the pattern activates, and a continued rise toward upper resistance levels would be expected. If the price closes above 82,885 on both daily and weekly timeframes, it would mark the first higher high relative to the recent bearish wave, providing a positive signal that the upward trend is set to continue.
#BTC dropped before it could complete the Wolfe Wave pattern; the wedge structure played out instead. Sell pressure had built up at the peaks marked '3' and '5' within the wedge. Candlesticks with long upper wicks formed at the highs—a key indicator that this structure was likely to trigger a move. Additionally, an RSI divergence during the rise provided a secondary bearish signal, confirming the wedge's validity. We will now monitor the 81,478 peak; failure to close a 4-hour candle above this level implies the decline will continue. The 75,545 level serves as the first support during the drop; if the price holds below this, the decline could extend further, potentially testing the support zone around 67,000–66,000. This decline likely forms the final shoulder of an Inverse Head and Shoulders (IH&S) pattern; if the price holds above 83,000, the pattern activates, and a continued rise toward upper resistance levels would be expected. If the price closes above 82,885 on both daily and weekly timeframes, it would mark the first higher high relative to the recent bearish wave, providing a positive signal that the upward trend is set to continue.
53
عرض الترجمة
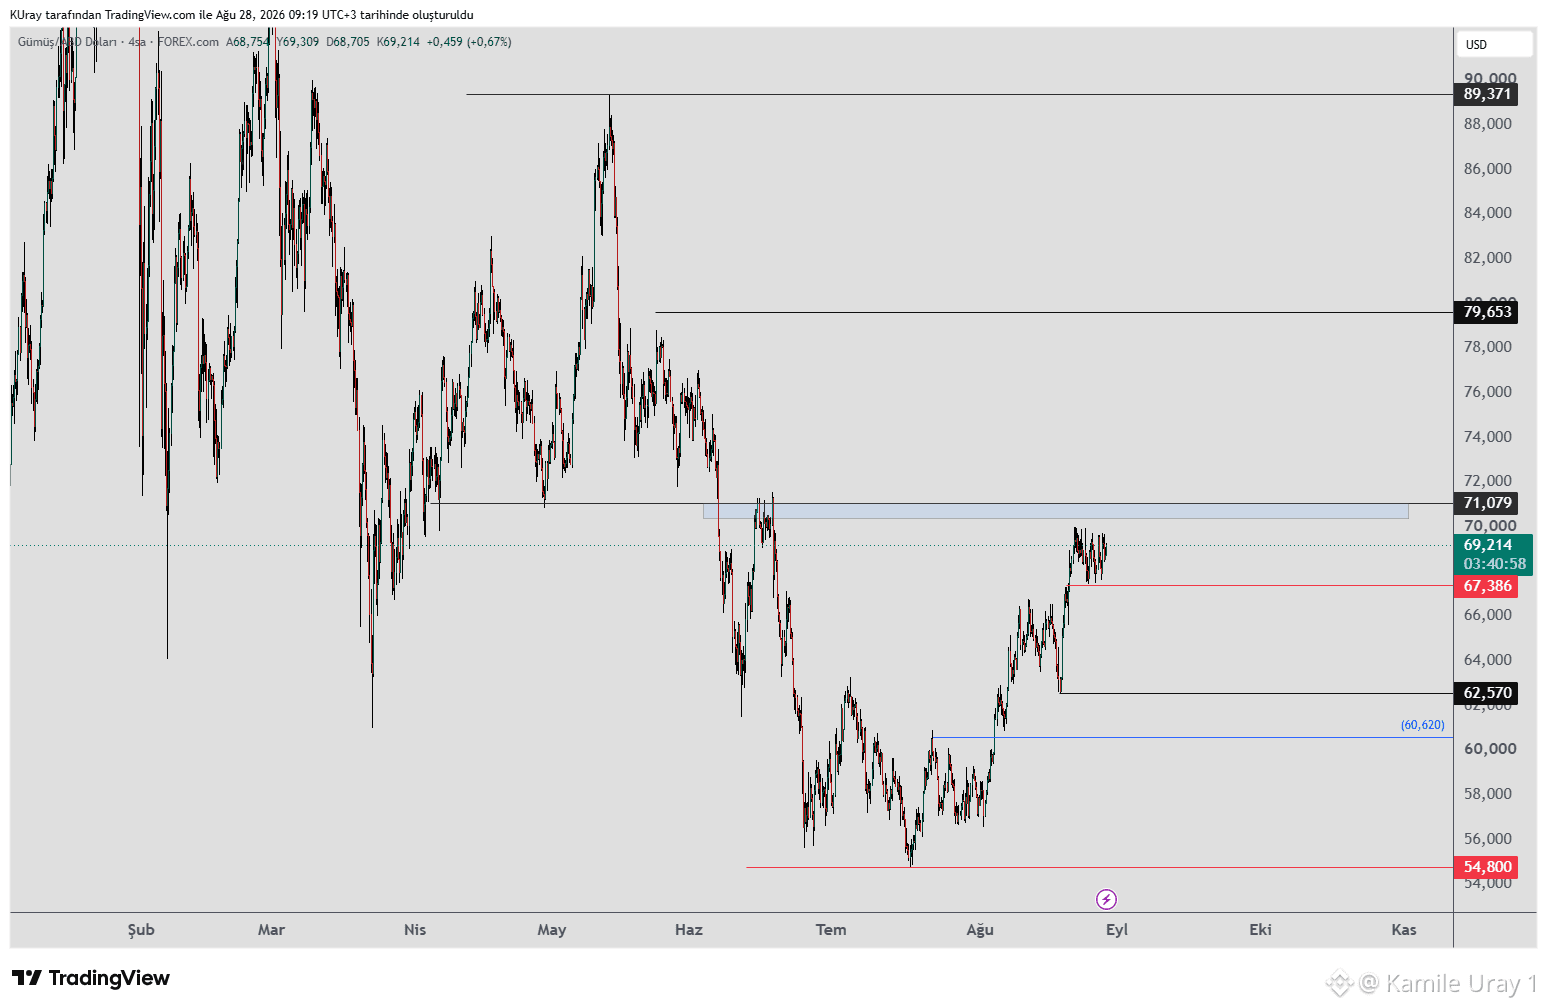
#xag #Silver is trading within a narrow range.
It is holding the 67 level but failing to close above 71; it is currently in a consolidation phase. Remaining above the 67 level keeps the possibility of an upward move alive.
If it sustains a position above the blue box at the 71 level, we will monitor the 79–89 resistance levels.
However, if it fails to break the blue box resistance and closes below 67, the decline could continue.
Regarding the downside, the potential for an upward move remains as long as the price holds above the 62 level on the 4-hour chart. If it drops below 62, we will look to lower support levels.
#xag #Silver is trading within a narrow range.
It is holding the 67 level but failing to close above 71; it is currently in a consolidation phase. Remaining above the 67 level keeps the possibility of an upward move alive.
If it sustains a position above the blue box at the 71 level, we will monitor the 79–89 resistance levels.
However, if it fails to break the blue box resistance and closes below 67, the decline could continue.
Regarding the downside, the potential for an upward move remains as long as the price holds above the 62 level on the 4-hour chart. If it drops below 62, we will look to lower support levels.
It is holding the 67 level but failing to close above 71; it is currently in a consolidation phase. Remaining above the 67 level keeps the possibility of an upward move alive.
If it sustains a position above the blue box at the 71 level, we will monitor the 79–89 resistance levels.
However, if it fails to break the blue box resistance and closes below 67, the decline could continue.
Regarding the downside, the potential for an upward move remains as long as the price holds above the 62 level on the 4-hour chart. If it drops below 62, we will look to lower support levels.
62
عرض الترجمة
We are monitoring the potential for a Wolfe Wave pattern on #BTC . If the price rises to the 82,400–82,900 zone, a downward movement could begin from there.
The stop level for the pattern is a 4-hour candle close above 83,769; in that event, the pattern would be invalidated.
On the downside, the 75,545 level is the initial target. If the price drops below this, the decline could extend further. This drop would likely form the final shoulder of an inverse head-and-shoulders (H&S) structure; if the price then holds above 83,000, the pattern would activate, and a continued rise toward upper resistance levels would be expected.
If a daily or weekly close occurs above 82,885, it would mark the first higher peak relative to the most recent downward wave. This serves as a positive signal indicating that the upward trend is likely to continue.
We are monitoring the potential for a Wolfe Wave pattern on #BTC . If the price rises to the 82,400–82,900 zone, a downward movement could begin from there.
The stop level for the pattern is a 4-hour candle close above 83,769; in that event, the pattern would be invalidated.
On the downside, the 75,545 level is the initial target. If the price drops below this, the decline could extend further. This drop would likely form the final shoulder of an inverse head-and-shoulders (H&S) structure; if the price then holds above 83,000, the pattern would activate, and a continued rise toward upper resistance levels would be expected.
If a daily or weekly close occurs above 82,885, it would mark the first higher peak relative to the most recent downward wave. This serves as a positive signal indicating that the upward trend is likely to continue.
The stop level for the pattern is a 4-hour candle close above 83,769; in that event, the pattern would be invalidated.
On the downside, the 75,545 level is the initial target. If the price drops below this, the decline could extend further. This drop would likely form the final shoulder of an inverse head-and-shoulders (H&S) structure; if the price then holds above 83,000, the pattern would activate, and a continued rise toward upper resistance levels would be expected.
If a daily or weekly close occurs above 82,885, it would mark the first higher peak relative to the most recent downward wave. This serves as a positive signal indicating that the upward trend is likely to continue.
76
عرض الترجمة
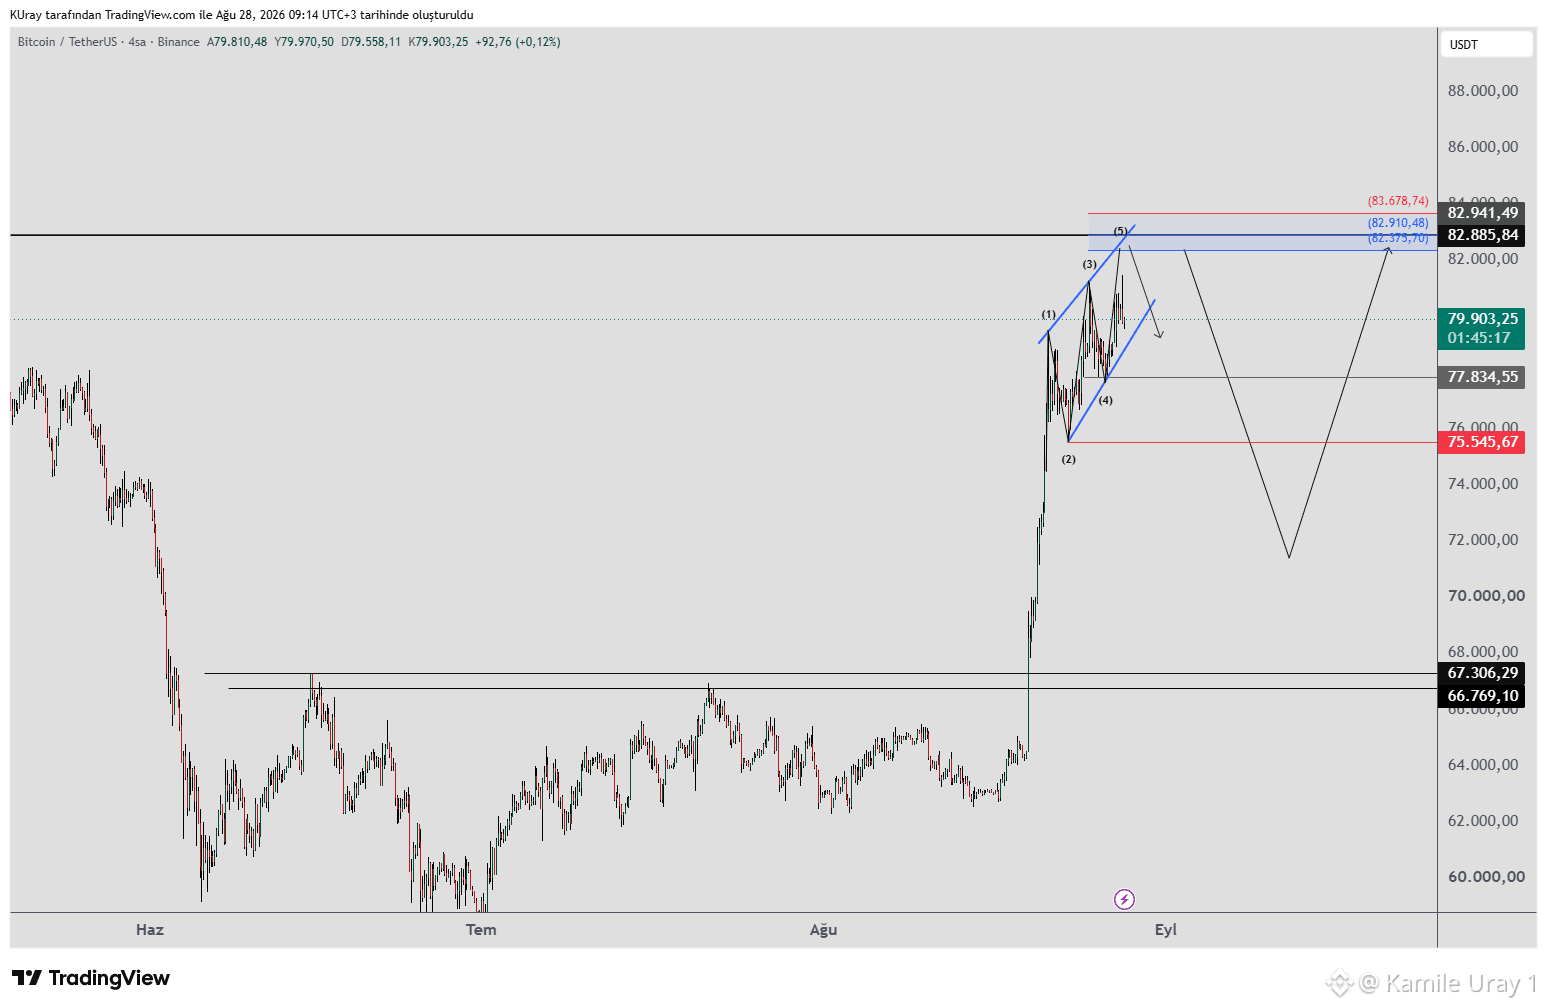
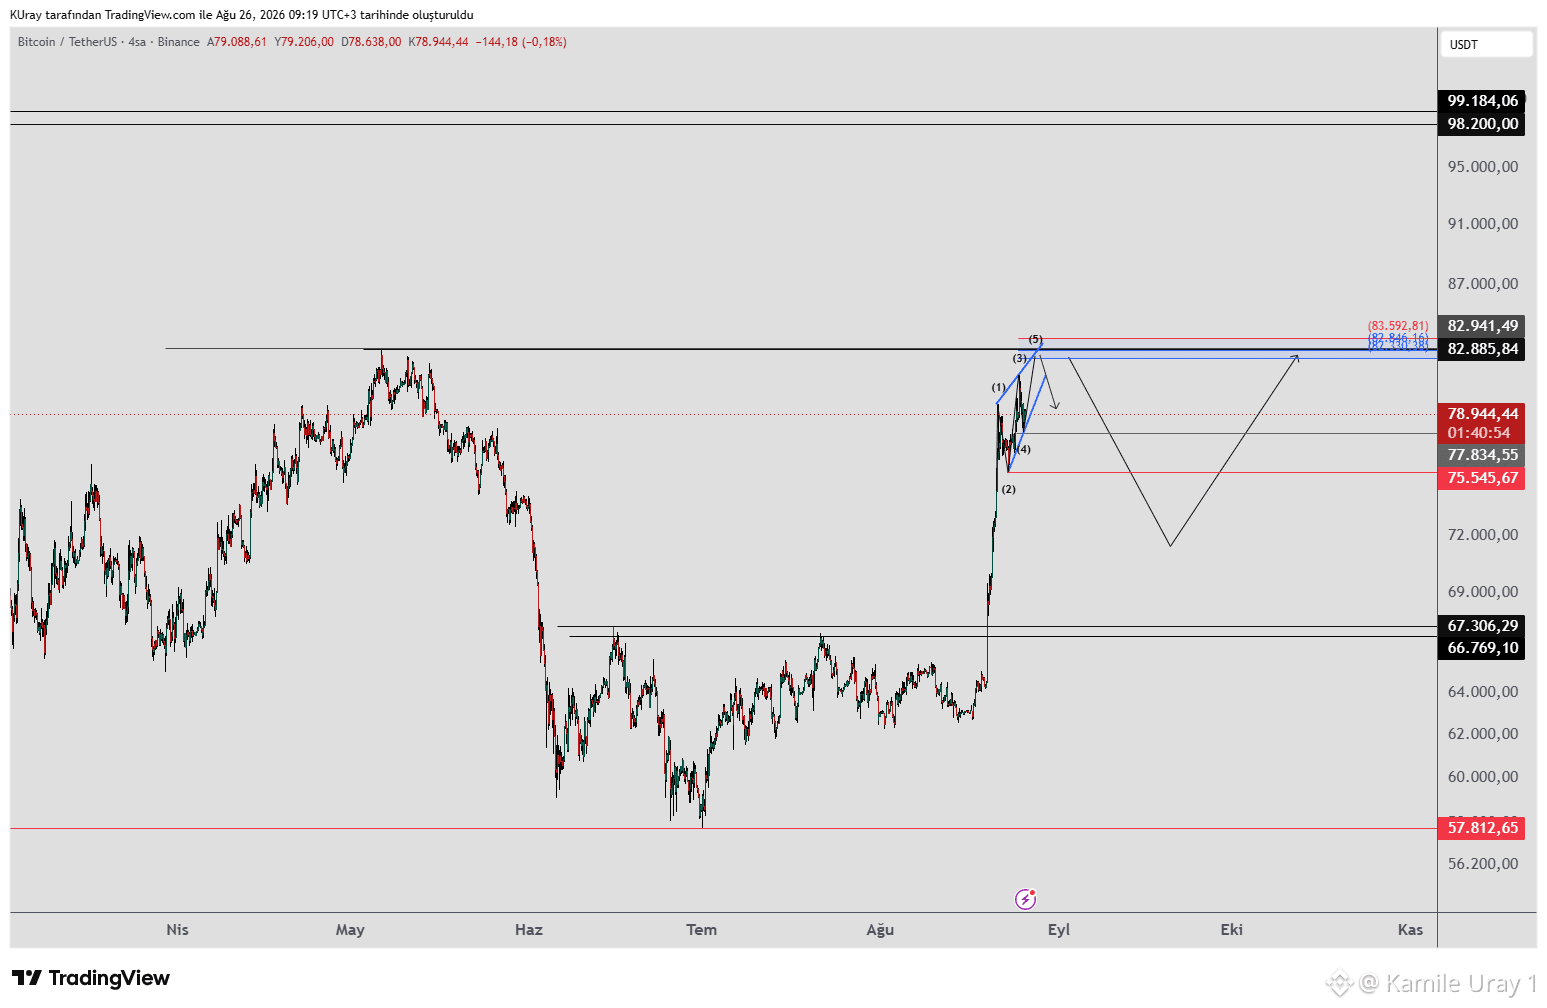
BTC continues to hold the 75,545 level on the 4-hour timeframe. However, the wave amplitudes have begun to shrink during the ascent, and a divergence has formed on the RSI. The upward movement has started to resemble a Wolfe Wave pattern. This pattern is structured as follows: If the price remains above the 77,834 low, there could be one more upward wave. The 82,330–82,846 zone acts as resistance during the rise; a downward movement could originate from here. The stop level for the pattern is a 4-hour candle close above 83,592. On the downside, the 75,545 level is the initial target; if the price drops below this, the decline could extend further. This decline would likely form the final shoulder of an Inverse Head and Shoulders (H&S) structure; if the price holds above 83,000, the pattern would activate, and a continued rise toward upper resistance levels would be expected. If a close above 82,885 occurs on the daily and weekly charts, it would mark the first higher high relative to the most recent downward wave. This serves as a positive signal that the upward trend is likely to continue.
BTC continues to hold the 75,545 level on the 4-hour timeframe. However, the wave amplitudes have begun to shrink during the ascent, and a divergence has formed on the RSI. The upward movement has started to resemble a Wolfe Wave pattern. This pattern is structured as follows: If the price remains above the 77,834 low, there could be one more upward wave. The 82,330–82,846 zone acts as resistance during the rise; a downward movement could originate from here. The stop level for the pattern is a 4-hour candle close above 83,592. On the downside, the 75,545 level is the initial target; if the price drops below this, the decline could extend further. This decline would likely form the final shoulder of an Inverse Head and Shoulders (H&S) structure; if the price holds above 83,000, the pattern would activate, and a continued rise toward upper resistance levels would be expected. If a close above 82,885 occurs on the daily and weekly charts, it would mark the first higher high relative to the most recent downward wave. This serves as a positive signal that the upward trend is likely to continue.
77
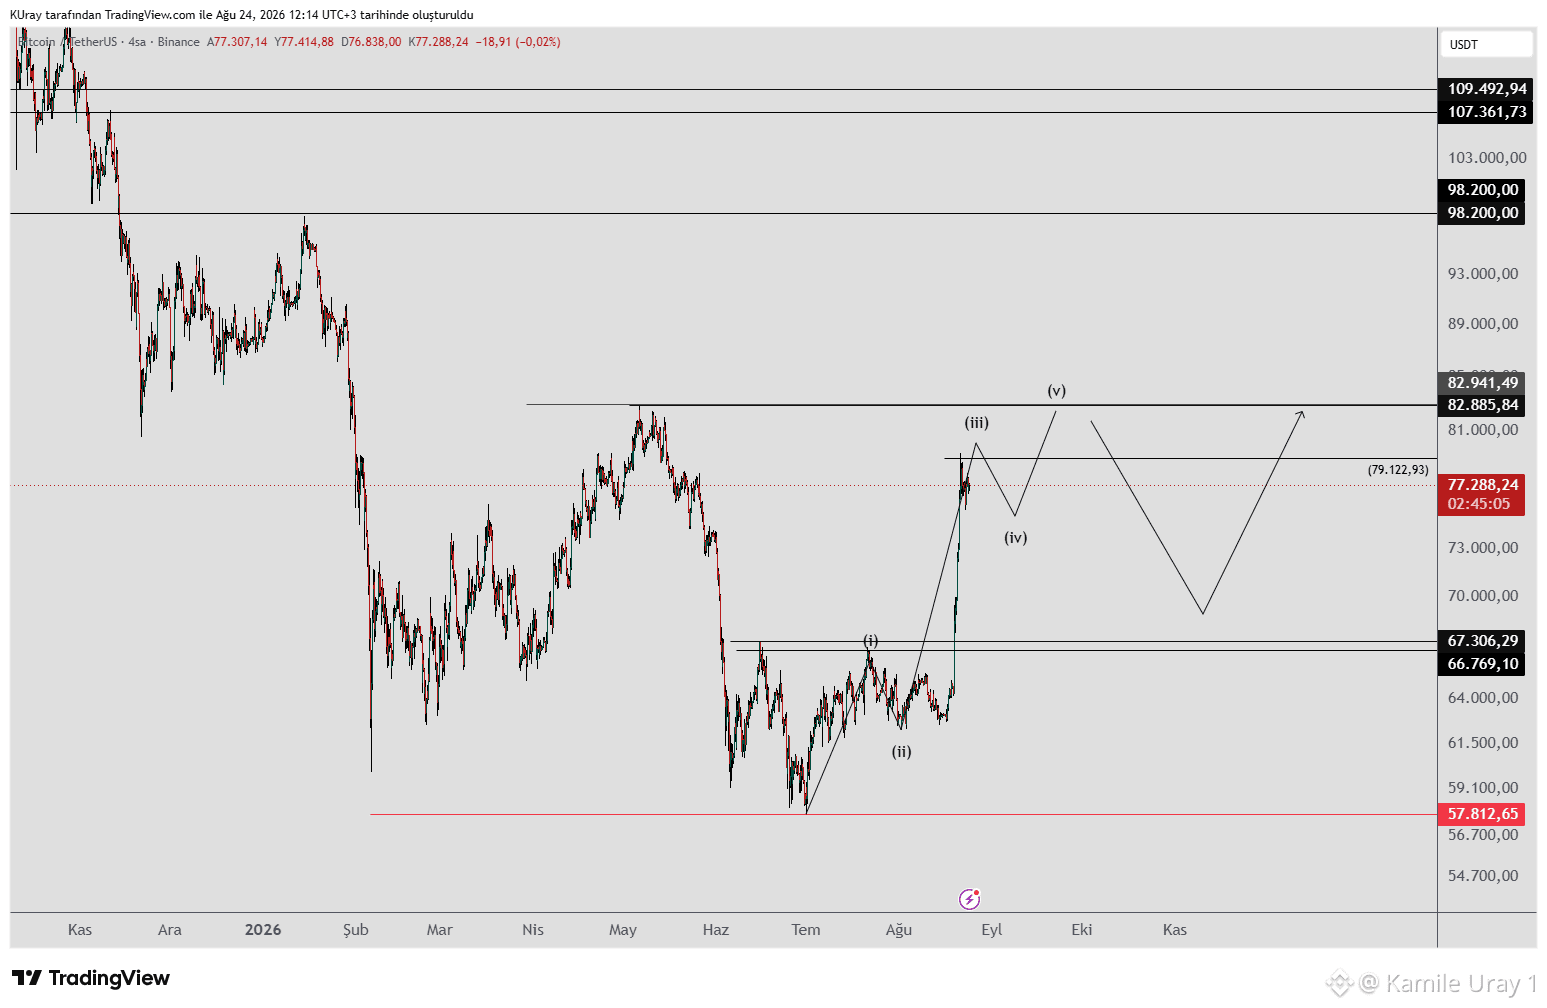
لقد حافظنا على نظرة صعودية طالما بقيت #BTC فوق مستوى 62,275؛ كنت قد توقعت نمط رأس وكتفين عكسيًا (H&S) عند 67,000. وقد تحقق وتوصل إلى هدفه. على الرغم من أنني لم أشارك مخططًا جديدًا، فقد كنت قد حددت المستويات الرئيسية، وأعتقد أن الحركة يمكن تتبعها عبر المخطط.
تم أيضًا تجاوز مستويات المقاومة عند 71,000–75,000. وعند النظر إلى بنية إطار الأربع ساعات، توجد إمكانية لحركة موجية من خمس موجات. يبدو أن الموجة 3 قد اكتملت، ونحن حاليًا في الموجة 4؛ وبعد تماسك قصير هنا، قد يحدث اندفاع آخر صعودًا.
وهذا يرفع احتمال اختبار مستوى مقاومة 82,885 أثناء الاندفاع. إذا أغلق السعر فوق 82,885 على كل من الأطر الزمنية اليومية والأسبوعية، فسيُعد ذلك القمة الأعلى الأولى مقارنةً بموجة هبوطية سابقة—وإشارة إيجابية تدل على أن الاتجاه الصعودي يُرجح أن يستمر.
إذا اتبع السعر نمط الموجات الذي حددته، فقد يتشكل هيكل مناسب لتحقيق مكاسب إضافية—مثل رأس وكتفين عكسي أو نموذج كوب ومقبض—مما قد يدفع السعر للأعلى بمجرد كسر مستوى 82,885.
سنواصل مراقبة بنية الموجات.
لقد حافظنا على نظرة صعودية طالما بقيت #BTC فوق مستوى 62,275؛ كنت قد توقعت نمط رأس وكتفين عكسيًا (H&S) عند 67,000. وقد تحقق وتوصل إلى هدفه. على الرغم من أنني لم أشارك مخططًا جديدًا، فقد كنت قد حددت المستويات الرئيسية، وأعتقد أن الحركة يمكن تتبعها عبر المخطط.
تم أيضًا تجاوز مستويات المقاومة عند 71,000–75,000. وعند النظر إلى بنية إطار الأربع ساعات، توجد إمكانية لحركة موجية من خمس موجات. يبدو أن الموجة 3 قد اكتملت، ونحن حاليًا في الموجة 4؛ وبعد تماسك قصير هنا، قد يحدث اندفاع آخر صعودًا.
وهذا يرفع احتمال اختبار مستوى مقاومة 82,885 أثناء الاندفاع. إذا أغلق السعر فوق 82,885 على كل من الأطر الزمنية اليومية والأسبوعية، فسيُعد ذلك القمة الأعلى الأولى مقارنةً بموجة هبوطية سابقة—وإشارة إيجابية تدل على أن الاتجاه الصعودي يُرجح أن يستمر.
إذا اتبع السعر نمط الموجات الذي حددته، فقد يتشكل هيكل مناسب لتحقيق مكاسب إضافية—مثل رأس وكتفين عكسي أو نموذج كوب ومقبض—مما قد يدفع السعر للأعلى بمجرد كسر مستوى 82,885.
سنواصل مراقبة بنية الموجات.
تم أيضًا تجاوز مستويات المقاومة عند 71,000–75,000. وعند النظر إلى بنية إطار الأربع ساعات، توجد إمكانية لحركة موجية من خمس موجات. يبدو أن الموجة 3 قد اكتملت، ونحن حاليًا في الموجة 4؛ وبعد تماسك قصير هنا، قد يحدث اندفاع آخر صعودًا.
وهذا يرفع احتمال اختبار مستوى مقاومة 82,885 أثناء الاندفاع. إذا أغلق السعر فوق 82,885 على كل من الأطر الزمنية اليومية والأسبوعية، فسيُعد ذلك القمة الأعلى الأولى مقارنةً بموجة هبوطية سابقة—وإشارة إيجابية تدل على أن الاتجاه الصعودي يُرجح أن يستمر.
إذا اتبع السعر نمط الموجات الذي حددته، فقد يتشكل هيكل مناسب لتحقيق مكاسب إضافية—مثل رأس وكتفين عكسي أو نموذج كوب ومقبض—مما قد يدفع السعر للأعلى بمجرد كسر مستوى 82,885.
سنواصل مراقبة بنية الموجات.
72
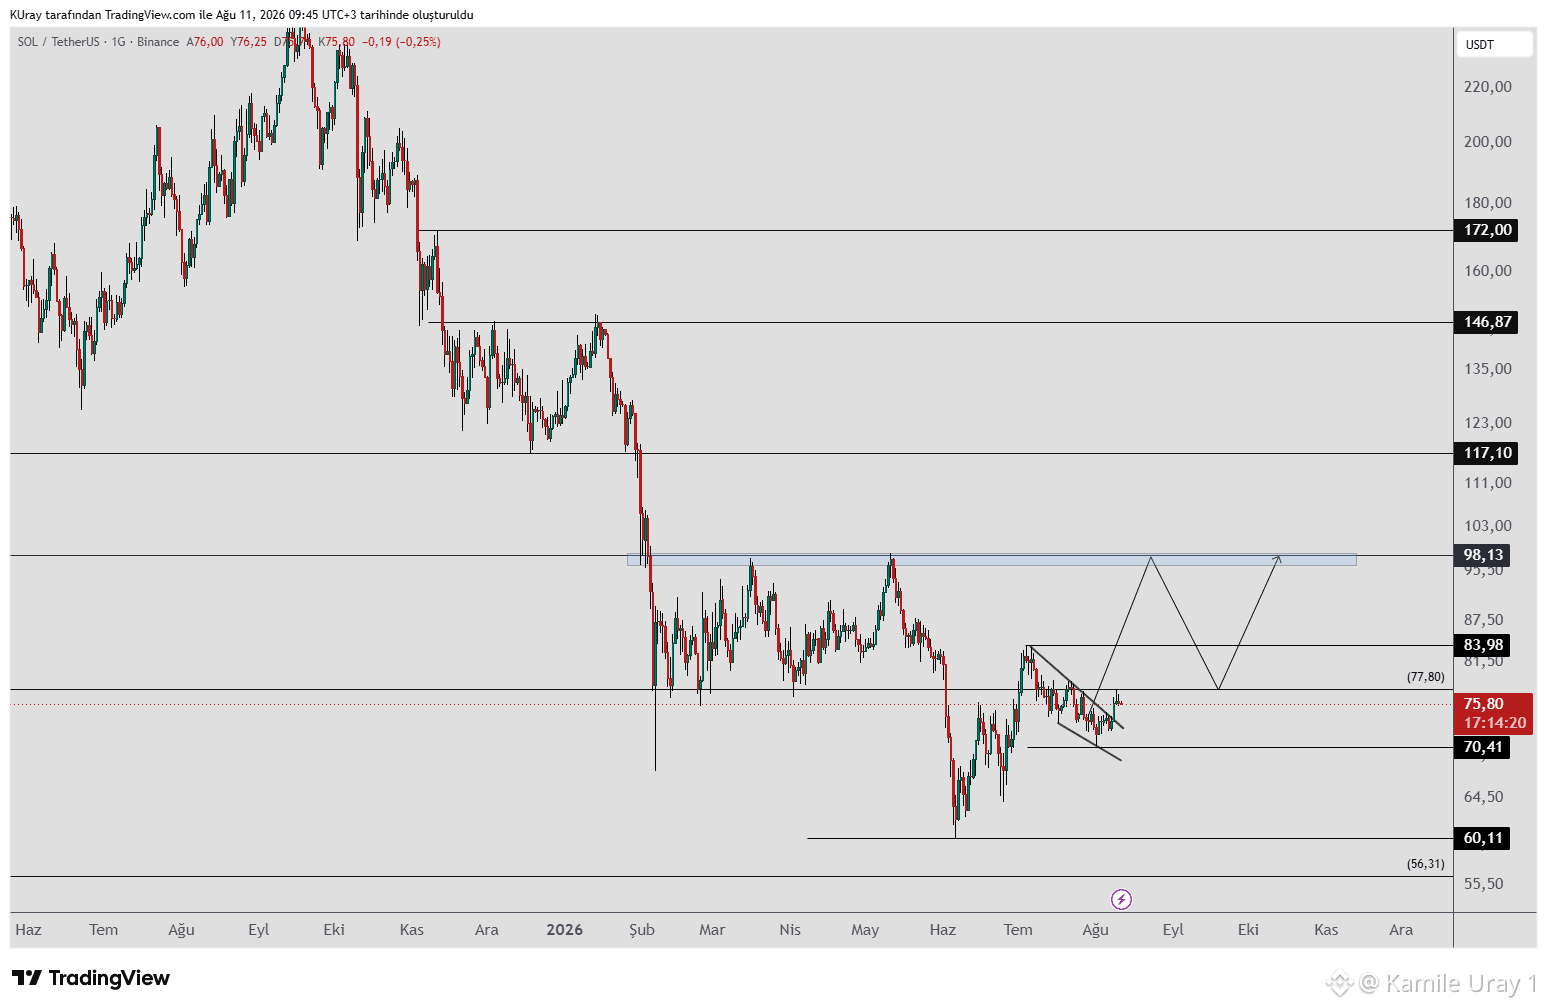
لقد كسر هيكل الوتد الموجود على الجانب الأيسر. طالما أنه يحافظ على مستوى 70 (القاع)، فهناك احتمال لحركة صعودية؛ يمكن متابعة مستويات المقاومة 83 و93. إذا اتبع التحركات التي أشرت إليها بالأسهم، فسيتم تكوين نموذج رأس وكتفين عكسي (H&S)؛ وبعد كسر المربع الأزرق وثبات السعر فوقه، قد يختبر مستويات المقاومة 117–146.
لقد كسر هيكل الوتد الموجود على الجانب الأيسر. طالما أنه يحافظ على مستوى 70 (القاع)، فهناك احتمال لحركة صعودية؛ يمكن متابعة مستويات المقاومة 83 و93. إذا اتبع التحركات التي أشرت إليها بالأسهم، فسيتم تكوين نموذج رأس وكتفين عكسي (H&S)؛ وبعد كسر المربع الأزرق وثبات السعر فوقه، قد يختبر مستويات المقاومة 117–146.
58
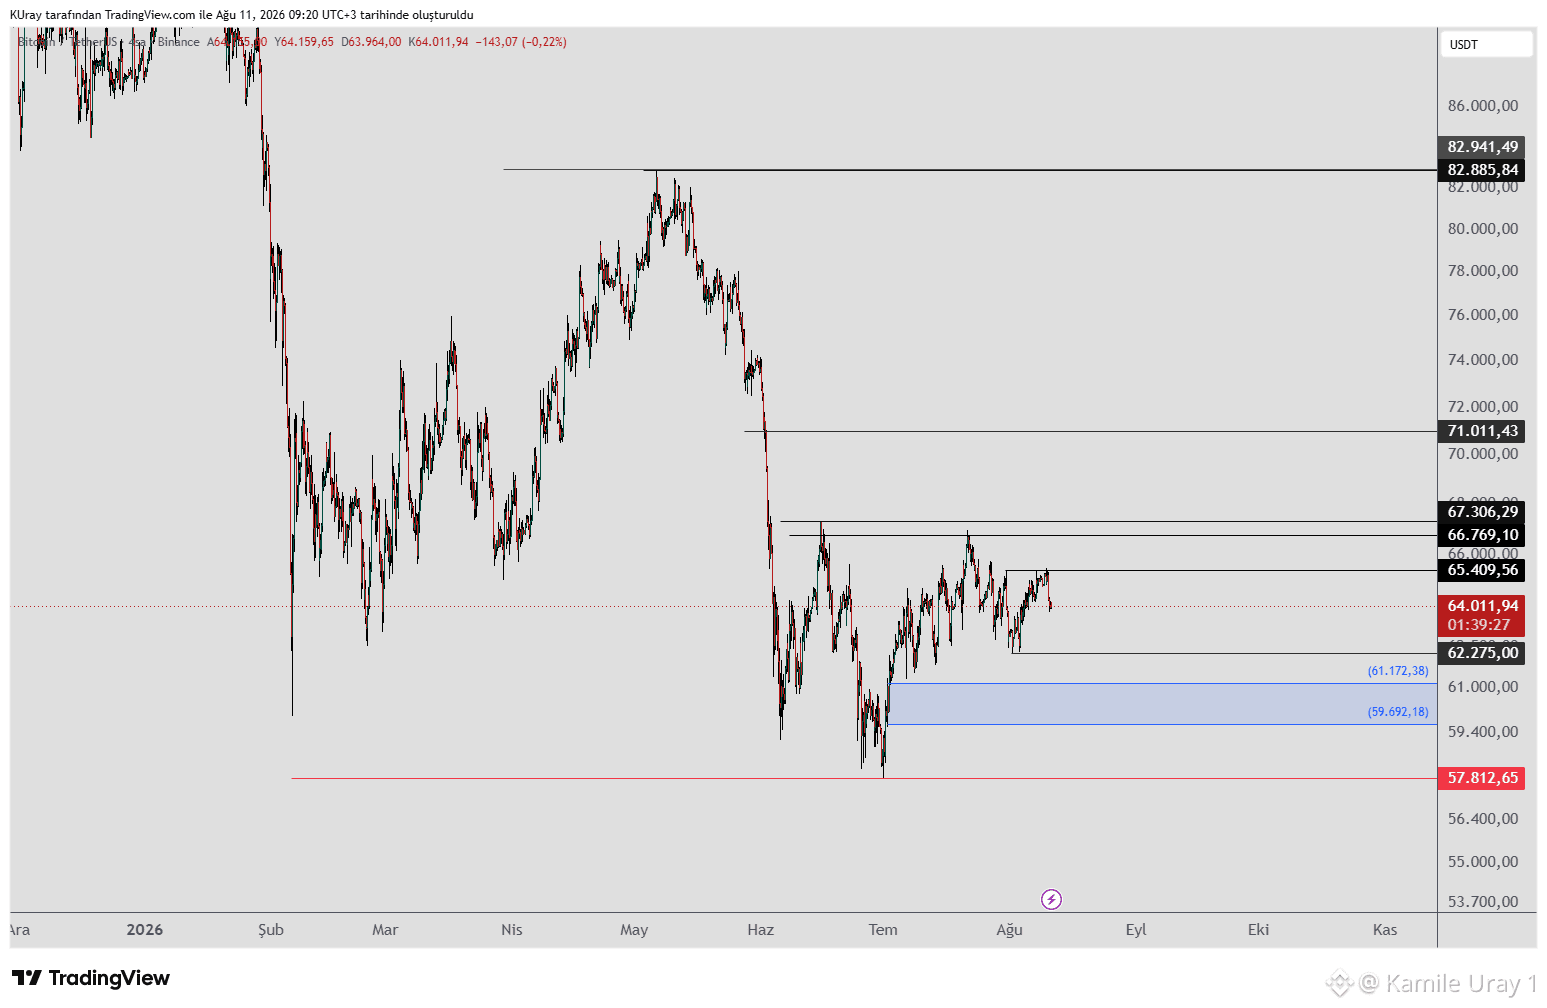
#BTC البقاء فوق مستوى 62,275 يُبقي السيناريو الصعودي حيًا. إذا حدث إغلاق فوق 65,409، فقد يتم استكمال "الكتف" لنمط عكس الرأس والكتفين (H&S)؛ وسيُفعّل الإغلاق فوق 67,000 النمط، ومن المتوقع استمرار الاتجاه الصعودي.
الاستمرار فوق 67,000 يخلق احتمال اختبار مستويات المقاومة عند 71,000 و75,000 و82,885.
إذا وقع إغلاق فوق 82,885 على كلٍّ من الإطارين اليومي والأسبوعي، فسيُعتبر ذلك القمة الأعلى الأولى مقارنة بالموجة الهابطة الأخيرة. وهذا يُعد إشارة إيجابية بأن الاتجاه الصعودي من المرجح أن يستمر.
قد يؤدي الفشل في الإغلاق فوق 65,409 على مخطط الأربع ساعات إلى حدوث تراجع؛ إذ إن الإغلاق تحت 62,275 سيُعيد تصنيف الارتفاع الأخير على أنه مجرد ارتداد تصحيحي ضمن اتجاه هابط، ومن المتوقع استمرار الانخفاض.
أثناء فترة التراجع، يعمل نطاق 59,000–61,000 كمنطقة دعم (متوافقًا مع مستويات فيبوناتشي 0.618–0.786). وهذه منطقة قد يتدخل فيها المشترون؛ فإذا حافظ السعر على هذا المستوى، فقد تتبع ذلك محاولة أخرى للارتفاع.
إذا تعمق التراجع وهبط الإغلاق الأسبوعي تحت 57,000، فقد يختبر السعر مستويات الدعم في نطاق 49,000–50,000.
#BTC البقاء فوق مستوى 62,275 يُبقي السيناريو الصعودي حيًا. إذا حدث إغلاق فوق 65,409، فقد يتم استكمال "الكتف" لنمط عكس الرأس والكتفين (H&S)؛ وسيُفعّل الإغلاق فوق 67,000 النمط، ومن المتوقع استمرار الاتجاه الصعودي.
الاستمرار فوق 67,000 يخلق احتمال اختبار مستويات المقاومة عند 71,000 و75,000 و82,885.
إذا وقع إغلاق فوق 82,885 على كلٍّ من الإطارين اليومي والأسبوعي، فسيُعتبر ذلك القمة الأعلى الأولى مقارنة بالموجة الهابطة الأخيرة. وهذا يُعد إشارة إيجابية بأن الاتجاه الصعودي من المرجح أن يستمر.
قد يؤدي الفشل في الإغلاق فوق 65,409 على مخطط الأربع ساعات إلى حدوث تراجع؛ إذ إن الإغلاق تحت 62,275 سيُعيد تصنيف الارتفاع الأخير على أنه مجرد ارتداد تصحيحي ضمن اتجاه هابط، ومن المتوقع استمرار الانخفاض.
أثناء فترة التراجع، يعمل نطاق 59,000–61,000 كمنطقة دعم (متوافقًا مع مستويات فيبوناتشي 0.618–0.786). وهذه منطقة قد يتدخل فيها المشترون؛ فإذا حافظ السعر على هذا المستوى، فقد تتبع ذلك محاولة أخرى للارتفاع.
إذا تعمق التراجع وهبط الإغلاق الأسبوعي تحت 57,000، فقد يختبر السعر مستويات الدعم في نطاق 49,000–50,000.
الاستمرار فوق 67,000 يخلق احتمال اختبار مستويات المقاومة عند 71,000 و75,000 و82,885.
إذا وقع إغلاق فوق 82,885 على كلٍّ من الإطارين اليومي والأسبوعي، فسيُعتبر ذلك القمة الأعلى الأولى مقارنة بالموجة الهابطة الأخيرة. وهذا يُعد إشارة إيجابية بأن الاتجاه الصعودي من المرجح أن يستمر.
قد يؤدي الفشل في الإغلاق فوق 65,409 على مخطط الأربع ساعات إلى حدوث تراجع؛ إذ إن الإغلاق تحت 62,275 سيُعيد تصنيف الارتفاع الأخير على أنه مجرد ارتداد تصحيحي ضمن اتجاه هابط، ومن المتوقع استمرار الانخفاض.
أثناء فترة التراجع، يعمل نطاق 59,000–61,000 كمنطقة دعم (متوافقًا مع مستويات فيبوناتشي 0.618–0.786). وهذه منطقة قد يتدخل فيها المشترون؛ فإذا حافظ السعر على هذا المستوى، فقد تتبع ذلك محاولة أخرى للارتفاع.
إذا تعمق التراجع وهبط الإغلاق الأسبوعي تحت 57,000، فقد يختبر السعر مستويات الدعم في نطاق 49,000–50,000.
76
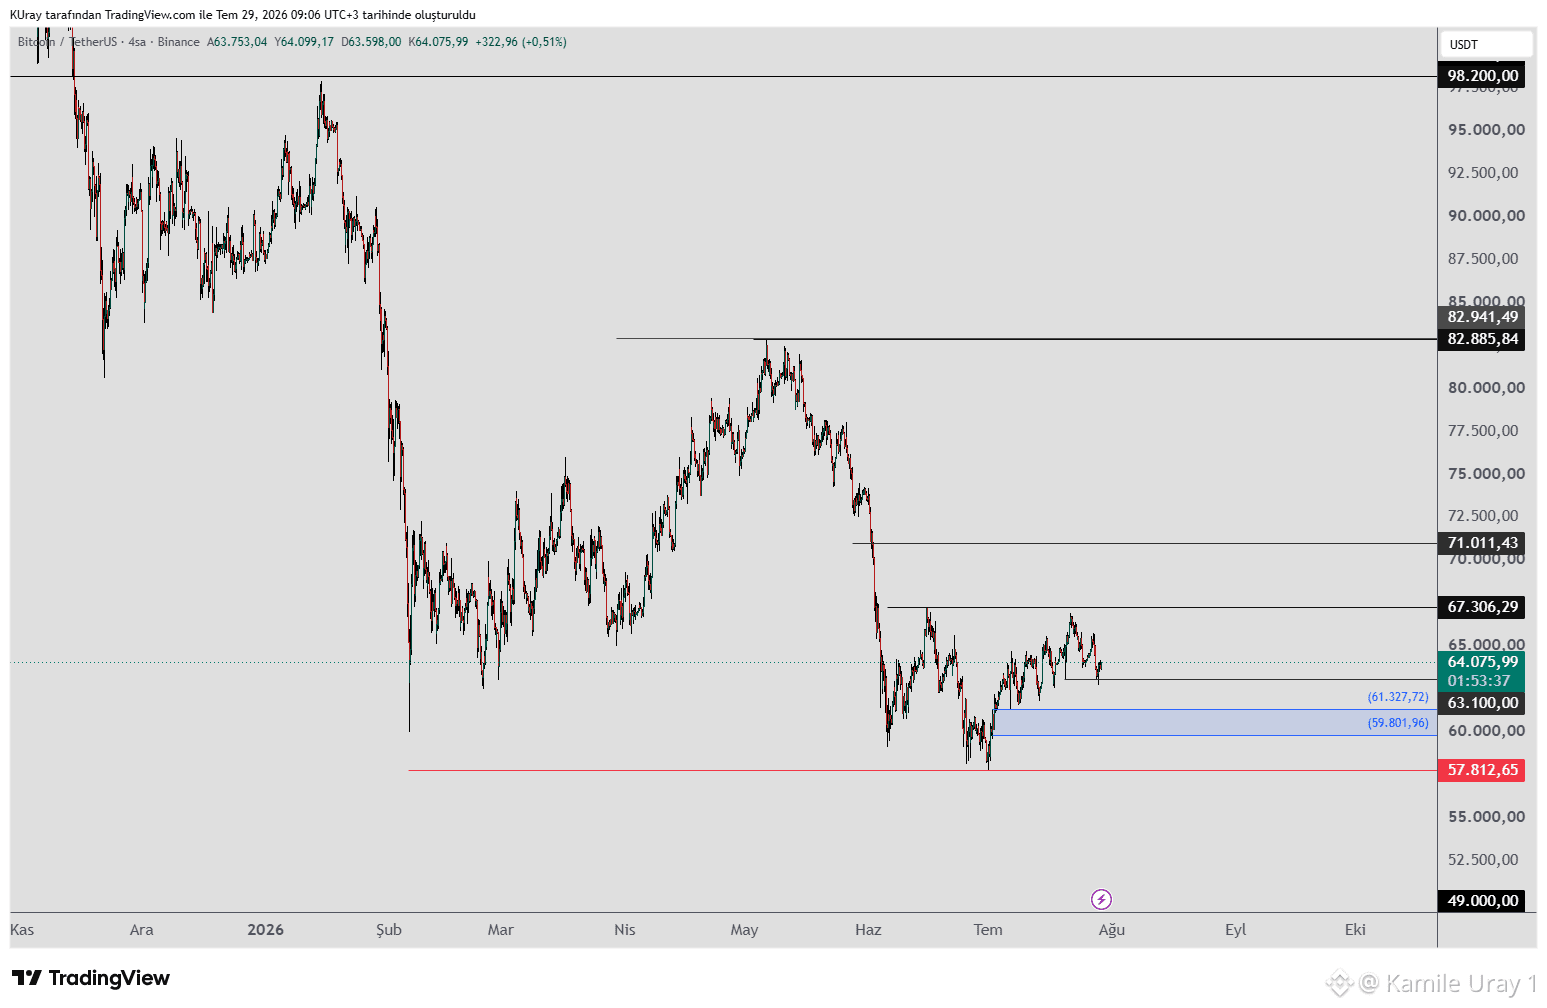
#BTC يواصل التمسك بمستوى 63,100؛ وقد تستمر الحركة الصعودية باتجاه مقاومة 67,500. إذا حافظ على موقعه فوق هذه المقاومة، فهناك احتمال لاختبار مستويات المقاومة 71,000 و75,000 و82,885.
إذا حدث إغلاق يومي أو أسبوعي فوق 82,885، فسيُعد ذلك القمة الأعلى الأولى مقارنة بالموجة الهابطة الأخيرة. وهذا بمثابة إشارة إيجابية لاحتمال استمرار الاتجاه الصعودي.
إذا تراجع تحت 63,100، فإن نطاق 59,000–61,000 يعمل كمنطقة دعم فيبوناتشي. إذا ثبت هذا المستوى، فقد يتبع ذلك محاولة أخرى للحركة صعودًا.
إذا استمرت حالة التراجع وحدث إغلاق أسبوعي تحت 57,000، فإن احتمال استمرار الاتجاه الهابط يزداد، مما قد يؤدي إلى انخفاض باتجاه مستويات الدعم 49,000–50,000.
#BTC يواصل التمسك بمستوى 63,100؛ وقد تستمر الحركة الصعودية باتجاه مقاومة 67,500. إذا حافظ على موقعه فوق هذه المقاومة، فهناك احتمال لاختبار مستويات المقاومة 71,000 و75,000 و82,885.
إذا حدث إغلاق يومي أو أسبوعي فوق 82,885، فسيُعد ذلك القمة الأعلى الأولى مقارنة بالموجة الهابطة الأخيرة. وهذا بمثابة إشارة إيجابية لاحتمال استمرار الاتجاه الصعودي.
إذا تراجع تحت 63,100، فإن نطاق 59,000–61,000 يعمل كمنطقة دعم فيبوناتشي. إذا ثبت هذا المستوى، فقد يتبع ذلك محاولة أخرى للحركة صعودًا.
إذا استمرت حالة التراجع وحدث إغلاق أسبوعي تحت 57,000، فإن احتمال استمرار الاتجاه الهابط يزداد، مما قد يؤدي إلى انخفاض باتجاه مستويات الدعم 49,000–50,000.
إذا حدث إغلاق يومي أو أسبوعي فوق 82,885، فسيُعد ذلك القمة الأعلى الأولى مقارنة بالموجة الهابطة الأخيرة. وهذا بمثابة إشارة إيجابية لاحتمال استمرار الاتجاه الصعودي.
إذا تراجع تحت 63,100، فإن نطاق 59,000–61,000 يعمل كمنطقة دعم فيبوناتشي. إذا ثبت هذا المستوى، فقد يتبع ذلك محاولة أخرى للحركة صعودًا.
إذا استمرت حالة التراجع وحدث إغلاق أسبوعي تحت 57,000، فإن احتمال استمرار الاتجاه الهابط يزداد، مما قد يؤدي إلى انخفاض باتجاه مستويات الدعم 49,000–50,000.
68
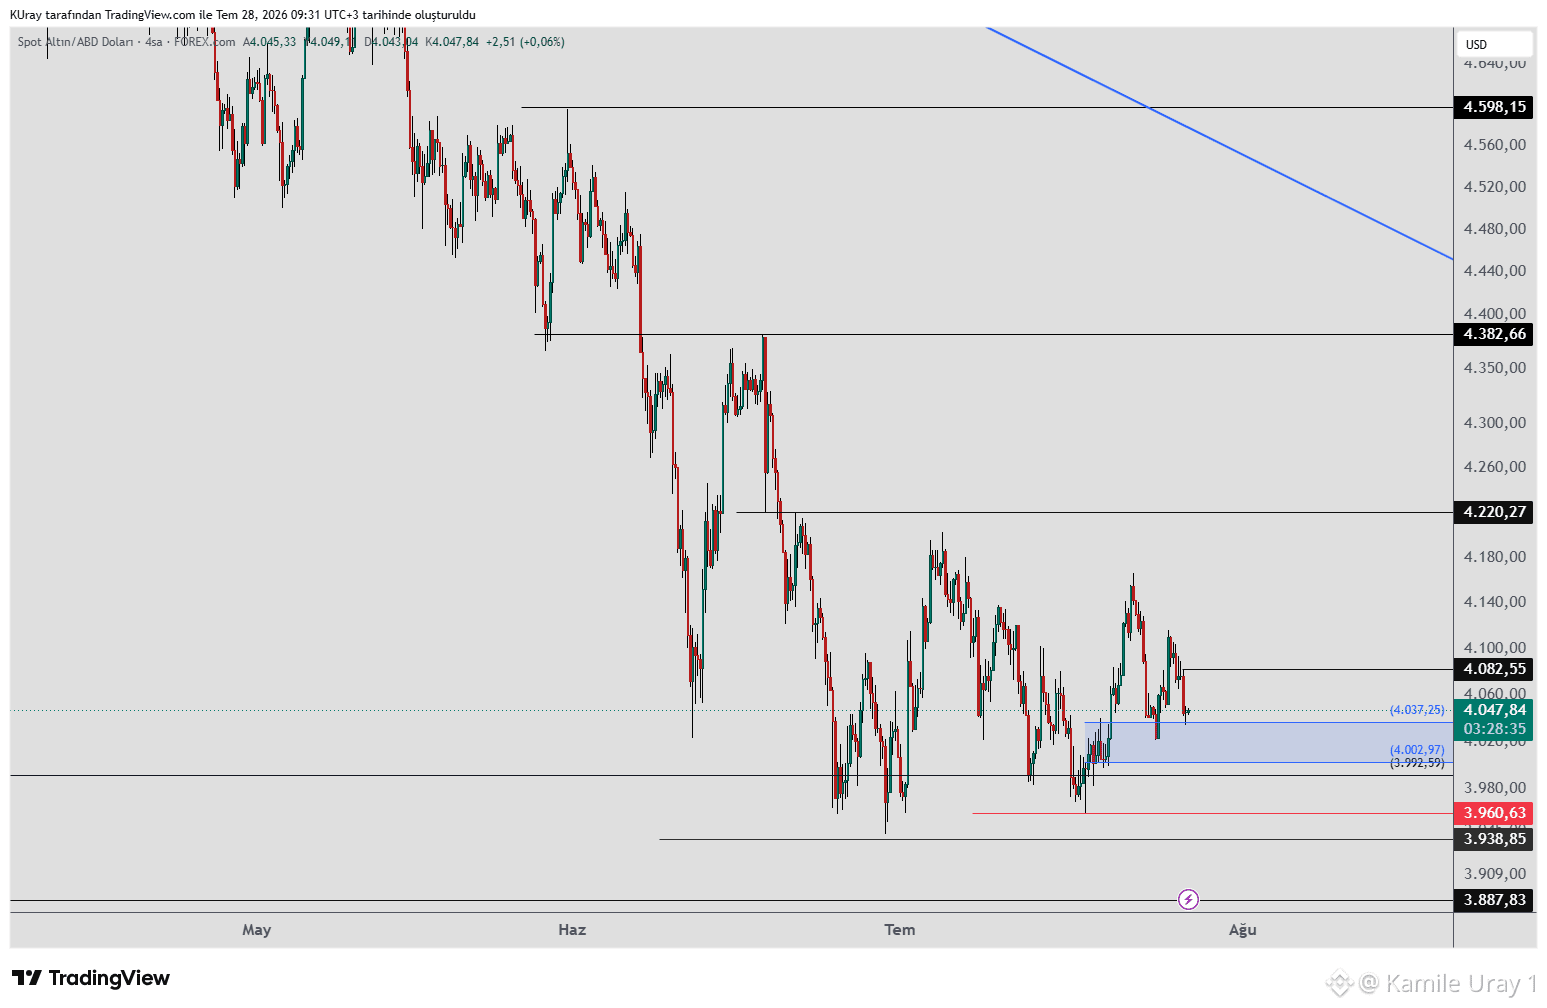
#xauusd #الذهب اختبر منطقة الدعم 4038–4003 (مستويات فيبوناتشي 0.618–0.786)، وتكوّن شمعة صعودية. يمكننا أن نقيّم أن الحركة الصعودية ستستأنف إذا ظل السعر أعلى من 4082 على مخطط الأربع ساعات.
من جهة الصعود، بمجرد كسر مستوى المقاومة 4220، تقع المقاومة التالية عند 4382.
إذا أغلق السعر فوق 4382، فسيُعد ذلك القمة الأعلى الأولى مقارنةً بموجة الهبوط الأخيرة. سيكون ذلك بمثابة إشارة على أن اتجاه الصعود مرجّح أن يستمر. إذا استمر الارتفاع وبقي السعر فوق خط الاتجاه الأزرق الهابط، فإنه يكون قد كسر خط الاتجاه هذا؛ وفي هذا السيناريو، يمكن توقع مزيد من الحركة الصعودية، وربما يؤدي ذلك إلى إعادة اختبار القمة.
على الرسم البياني الأسبوعي، يبقى الاتجاه الصعودي قائمًا طالما ظل السعر أعلى من مستوى 3887.
#xauusd #الذهب اختبر منطقة الدعم 4038–4003 (مستويات فيبوناتشي 0.618–0.786)، وتكوّن شمعة صعودية. يمكننا أن نقيّم أن الحركة الصعودية ستستأنف إذا ظل السعر أعلى من 4082 على مخطط الأربع ساعات.
من جهة الصعود، بمجرد كسر مستوى المقاومة 4220، تقع المقاومة التالية عند 4382.
إذا أغلق السعر فوق 4382، فسيُعد ذلك القمة الأعلى الأولى مقارنةً بموجة الهبوط الأخيرة. سيكون ذلك بمثابة إشارة على أن اتجاه الصعود مرجّح أن يستمر. إذا استمر الارتفاع وبقي السعر فوق خط الاتجاه الأزرق الهابط، فإنه يكون قد كسر خط الاتجاه هذا؛ وفي هذا السيناريو، يمكن توقع مزيد من الحركة الصعودية، وربما يؤدي ذلك إلى إعادة اختبار القمة.
على الرسم البياني الأسبوعي، يبقى الاتجاه الصعودي قائمًا طالما ظل السعر أعلى من مستوى 3887.
من جهة الصعود، بمجرد كسر مستوى المقاومة 4220، تقع المقاومة التالية عند 4382.
إذا أغلق السعر فوق 4382، فسيُعد ذلك القمة الأعلى الأولى مقارنةً بموجة الهبوط الأخيرة. سيكون ذلك بمثابة إشارة على أن اتجاه الصعود مرجّح أن يستمر. إذا استمر الارتفاع وبقي السعر فوق خط الاتجاه الأزرق الهابط، فإنه يكون قد كسر خط الاتجاه هذا؛ وفي هذا السيناريو، يمكن توقع مزيد من الحركة الصعودية، وربما يؤدي ذلك إلى إعادة اختبار القمة.
على الرسم البياني الأسبوعي، يبقى الاتجاه الصعودي قائمًا طالما ظل السعر أعلى من مستوى 3887.
40
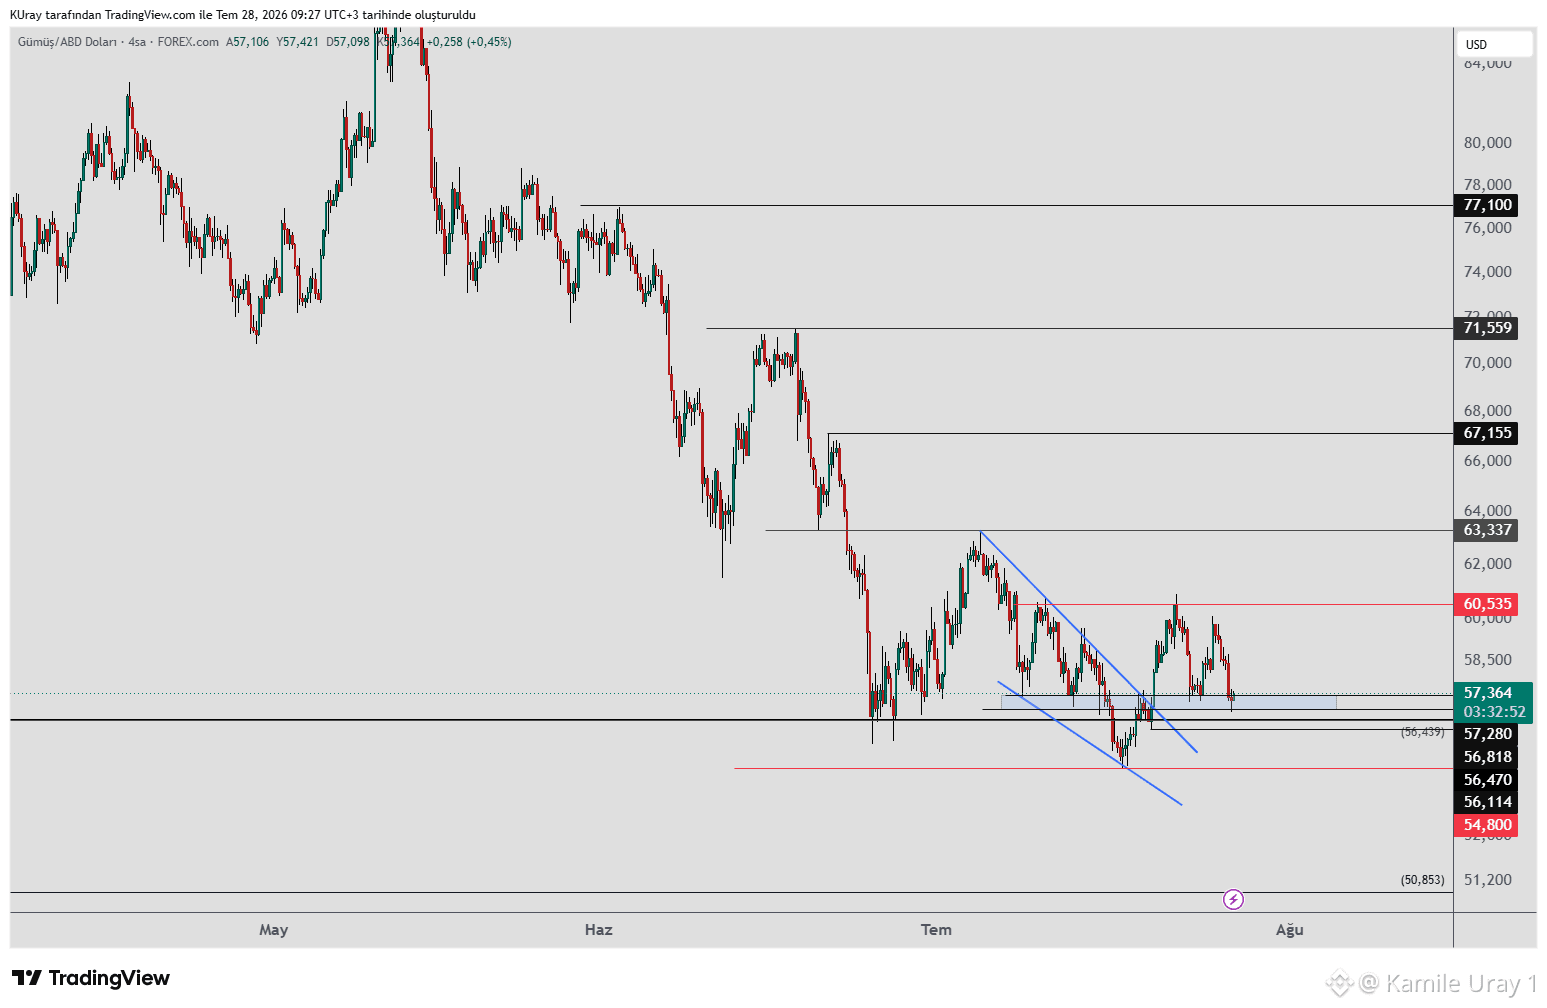
#XAG #الفضة عادت إلى منطقة الدعم عند 57–56؛ وهي منطقة قد يدخل منها المشترون. طالما أنها تبقى فوق هذا المستوى، فقد تعيد اختبار منطقة 60. إذا استمرت فوق الخط الأحمر عند 60، فقد تختبر مستوى مقاومة 63.
بخصوص الاتجاه الصعودي، إذا حدث إغلاق يومي فوق 63، فسيتم تكوين "قمّة أعلى" على مخطط اليومي مقارنةً بالموجة الهابطة الأخيرة؛ وهذا سيشير إلى انعكاس الاتجاه ويدل على أن الحركة الصعودية قد تستمر. بمجرد كسر مقاومة 63، يمكن مراقبة مستويات المقاومة 67 و71 و80.
في حال حدوث هبوط حاد، إذا انخفض السعر دون 54، فقد يمتد الهبوط باتجاه مستويات الدعم 50 و45. يبقى الاتجاه صاعدًا طالما أن مستوى الدعم 45 يحافظ عليه مخطط الأسبوعي.
#XAG #الفضة عادت إلى منطقة الدعم عند 57–56؛ وهي منطقة قد يدخل منها المشترون. طالما أنها تبقى فوق هذا المستوى، فقد تعيد اختبار منطقة 60. إذا استمرت فوق الخط الأحمر عند 60، فقد تختبر مستوى مقاومة 63.
بخصوص الاتجاه الصعودي، إذا حدث إغلاق يومي فوق 63، فسيتم تكوين "قمّة أعلى" على مخطط اليومي مقارنةً بالموجة الهابطة الأخيرة؛ وهذا سيشير إلى انعكاس الاتجاه ويدل على أن الحركة الصعودية قد تستمر. بمجرد كسر مقاومة 63، يمكن مراقبة مستويات المقاومة 67 و71 و80.
في حال حدوث هبوط حاد، إذا انخفض السعر دون 54، فقد يمتد الهبوط باتجاه مستويات الدعم 50 و45. يبقى الاتجاه صاعدًا طالما أن مستوى الدعم 45 يحافظ عليه مخطط الأسبوعي.
بخصوص الاتجاه الصعودي، إذا حدث إغلاق يومي فوق 63، فسيتم تكوين "قمّة أعلى" على مخطط اليومي مقارنةً بالموجة الهابطة الأخيرة؛ وهذا سيشير إلى انعكاس الاتجاه ويدل على أن الحركة الصعودية قد تستمر. بمجرد كسر مقاومة 63، يمكن مراقبة مستويات المقاومة 67 و71 و80.
في حال حدوث هبوط حاد، إذا انخفض السعر دون 54، فقد يمتد الهبوط باتجاه مستويات الدعم 50 و45. يبقى الاتجاه صاعدًا طالما أن مستوى الدعم 45 يحافظ عليه مخطط الأسبوعي.
55
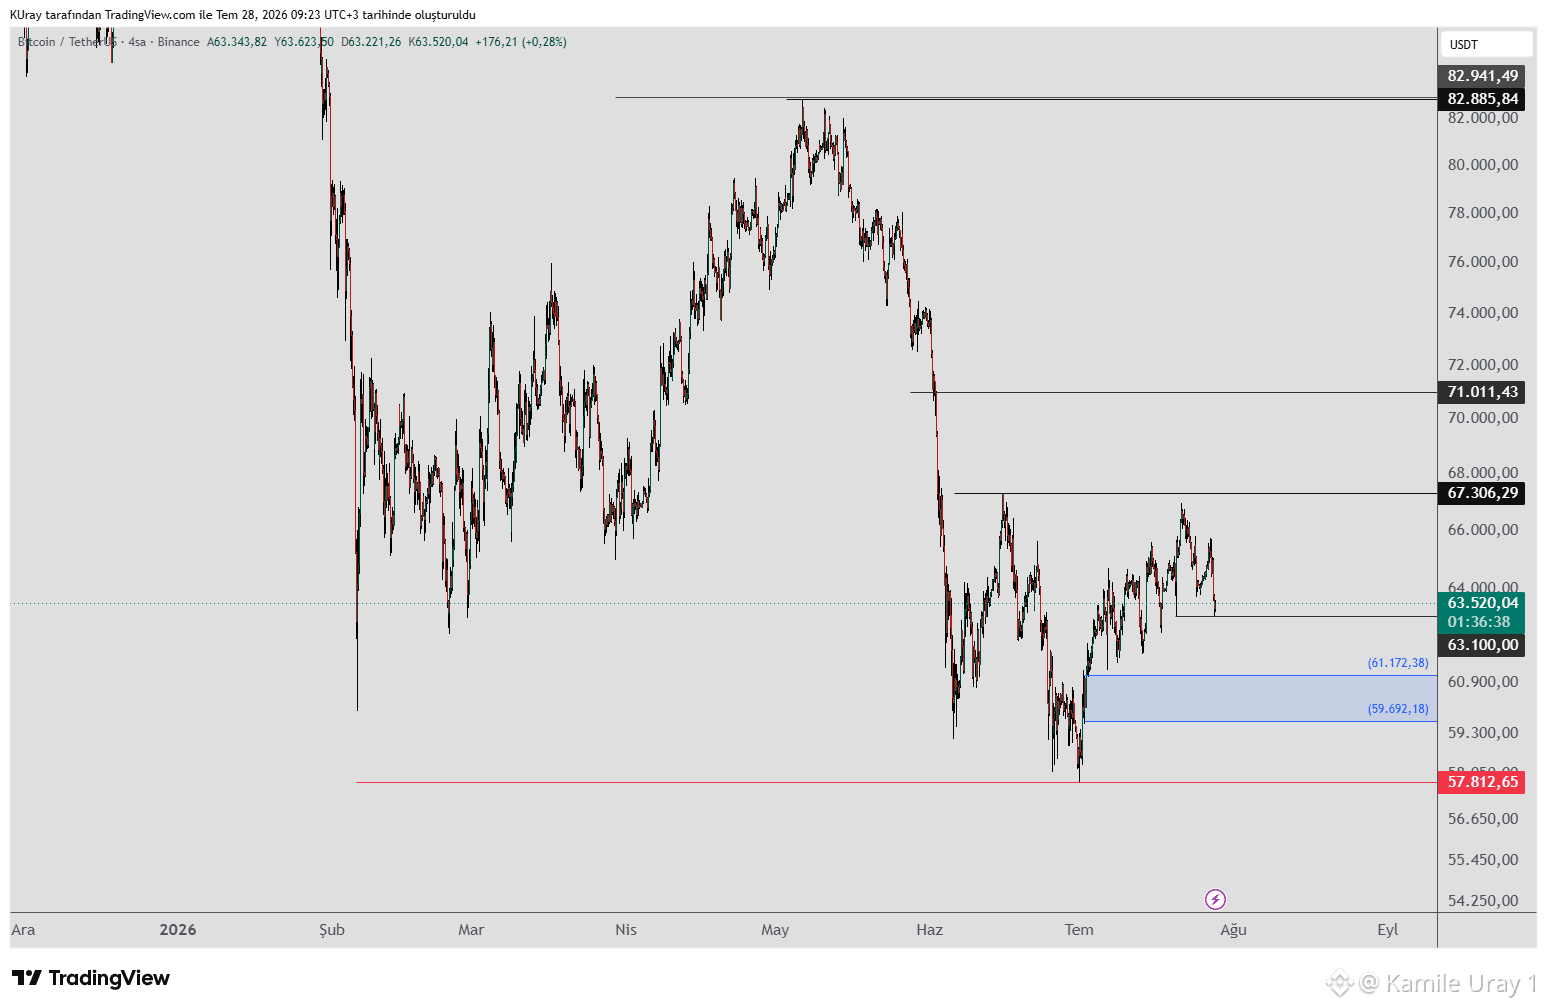
#BTC عادت إلى مستوى 63,100. إذا تمكنت من الثبات فوق هذا المستوى، فقد تستمر الحركة الصعودية باتجاه مقاومة 67,500. وإذا اخترقت هذه المقاومة بحجم تداول مرتفع وأغلقت فوقها، فهناك احتمال لاختبار مستويات المقاومة 71,000 و75,000 و82,885. سيؤدي الإغلاق اليومي والأسبوعي فوق 82,885 إلى تأكيد أول قمة أعلى مقارنة بموجة الانخفاض الأخيرة، بما يُعد إشارة إيجابية لاحتمال استمرار الاتجاه الصاعد.
إذا فشلت في الحفاظ على مستوى 63,100، فإن نطاق 59,000–61,000 يعمل كمنطقة دعم فيبوناتشي؛ وإذا وجدت دعماً هناك، فقد تتبع ذلك محاولة أخرى للارتفاع.
إذا استمر الهبوط وحدث إغلاق أسبوعي دون 57,000، فإن احتمالية المزيد من التراجع تزداد، مما قد يؤدي إلى الانخفاض نحو مستويات الدعم 49,000–50,000.
#BTC عادت إلى مستوى 63,100. إذا تمكنت من الثبات فوق هذا المستوى، فقد تستمر الحركة الصعودية باتجاه مقاومة 67,500. وإذا اخترقت هذه المقاومة بحجم تداول مرتفع وأغلقت فوقها، فهناك احتمال لاختبار مستويات المقاومة 71,000 و75,000 و82,885. سيؤدي الإغلاق اليومي والأسبوعي فوق 82,885 إلى تأكيد أول قمة أعلى مقارنة بموجة الانخفاض الأخيرة، بما يُعد إشارة إيجابية لاحتمال استمرار الاتجاه الصاعد.
إذا فشلت في الحفاظ على مستوى 63,100، فإن نطاق 59,000–61,000 يعمل كمنطقة دعم فيبوناتشي؛ وإذا وجدت دعماً هناك، فقد تتبع ذلك محاولة أخرى للارتفاع.
إذا استمر الهبوط وحدث إغلاق أسبوعي دون 57,000، فإن احتمالية المزيد من التراجع تزداد، مما قد يؤدي إلى الانخفاض نحو مستويات الدعم 49,000–50,000.
إذا فشلت في الحفاظ على مستوى 63,100، فإن نطاق 59,000–61,000 يعمل كمنطقة دعم فيبوناتشي؛ وإذا وجدت دعماً هناك، فقد تتبع ذلك محاولة أخرى للارتفاع.
إذا استمر الهبوط وحدث إغلاق أسبوعي دون 57,000، فإن احتمالية المزيد من التراجع تزداد، مما قد يؤدي إلى الانخفاض نحو مستويات الدعم 49,000–50,000.
80
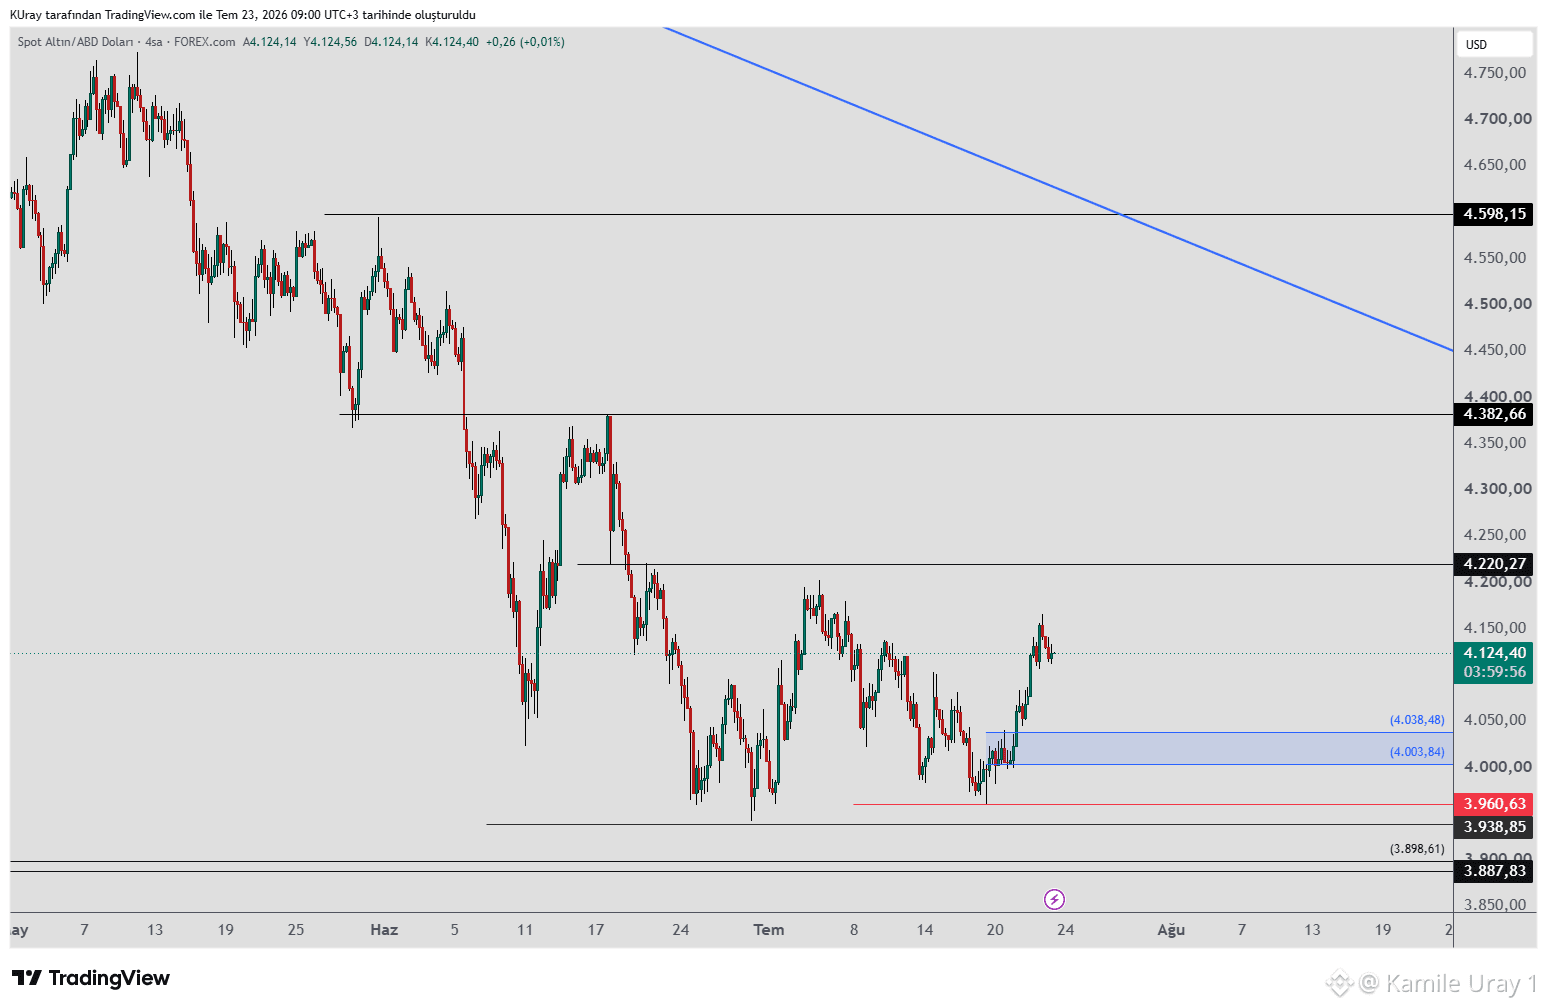
#xauusd #Gold : يظل احتمال حدوث حركة صعودية قائمًا طالما أن السعر يحافظ على مستوى 3938 في الرسم البياني اليومي.
إذا حدث تراجع من المستويات الحالية، فإن منطقة 4003–4038 تمثل منطقة دعم فيبوناتشي 0.618–0.786. وقد يجد المشترين هنا ويحاول اختراق مستوى المقاومة 4220.
في الرسم البياني لأربع ساعات، يقترب السعر من مقاومة 4220؛ وإذا حافظ على موقعه فوق هذا المستوى، سنراقب مقاومة 4382. وسيشير الإغلاق فوق 4382 إلى القمة الأعلى الأولى مقارنةً بموجة الهبوط الأخيرة، باعتباره إشارة إلى أن الاتجاه الصعودي من المرجح أن يستمر.
إذا استمر الارتفاع وبقي السعر فوق خط الاتجاه الأزرق الهابط، فسيكون قد اخترق خط الاتجاه الهابط هذا. وفي هذا السيناريو، يمكن توقع المزيد من الحركة الصعودية، وربما يؤدي ذلك إلى إعادة اختبار القمة.
في الرسم البياني الأسبوعي، يظل الاتجاه الصعودي قائمًا طالما أن السعر يحافظ على مستوى 3887.
#xauusd #Gold : يظل احتمال حدوث حركة صعودية قائمًا طالما أن السعر يحافظ على مستوى 3938 في الرسم البياني اليومي.
إذا حدث تراجع من المستويات الحالية، فإن منطقة 4003–4038 تمثل منطقة دعم فيبوناتشي 0.618–0.786. وقد يجد المشترين هنا ويحاول اختراق مستوى المقاومة 4220.
في الرسم البياني لأربع ساعات، يقترب السعر من مقاومة 4220؛ وإذا حافظ على موقعه فوق هذا المستوى، سنراقب مقاومة 4382. وسيشير الإغلاق فوق 4382 إلى القمة الأعلى الأولى مقارنةً بموجة الهبوط الأخيرة، باعتباره إشارة إلى أن الاتجاه الصعودي من المرجح أن يستمر.
إذا استمر الارتفاع وبقي السعر فوق خط الاتجاه الأزرق الهابط، فسيكون قد اخترق خط الاتجاه الهابط هذا. وفي هذا السيناريو، يمكن توقع المزيد من الحركة الصعودية، وربما يؤدي ذلك إلى إعادة اختبار القمة.
في الرسم البياني الأسبوعي، يظل الاتجاه الصعودي قائمًا طالما أن السعر يحافظ على مستوى 3887.
إذا حدث تراجع من المستويات الحالية، فإن منطقة 4003–4038 تمثل منطقة دعم فيبوناتشي 0.618–0.786. وقد يجد المشترين هنا ويحاول اختراق مستوى المقاومة 4220.
في الرسم البياني لأربع ساعات، يقترب السعر من مقاومة 4220؛ وإذا حافظ على موقعه فوق هذا المستوى، سنراقب مقاومة 4382. وسيشير الإغلاق فوق 4382 إلى القمة الأعلى الأولى مقارنةً بموجة الهبوط الأخيرة، باعتباره إشارة إلى أن الاتجاه الصعودي من المرجح أن يستمر.
إذا استمر الارتفاع وبقي السعر فوق خط الاتجاه الأزرق الهابط، فسيكون قد اخترق خط الاتجاه الهابط هذا. وفي هذا السيناريو، يمكن توقع المزيد من الحركة الصعودية، وربما يؤدي ذلك إلى إعادة اختبار القمة.
في الرسم البياني الأسبوعي، يظل الاتجاه الصعودي قائمًا طالما أن السعر يحافظ على مستوى 3887.
1
1
63
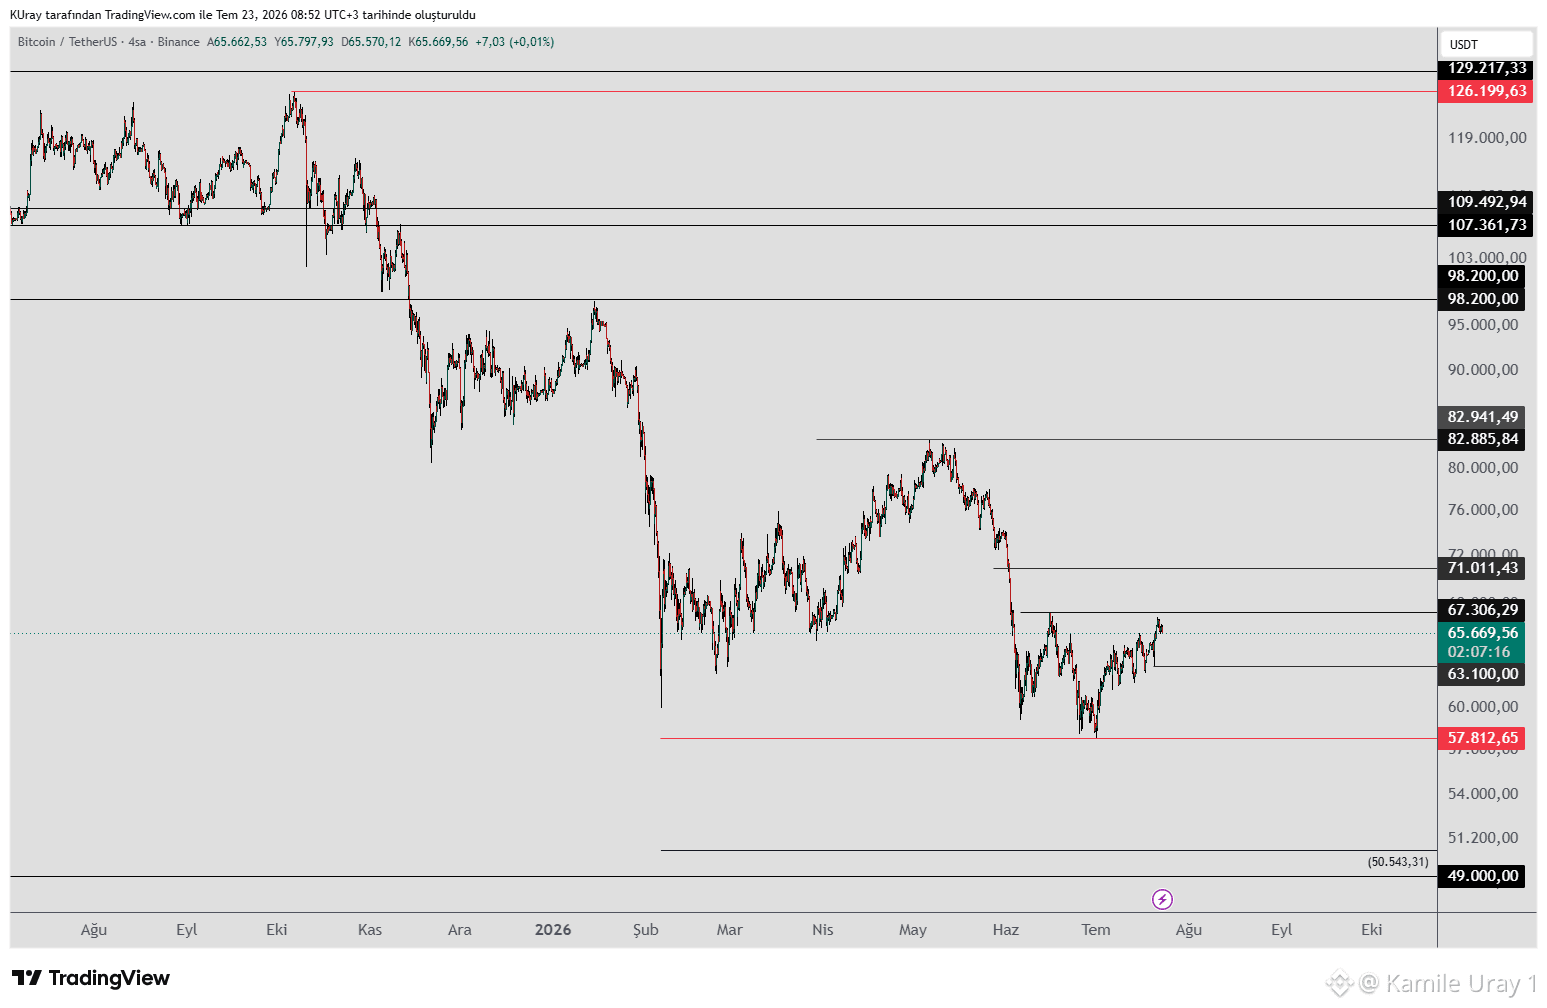
قد يختبر #BTC مستوى 67,500، حيث يواصل الحفاظ على مستوى 63,100 على مخطط 4 ساعات.
وقد سبق أن عمل هذا المستوى كمقاومة ويمكن أن يفعل ذلك مرة أخرى؛ نحتاج إلى رؤية اختراق بحجم تداول مرتفع. وإلا فقد يحدث تراجع.
إذا حافظ على مستوى أعلى من 63,100 أثناء التراجع، فقد يحاول كسر المقاومة مرة أخرى. وإذا تمكن من البقاء فوق مستوى المقاومة 67,500، فهناك احتمال أن يختبر مستويات المقاومة 71,000 و75,000 و82,885.
في حال تحقق إغلاق يومي أو أسبوعي فوق 82,885، فسيشير ذلك إلى تسجيل القمة الأعلى الأولى مقارنة بموجة الهبوط الأخيرة. ويُعد ذلك إشارة إيجابية بأن الاتجاه الصعودي من المرجح أن يستمر.
إذا انخفض إلى ما دون 63,100، فقد يعيد اختبار مستوى 57,000. ومن المتوقع أن يعمل هذا المستوى كمستوى دعم.
إذا جاء الإغلاق الأسبوعي دون 57,000، فإن احتمالية استمرار التراجع ستزداد، وقد يمتد الانخفاض باتجاه مستويات دعم 49,000–50,000.
قد يختبر #BTC مستوى 67,500، حيث يواصل الحفاظ على مستوى 63,100 على مخطط 4 ساعات.
وقد سبق أن عمل هذا المستوى كمقاومة ويمكن أن يفعل ذلك مرة أخرى؛ نحتاج إلى رؤية اختراق بحجم تداول مرتفع. وإلا فقد يحدث تراجع.
إذا حافظ على مستوى أعلى من 63,100 أثناء التراجع، فقد يحاول كسر المقاومة مرة أخرى. وإذا تمكن من البقاء فوق مستوى المقاومة 67,500، فهناك احتمال أن يختبر مستويات المقاومة 71,000 و75,000 و82,885.
في حال تحقق إغلاق يومي أو أسبوعي فوق 82,885، فسيشير ذلك إلى تسجيل القمة الأعلى الأولى مقارنة بموجة الهبوط الأخيرة. ويُعد ذلك إشارة إيجابية بأن الاتجاه الصعودي من المرجح أن يستمر.
إذا انخفض إلى ما دون 63,100، فقد يعيد اختبار مستوى 57,000. ومن المتوقع أن يعمل هذا المستوى كمستوى دعم.
إذا جاء الإغلاق الأسبوعي دون 57,000، فإن احتمالية استمرار التراجع ستزداد، وقد يمتد الانخفاض باتجاه مستويات دعم 49,000–50,000.
وقد سبق أن عمل هذا المستوى كمقاومة ويمكن أن يفعل ذلك مرة أخرى؛ نحتاج إلى رؤية اختراق بحجم تداول مرتفع. وإلا فقد يحدث تراجع.
إذا حافظ على مستوى أعلى من 63,100 أثناء التراجع، فقد يحاول كسر المقاومة مرة أخرى. وإذا تمكن من البقاء فوق مستوى المقاومة 67,500، فهناك احتمال أن يختبر مستويات المقاومة 71,000 و75,000 و82,885.
في حال تحقق إغلاق يومي أو أسبوعي فوق 82,885، فسيشير ذلك إلى تسجيل القمة الأعلى الأولى مقارنة بموجة الهبوط الأخيرة. ويُعد ذلك إشارة إيجابية بأن الاتجاه الصعودي من المرجح أن يستمر.
إذا انخفض إلى ما دون 63,100، فقد يعيد اختبار مستوى 57,000. ومن المتوقع أن يعمل هذا المستوى كمستوى دعم.
إذا جاء الإغلاق الأسبوعي دون 57,000، فإن احتمالية استمرار التراجع ستزداد، وقد يمتد الانخفاض باتجاه مستويات دعم 49,000–50,000.
60
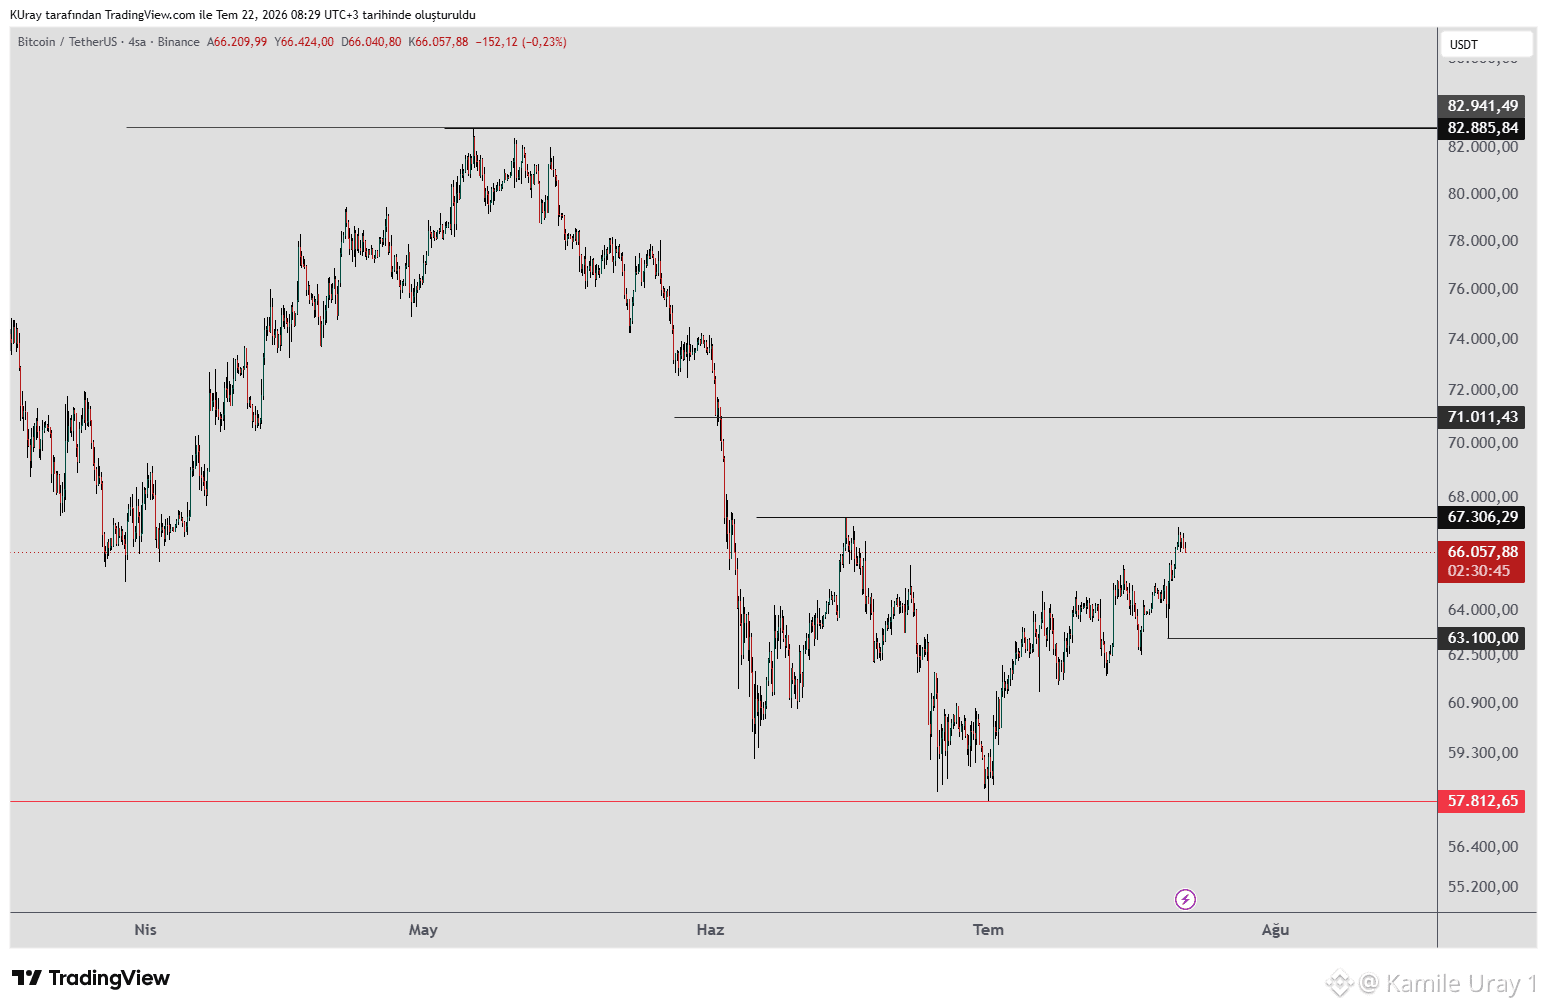
على مخطط الأربع ساعات، #BTC يواصل الحفاظ على مستوى 63,100، والذي يُعد مرجعنا لمتابعة الاتجاه. قد يختبر مستوى 67,500؛ وبما أن هذا المستوى كان يعمل سابقًا كمقاومة، فقد يؤدي حدوث رفض عنده إلى تراجع. إذا تمكن من البقاء فوق 63,100 أثناء مثل هذا التراجع، فقد يحاول كسر المقاومة مرة أخرى.
إذا استمر في الحفاظ على مركز فوق مستوى المقاومة 67,500، فهناك احتمال أن يختبر مستويات المقاومة 71,000 و75,000 و82,885.
إذا أغلق السعر فوق 82,885 على كلٍّ من الإطارين اليومي والأسبوعي، فسيُعد ذلك أول قمة أعلى مقارنةً بموجة الهبوط الأخيرة. وهذا يُشكل إشارة إيجابية على أن الاتجاه الصعودي يُرجح أن يستمر.
إذا انخفض تحت 63,100، فقد يعيد اختبار مستوى 57,000، والذي يُتوقع أن يعمل كدعم.
إذا أغلق الأسبوعي تحت 57,000، فستزداد احتمالية استمرار التراجع، وقد تمتد الحركة الهبوطية نحو مستويات الدعم 49,000–50,000.
على مخطط الأربع ساعات، #BTC يواصل الحفاظ على مستوى 63,100، والذي يُعد مرجعنا لمتابعة الاتجاه. قد يختبر مستوى 67,500؛ وبما أن هذا المستوى كان يعمل سابقًا كمقاومة، فقد يؤدي حدوث رفض عنده إلى تراجع. إذا تمكن من البقاء فوق 63,100 أثناء مثل هذا التراجع، فقد يحاول كسر المقاومة مرة أخرى.
إذا استمر في الحفاظ على مركز فوق مستوى المقاومة 67,500، فهناك احتمال أن يختبر مستويات المقاومة 71,000 و75,000 و82,885.
إذا أغلق السعر فوق 82,885 على كلٍّ من الإطارين اليومي والأسبوعي، فسيُعد ذلك أول قمة أعلى مقارنةً بموجة الهبوط الأخيرة. وهذا يُشكل إشارة إيجابية على أن الاتجاه الصعودي يُرجح أن يستمر.
إذا انخفض تحت 63,100، فقد يعيد اختبار مستوى 57,000، والذي يُتوقع أن يعمل كدعم.
إذا أغلق الأسبوعي تحت 57,000، فستزداد احتمالية استمرار التراجع، وقد تمتد الحركة الهبوطية نحو مستويات الدعم 49,000–50,000.
إذا استمر في الحفاظ على مركز فوق مستوى المقاومة 67,500، فهناك احتمال أن يختبر مستويات المقاومة 71,000 و75,000 و82,885.
إذا أغلق السعر فوق 82,885 على كلٍّ من الإطارين اليومي والأسبوعي، فسيُعد ذلك أول قمة أعلى مقارنةً بموجة الهبوط الأخيرة. وهذا يُشكل إشارة إيجابية على أن الاتجاه الصعودي يُرجح أن يستمر.
إذا انخفض تحت 63,100، فقد يعيد اختبار مستوى 57,000، والذي يُتوقع أن يعمل كدعم.
إذا أغلق الأسبوعي تحت 57,000، فستزداد احتمالية استمرار التراجع، وقد تمتد الحركة الهبوطية نحو مستويات الدعم 49,000–50,000.
76
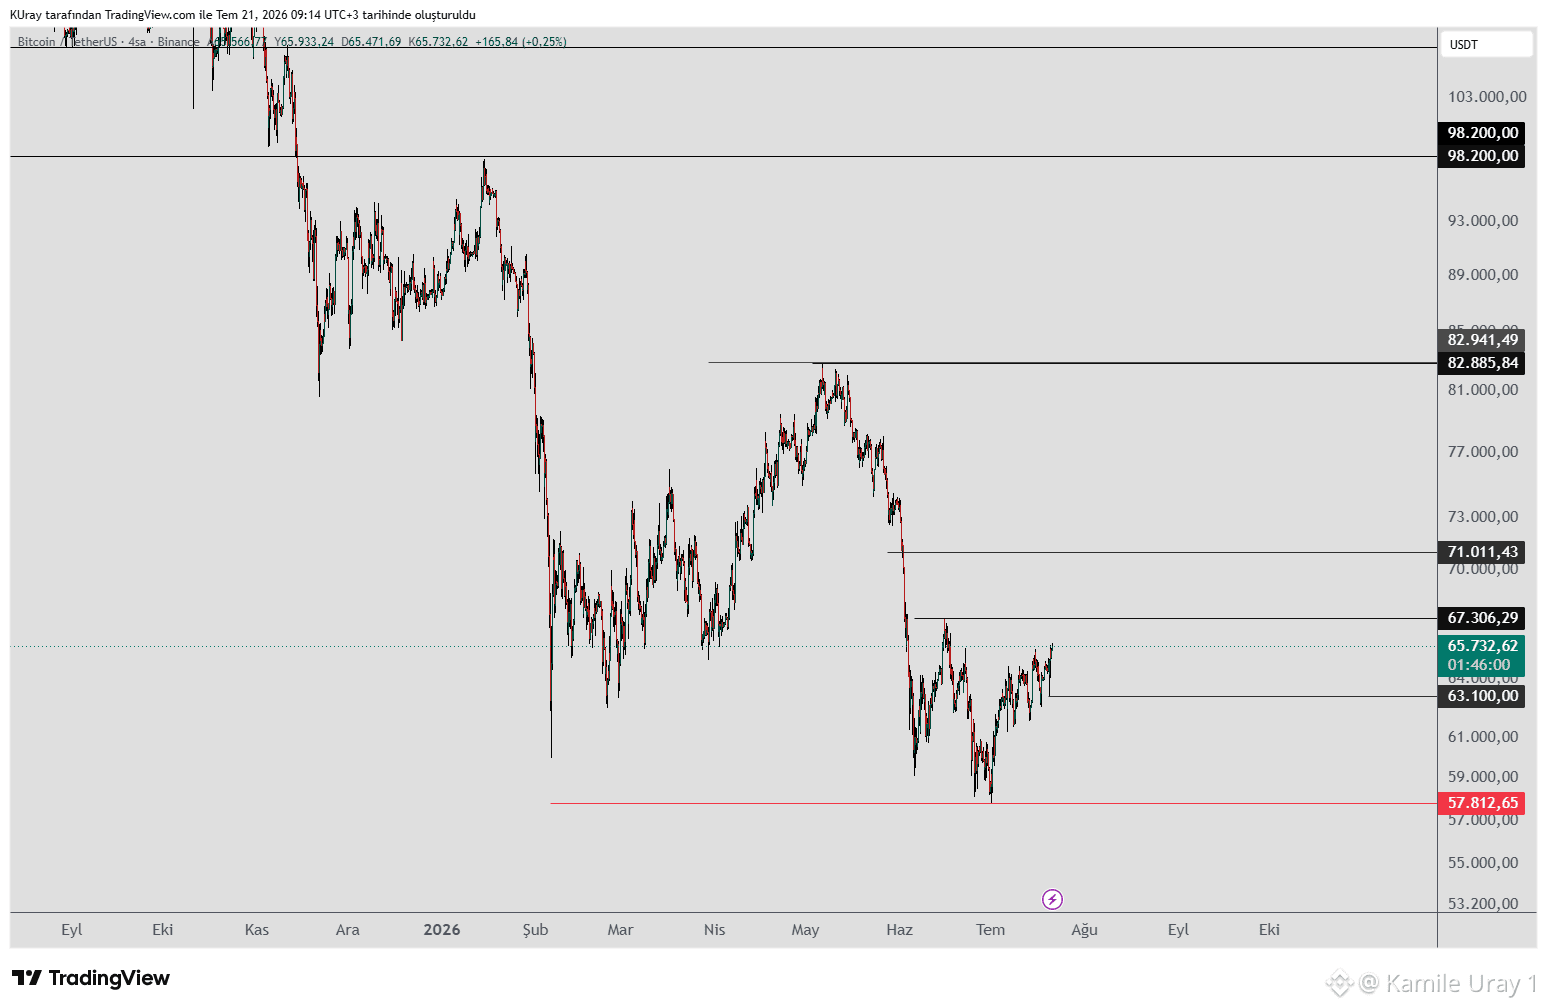
#BTC على مخطط الأربع ساعات، نرفع مستوى متابعة الاتجاه إلى 63,100. يظل البقاء فوق هذا المستوى يحافظ على احتمال حدوث حركة صعودية.
إذا ثبت السعر فوق مستوى المقاومة 67,500 أثناء الترند الصاعد، فقد يختبر مستويات المقاومة 71,000 و75,000 و82,885.
إذا حدث إغلاق يومي أو أسبوعي فوق 82,885، فسيُعد ذلك القمة الأعلى الأولى مقارنةً بالموجة الهابطة الأخيرة. وهذا بمثابة إشارة إيجابية تدعم استمرار الاتجاه الصاعد.
إذا انخفض السعر تحت 63,100، فقد يعيد اختبار مستوى 57,000؛ ومن المتوقع أن يعمل هذا المستوى كمقاومة/دعم (دعم).
إذا حدث إغلاق أسبوعي دون 57,000، فإن احتمالية استمرار التراجع تزداد، وقد يؤدي ذلك إلى هبوط نحو مستويات الدعم 49,000–50,000.
#BTC على مخطط الأربع ساعات، نرفع مستوى متابعة الاتجاه إلى 63,100. يظل البقاء فوق هذا المستوى يحافظ على احتمال حدوث حركة صعودية.
إذا ثبت السعر فوق مستوى المقاومة 67,500 أثناء الترند الصاعد، فقد يختبر مستويات المقاومة 71,000 و75,000 و82,885.
إذا حدث إغلاق يومي أو أسبوعي فوق 82,885، فسيُعد ذلك القمة الأعلى الأولى مقارنةً بالموجة الهابطة الأخيرة. وهذا بمثابة إشارة إيجابية تدعم استمرار الاتجاه الصاعد.
إذا انخفض السعر تحت 63,100، فقد يعيد اختبار مستوى 57,000؛ ومن المتوقع أن يعمل هذا المستوى كمقاومة/دعم (دعم).
إذا حدث إغلاق أسبوعي دون 57,000، فإن احتمالية استمرار التراجع تزداد، وقد يؤدي ذلك إلى هبوط نحو مستويات الدعم 49,000–50,000.
إذا ثبت السعر فوق مستوى المقاومة 67,500 أثناء الترند الصاعد، فقد يختبر مستويات المقاومة 71,000 و75,000 و82,885.
إذا حدث إغلاق يومي أو أسبوعي فوق 82,885، فسيُعد ذلك القمة الأعلى الأولى مقارنةً بالموجة الهابطة الأخيرة. وهذا بمثابة إشارة إيجابية تدعم استمرار الاتجاه الصاعد.
إذا انخفض السعر تحت 63,100، فقد يعيد اختبار مستوى 57,000؛ ومن المتوقع أن يعمل هذا المستوى كمقاومة/دعم (دعم).
إذا حدث إغلاق أسبوعي دون 57,000، فإن احتمالية استمرار التراجع تزداد، وقد يؤدي ذلك إلى هبوط نحو مستويات الدعم 49,000–50,000.
77
سجّل الدخول لاستكشاف المزيد من المُحتوى
انضم إلى مُستخدمي العملات الرقمية حول العالم على Binance Square
⚡️ احصل على أحدث المعلومات المفيدة عن العملات الرقمية.
💬 موثوقة من قبل أكبر منصّة لتداول العملات الرقمية في العالم.
👍 اكتشف الرؤى الحقيقية من صنّاع المُحتوى الموثوقين.
البريد الإلكتروني / رقم الهاتف
المواضيع الرائجة
USAugustPPIRisesLessThanExpected
21,050 مشاهدات
488 يقومون بالنقاش
$BTC
بعد امتصاص الأسواق لبيانات مؤشر أسعار المنتجين (PPI) وتبدد سيناريو الهبوط العنيف، تتجه الأنظار نحو جلسة الجمعة (إغلاق الأسبوع) والتي ستشهد تفاعلاً مزدوجاً بين إعادة هيكلة المحافظ ومؤشرات اقتصادية جديدة
$SOL
📌 1. التأثير الاستكمالي لبيانات PPI (تغطية المراكز البيعية)
استقرار الرؤية وانحسار التضخم: إيجابية قراءة Core PPI (0.20% مقابل متوقع 0.30%) تدفع المؤسسات لإعادة رسم استراتيجياتها؛ حيث يُتوقع حدوث عمليات Short Covering (إغلاق العقود البيعية) مع بداية الجلسة.
التقاط الأنفاس لـ الكريبتو وRWA: استمرار الارتداد الصاعد المباشر أو التماسك أعلى مناطق الدعم الرئيسية بدلاً من الهبوط الضاغط.
$FLOKI
📌 2. المحرك الرئيسي لجلسة الغد: مؤشر ثقة المستهلك (UoM) بيانات اليوم لن تعمل بمفردها، بل تلتقي غداً مع مؤشر ثقة المستهلك لجامعة ميشيغان لتقييم "توقعات التضخم":
🟢 توقعات تضخم منخفضة: ستُعزز إيجابية بيانات اليوم وتمنح الضوء الأخضر لاستكمال صعود الكريبتو والأسهم نحو الإغلاق الأسبوعي.
🔴 توقعات تضخم مرتفعة: قد تحد من القوة الصاعدة وتدخل الأسواق في نطاق تذبذب عرضي لحين اتضاح الرؤية.
#USAugustPPIRisesLessThanExpected
#SECApprovesNasdaqTexasCommodityTrustRule
#USContinuingJoblessClaims1.774M
#BTC
#floki
Mohammed Bash
·0 إعجاب
·347 مشاهدات
SECApprovesNasdaqTexasCommodityTrustRule
14,721 مشاهدات
409 يقومون بالنقاش
ECBRaisesRatesSecondTimeTo2.5%
11,614 مشاهدات
292 يقومون بالنقاش