
Justcryptopays 1
425 منشورات

Justcryptopays 1
إبلاغ
حظر المُستخدم
Crypto enthusiast | Exploring blockchain | insightful and Trader
0 تتابع
4 المتابعون
7 إعجاب
منشورات
عرض الترجمة
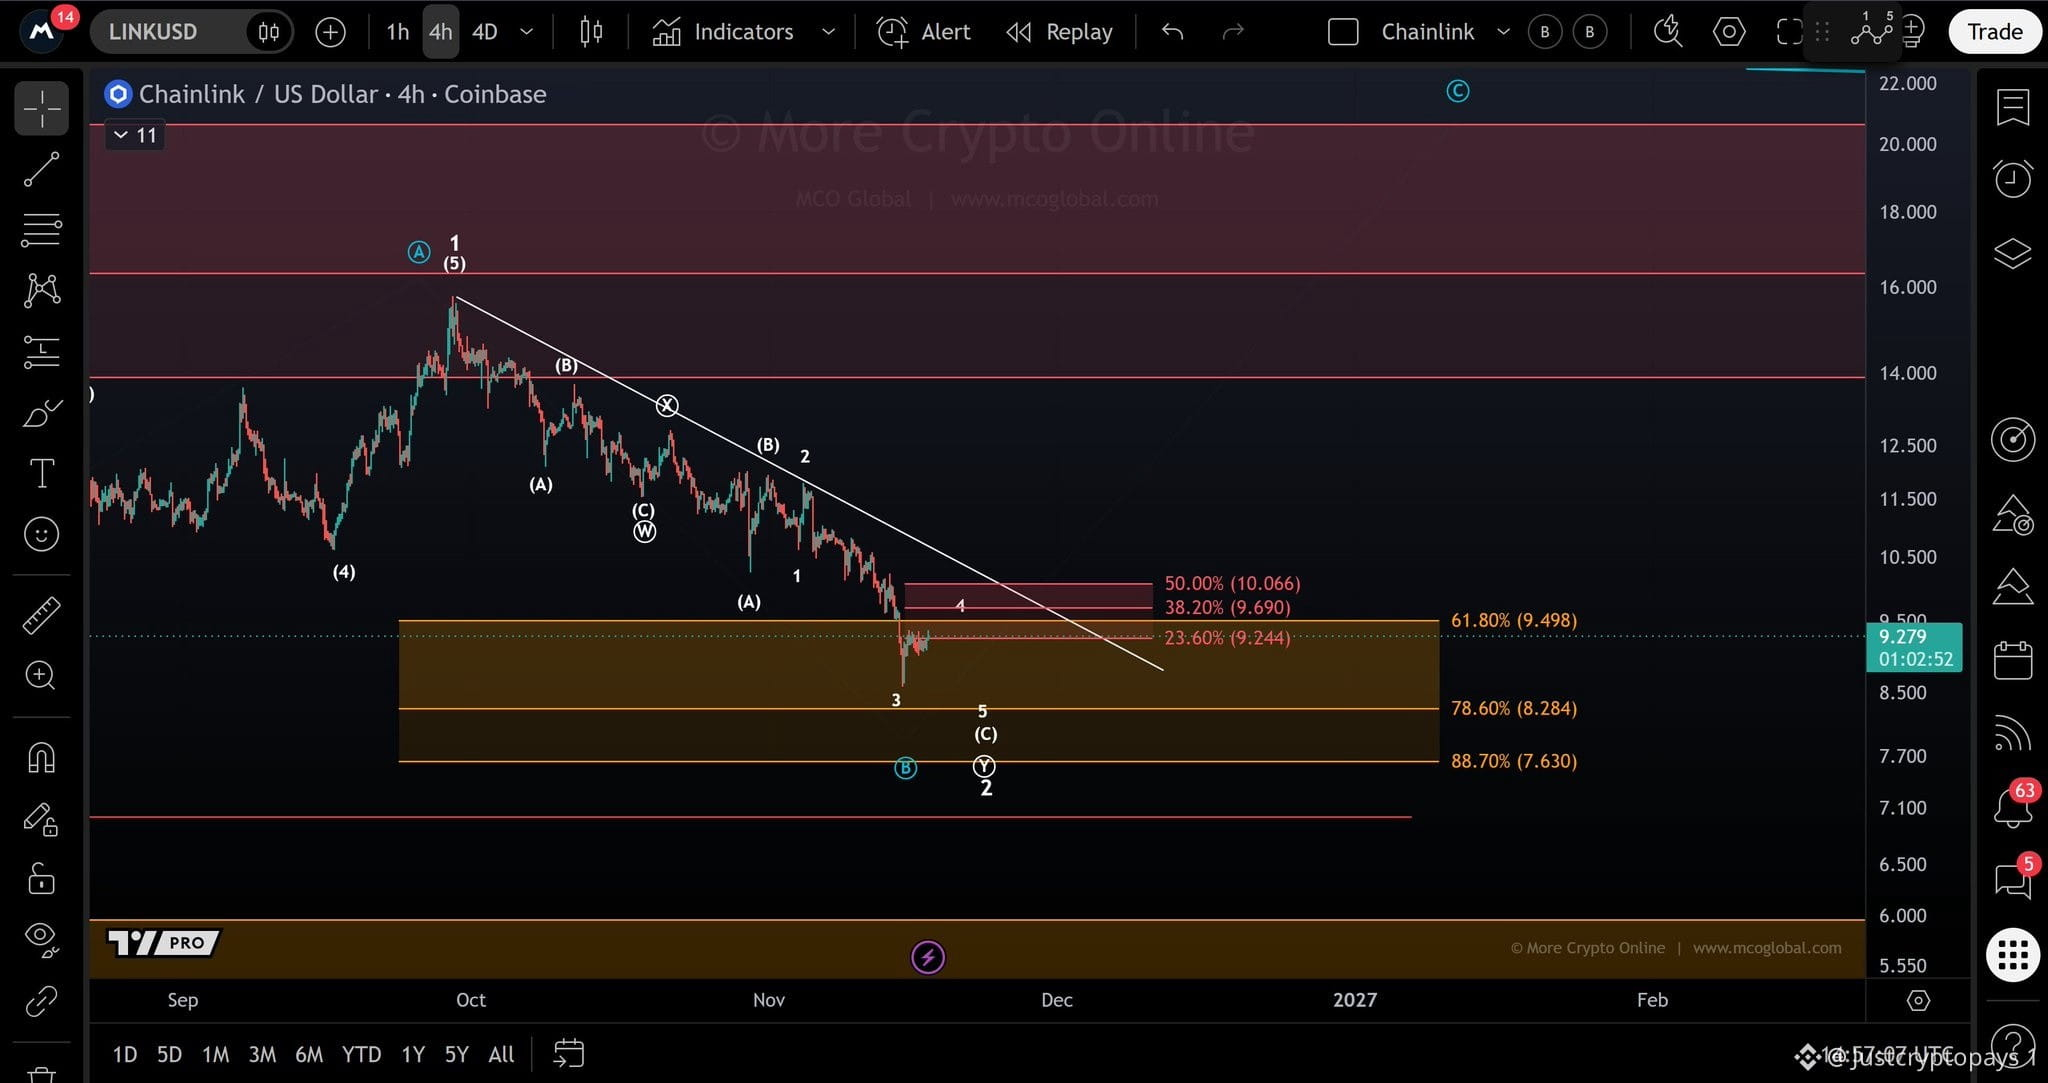
$LINK There has been very little movement, and the outlook remains unchanged. Price is still testing the first red resistance level at $9.244. As long as it stays below this level, wave 5 of wave (C) could still push lower into the orange support zone between $7.63 and $9.498. For now, there is still no clear confirmation that a bottom is in place. #Macro Insights# #Altcoin Season#
$LINK There has been very little movement, and the outlook remains unchanged. Price is still testing the first red resistance level at $9.244. As long as it stays below this level, wave 5 of wave (C) could still push lower into the orange support zone between $7.63 and $9.498. For now, there is still no clear confirmation that a bottom is in place. #Macro Insights# #Altcoin Season#
24
عرض الترجمة
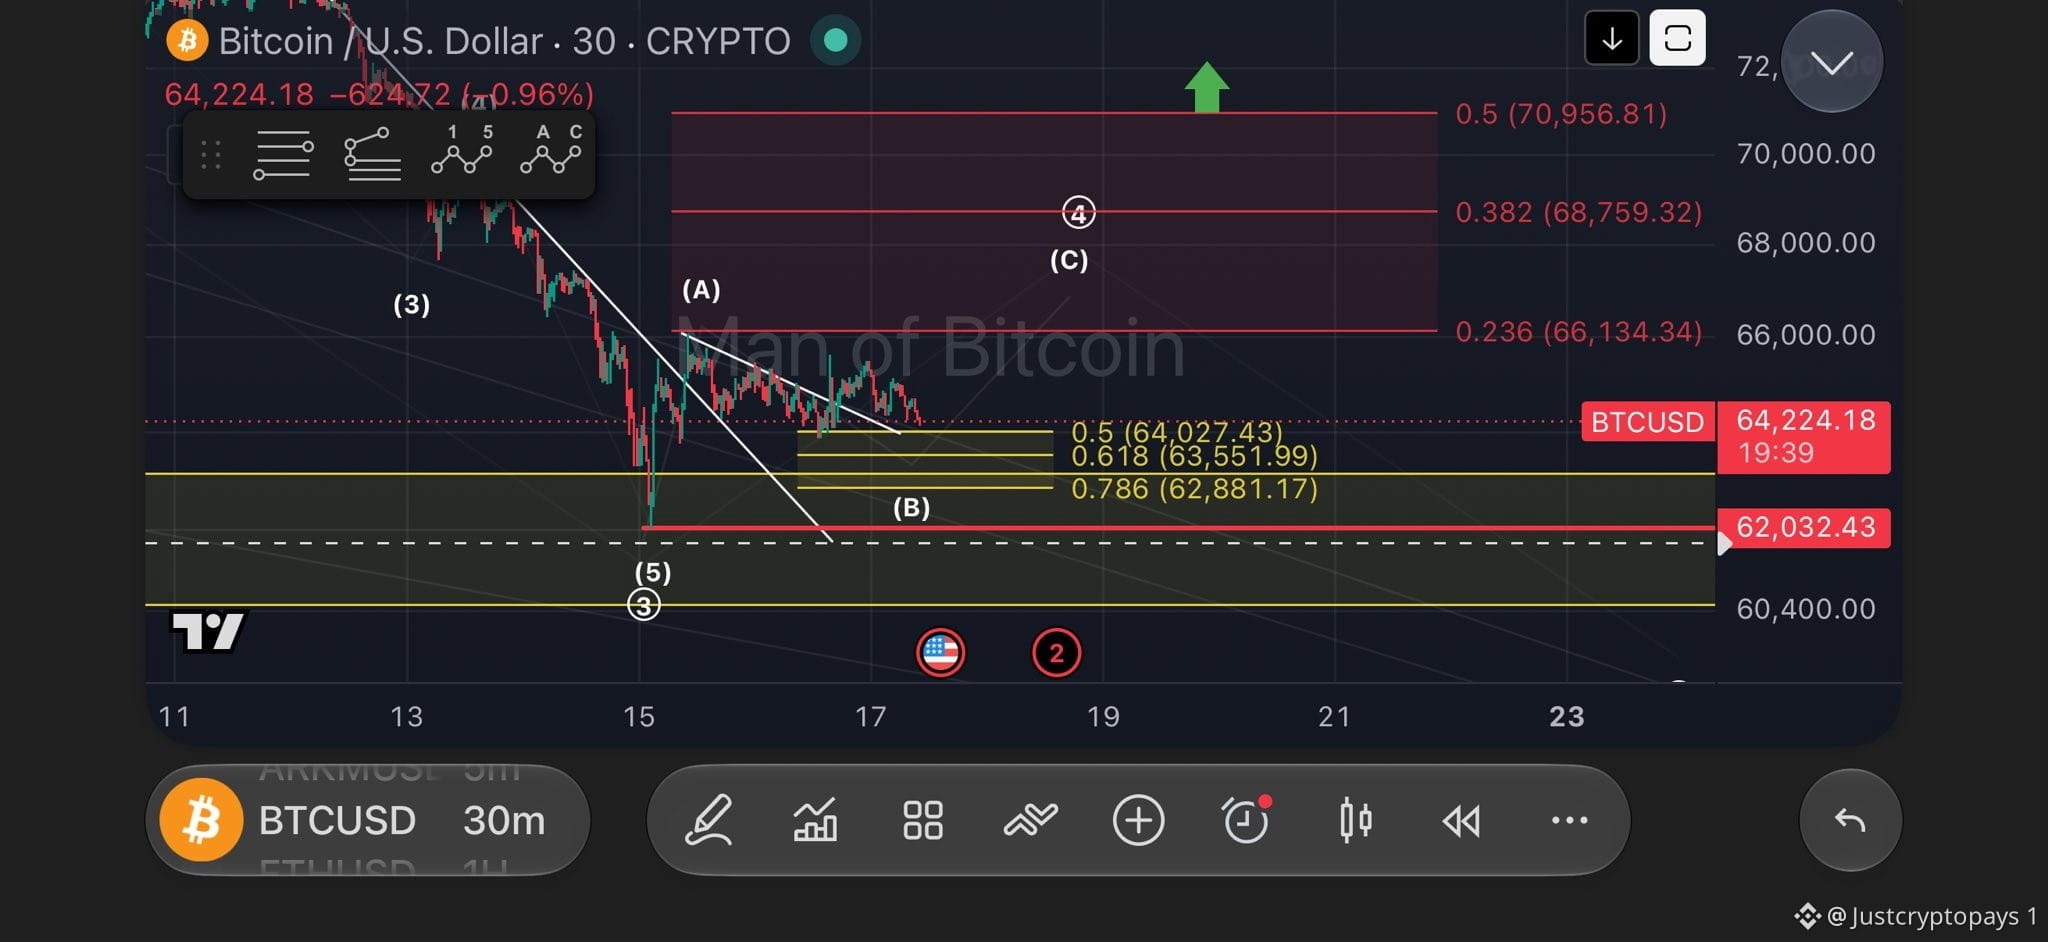
$BTC still appears to be forming wave-(B) to the downside. As long as the price holds above $62,032, the next expected move remains a wave-(C) of 4 to the upside. The key resistance to watch is $70,956. #BTC Price Analysis# #Bitcoin
$BTC still appears to be forming wave-(B) to the downside. As long as the price holds above $62,032, the next expected move remains a wave-(C) of 4 to the upside. The key resistance to watch is $70,956. #BTC Price Analysis# #Bitcoin
عرض الترجمة
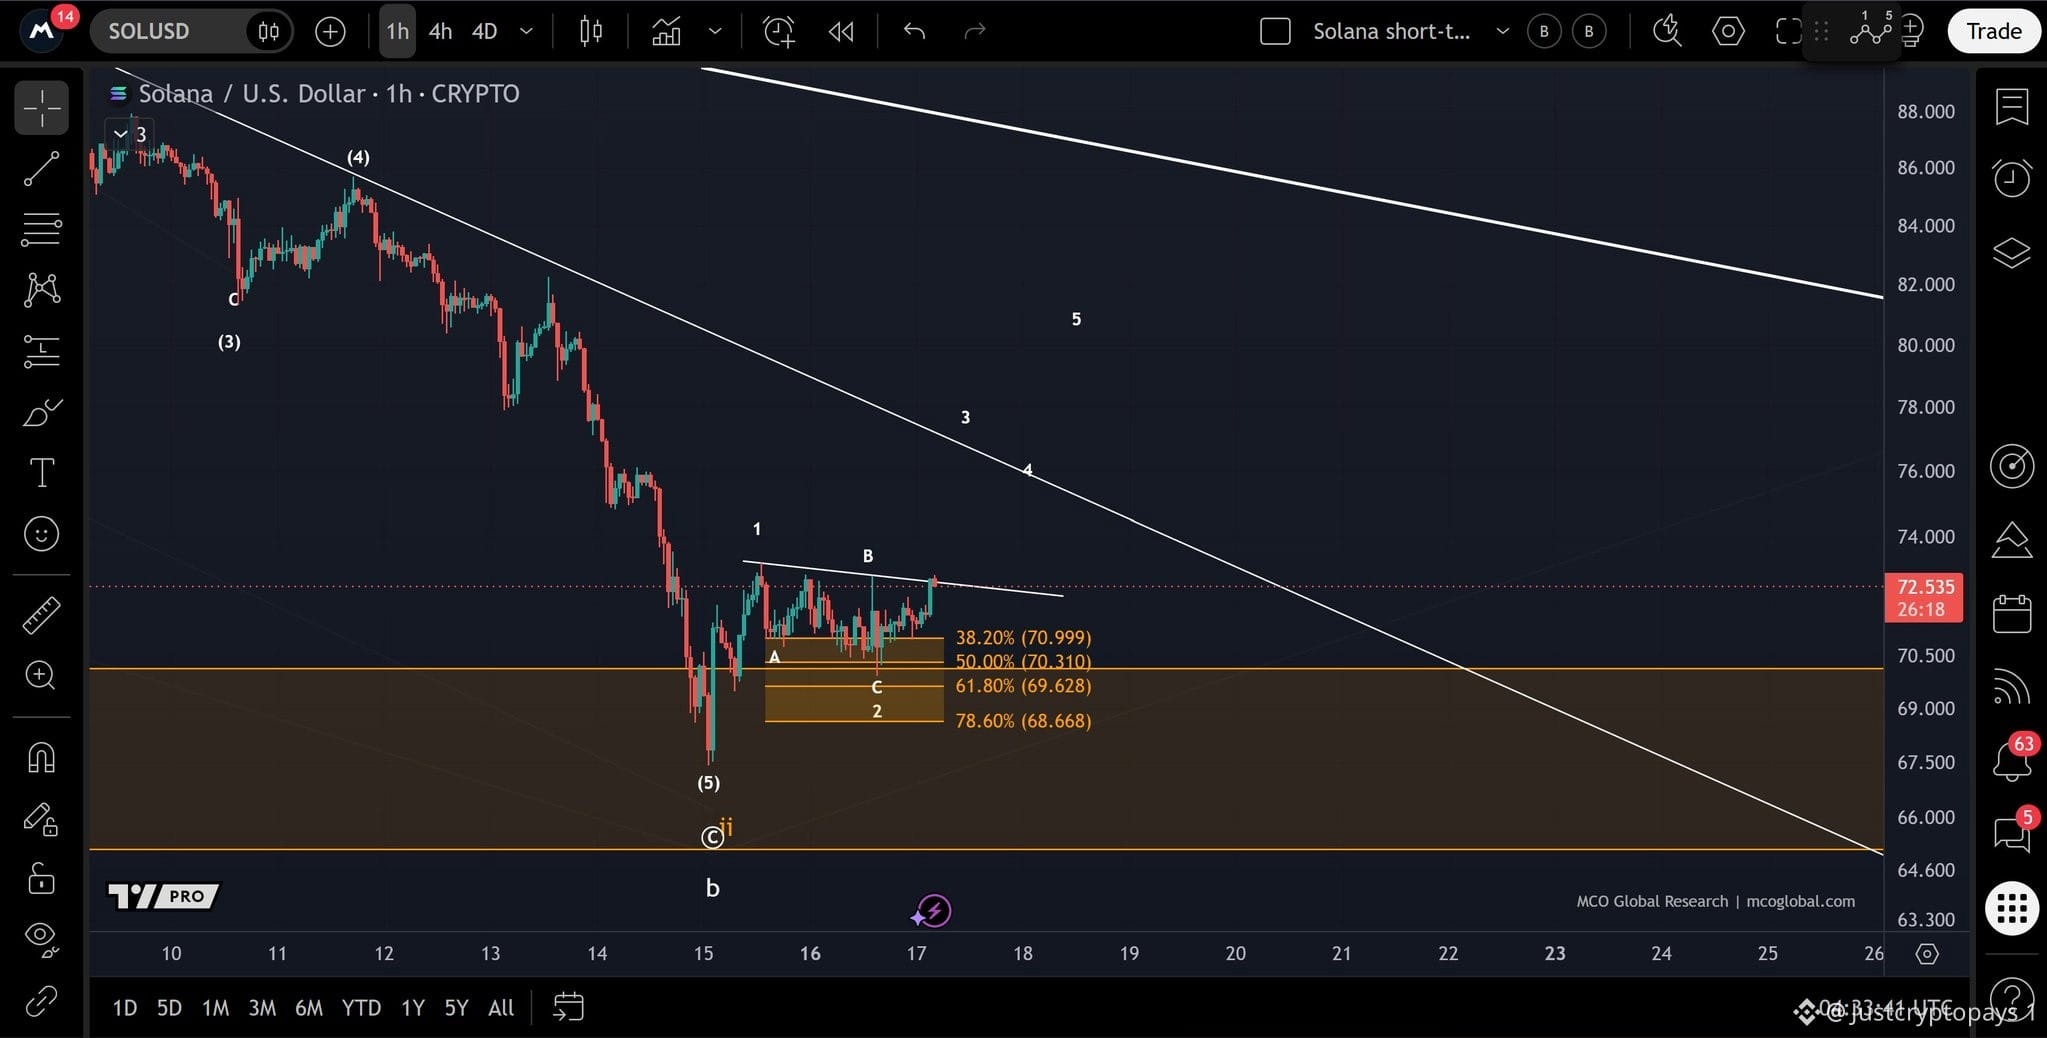
$SOL is showing its first upside reaction from the micro support zone between $68.668 and $70.999. Price is now testing the minor resistance formed by the recent highs. A break above this level would be an encouraging first sign for wave 3 in the white scenario, although the white trend line overhead remains the bigger resistance to watch. #Solana #SolanaETF
$SOL is showing its first upside reaction from the micro support zone between $68.668 and $70.999. Price is now testing the minor resistance formed by the recent highs. A break above this level would be an encouraging first sign for wave 3 in the white scenario, although the white trend line overhead remains the bigger resistance to watch. #Solana #SolanaETF
عرض الترجمة
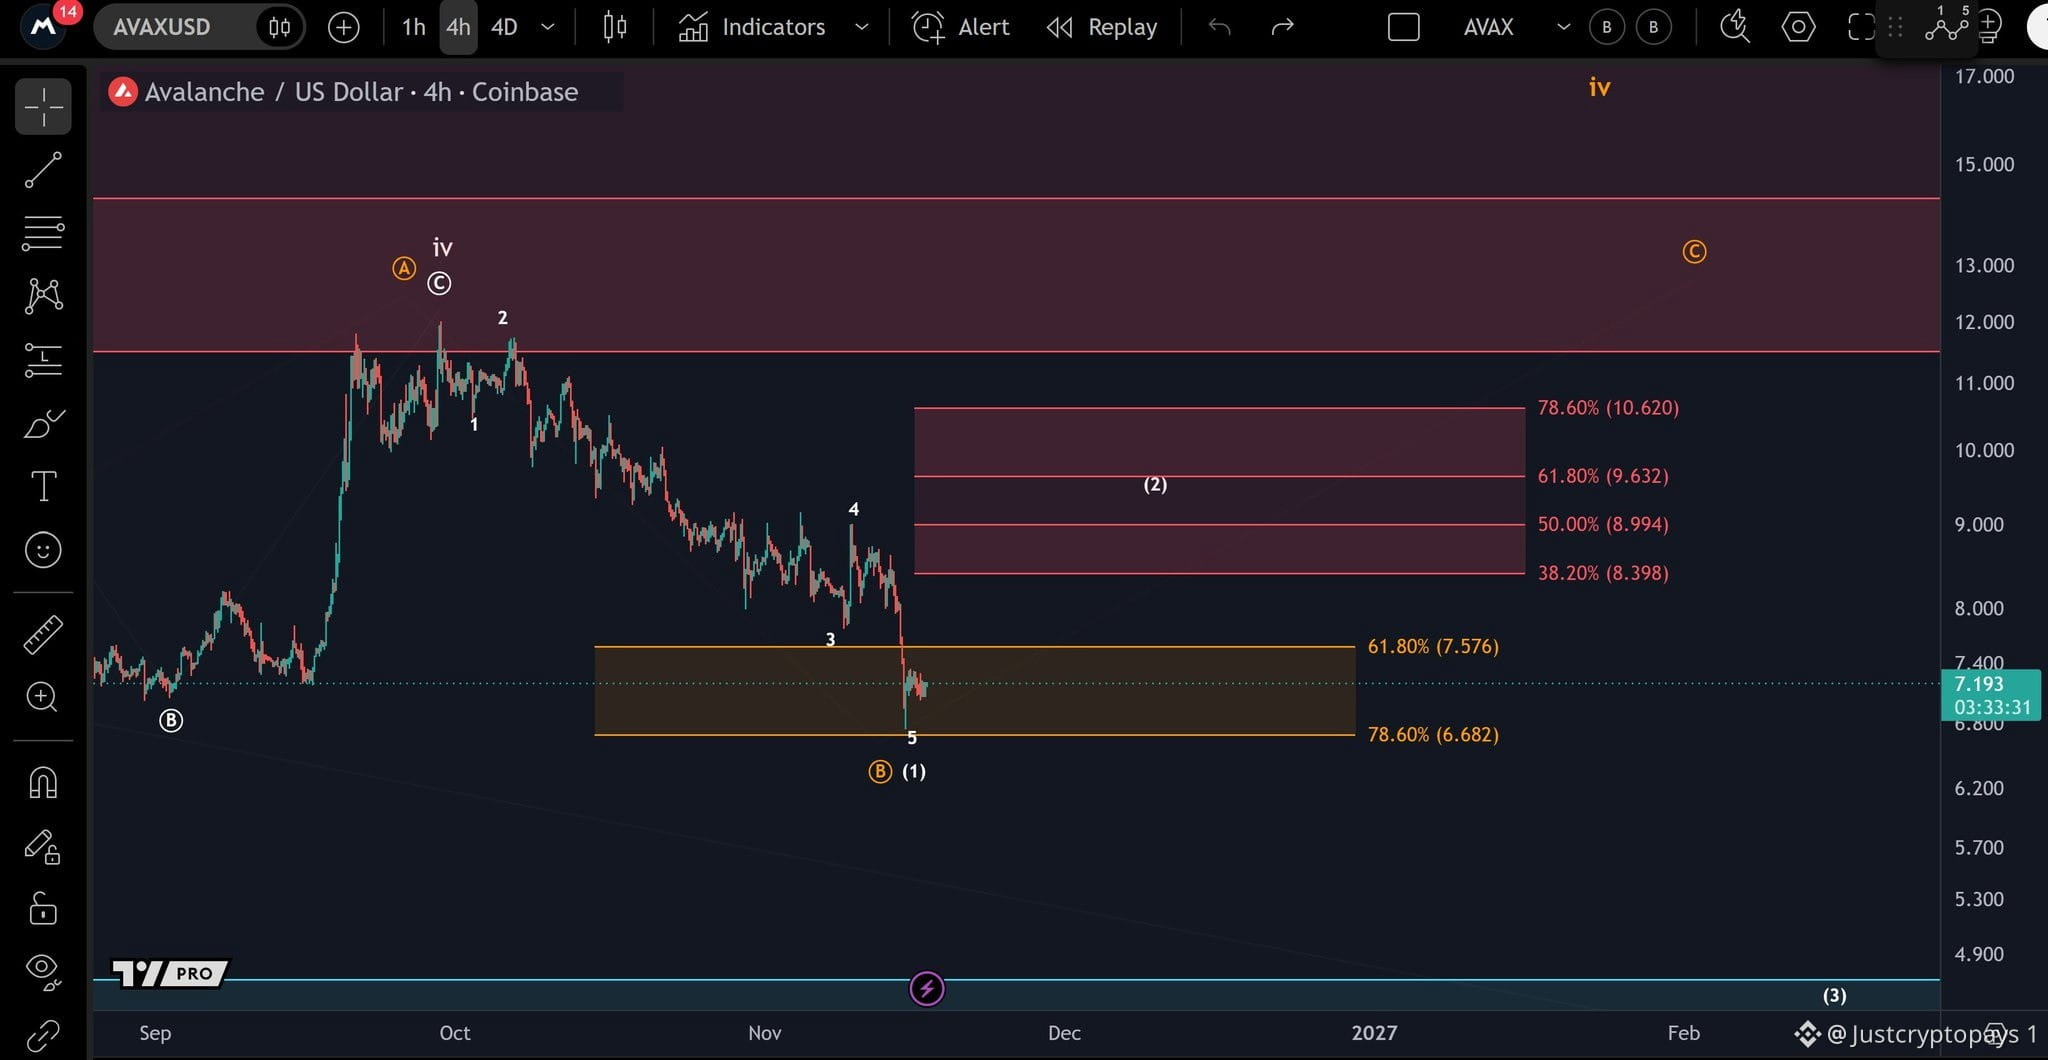
$AVAX AVAX remains within the micro support zone between $6.682 and $7.576. If the price bounces from here, the first major hurdle will be the red resistance zone between $8.398 and $10.620. However, the structure of the bounce will be important. A 3-wave move to the upside would likely represent wave (2) in the white scenario, leaving wave (3) to the downside as the next move. This would open the door to further declines. #Macro Insights# #Altcoin Season#
$AVAX AVAX remains within the micro support zone between $6.682 and $7.576. If the price bounces from here, the first major hurdle will be the red resistance zone between $8.398 and $10.620. However, the structure of the bounce will be important. A 3-wave move to the upside would likely represent wave (2) in the white scenario, leaving wave (3) to the downside as the next move. This would open the door to further declines. #Macro Insights# #Altcoin Season#
عرض الترجمة
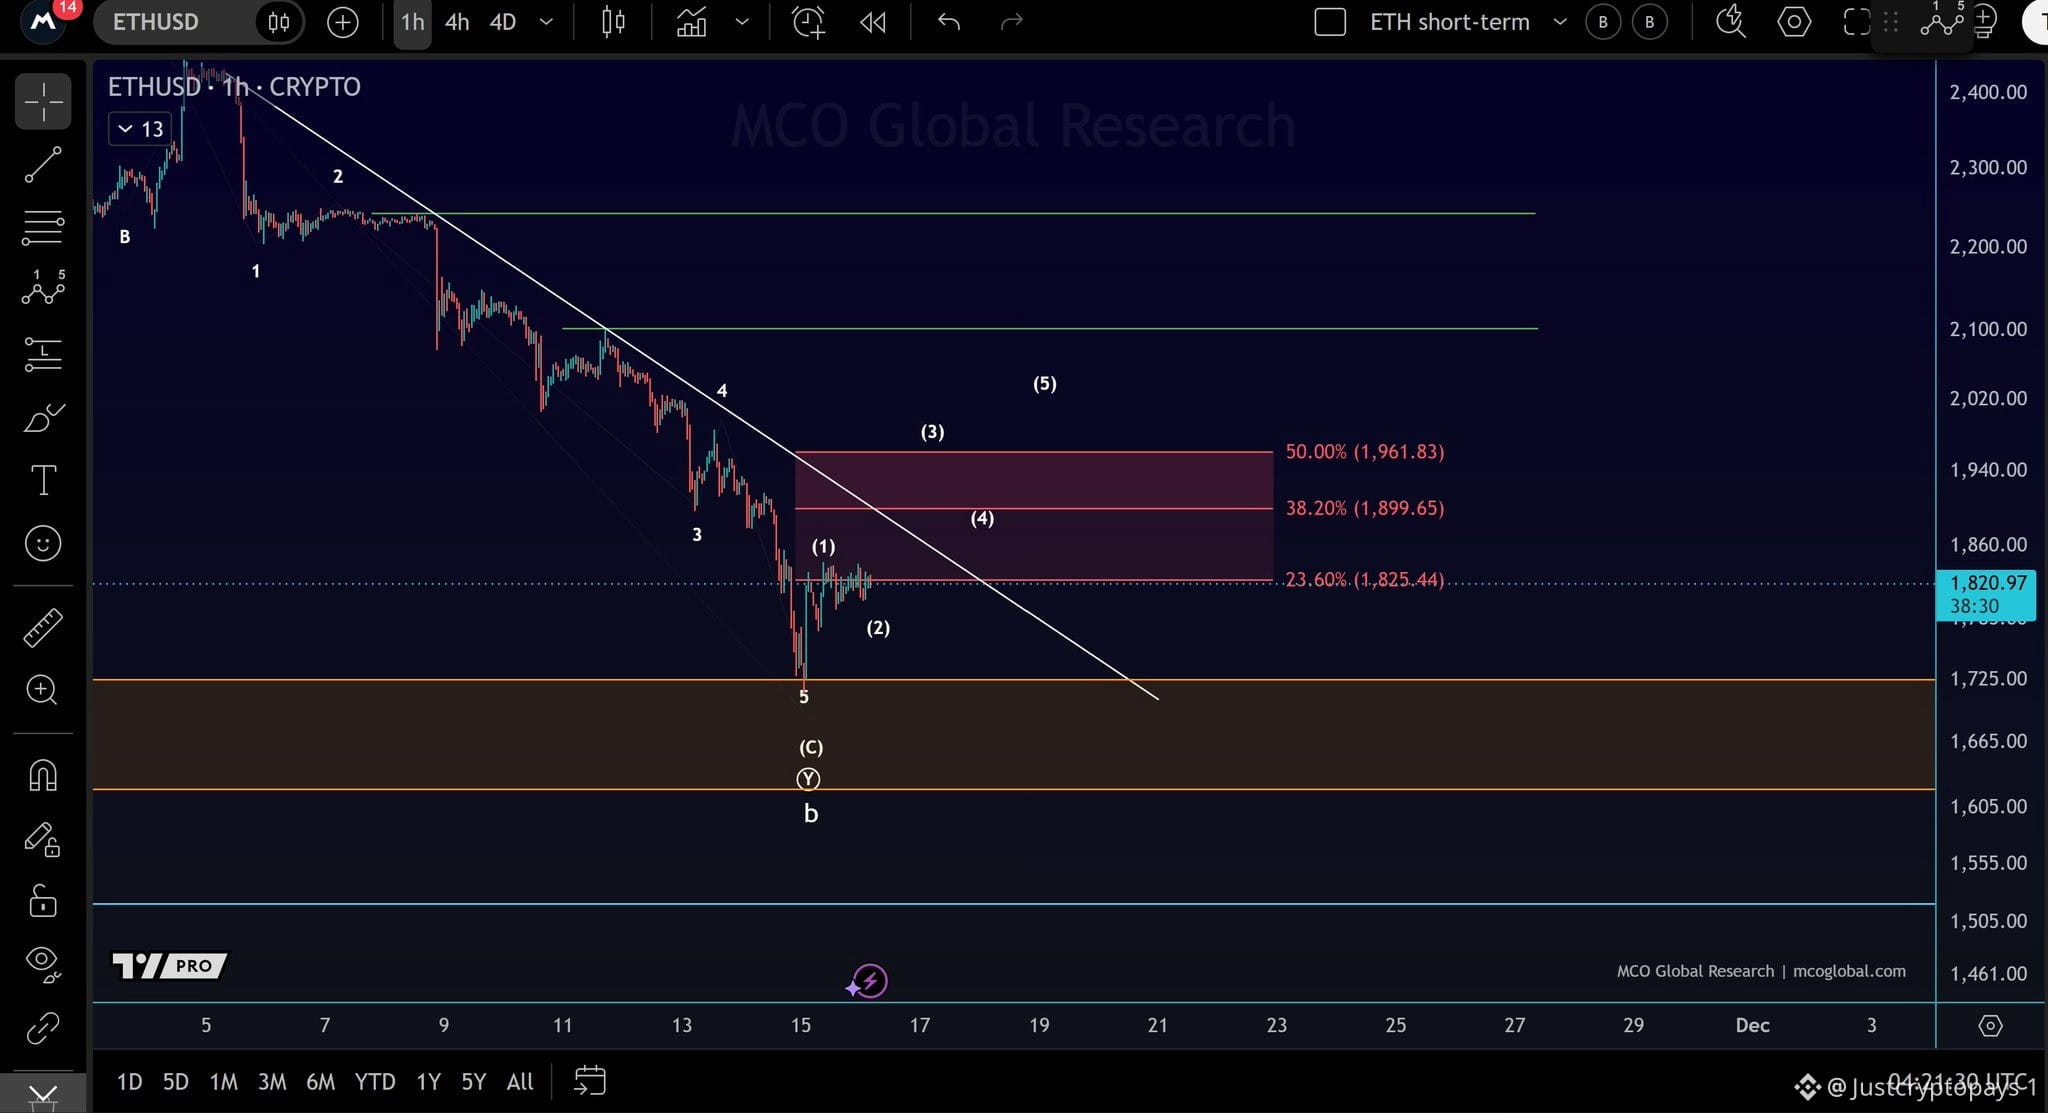
$ETH A clear 5-wave move to the upside, as outlined on the chart, is needed before we can consider a major bottom confirmed. For now, the white trendline and the red resistance zone between $1,825.44 and $1,961.83 remain key hurdles for the price to overcome. #ETH #Ethereum
$ETH A clear 5-wave move to the upside, as outlined on the chart, is needed before we can consider a major bottom confirmed. For now, the white trendline and the red resistance zone between $1,825.44 and $1,961.83 remain key hurdles for the price to overcome. #ETH #Ethereum
62
عرض الترجمة
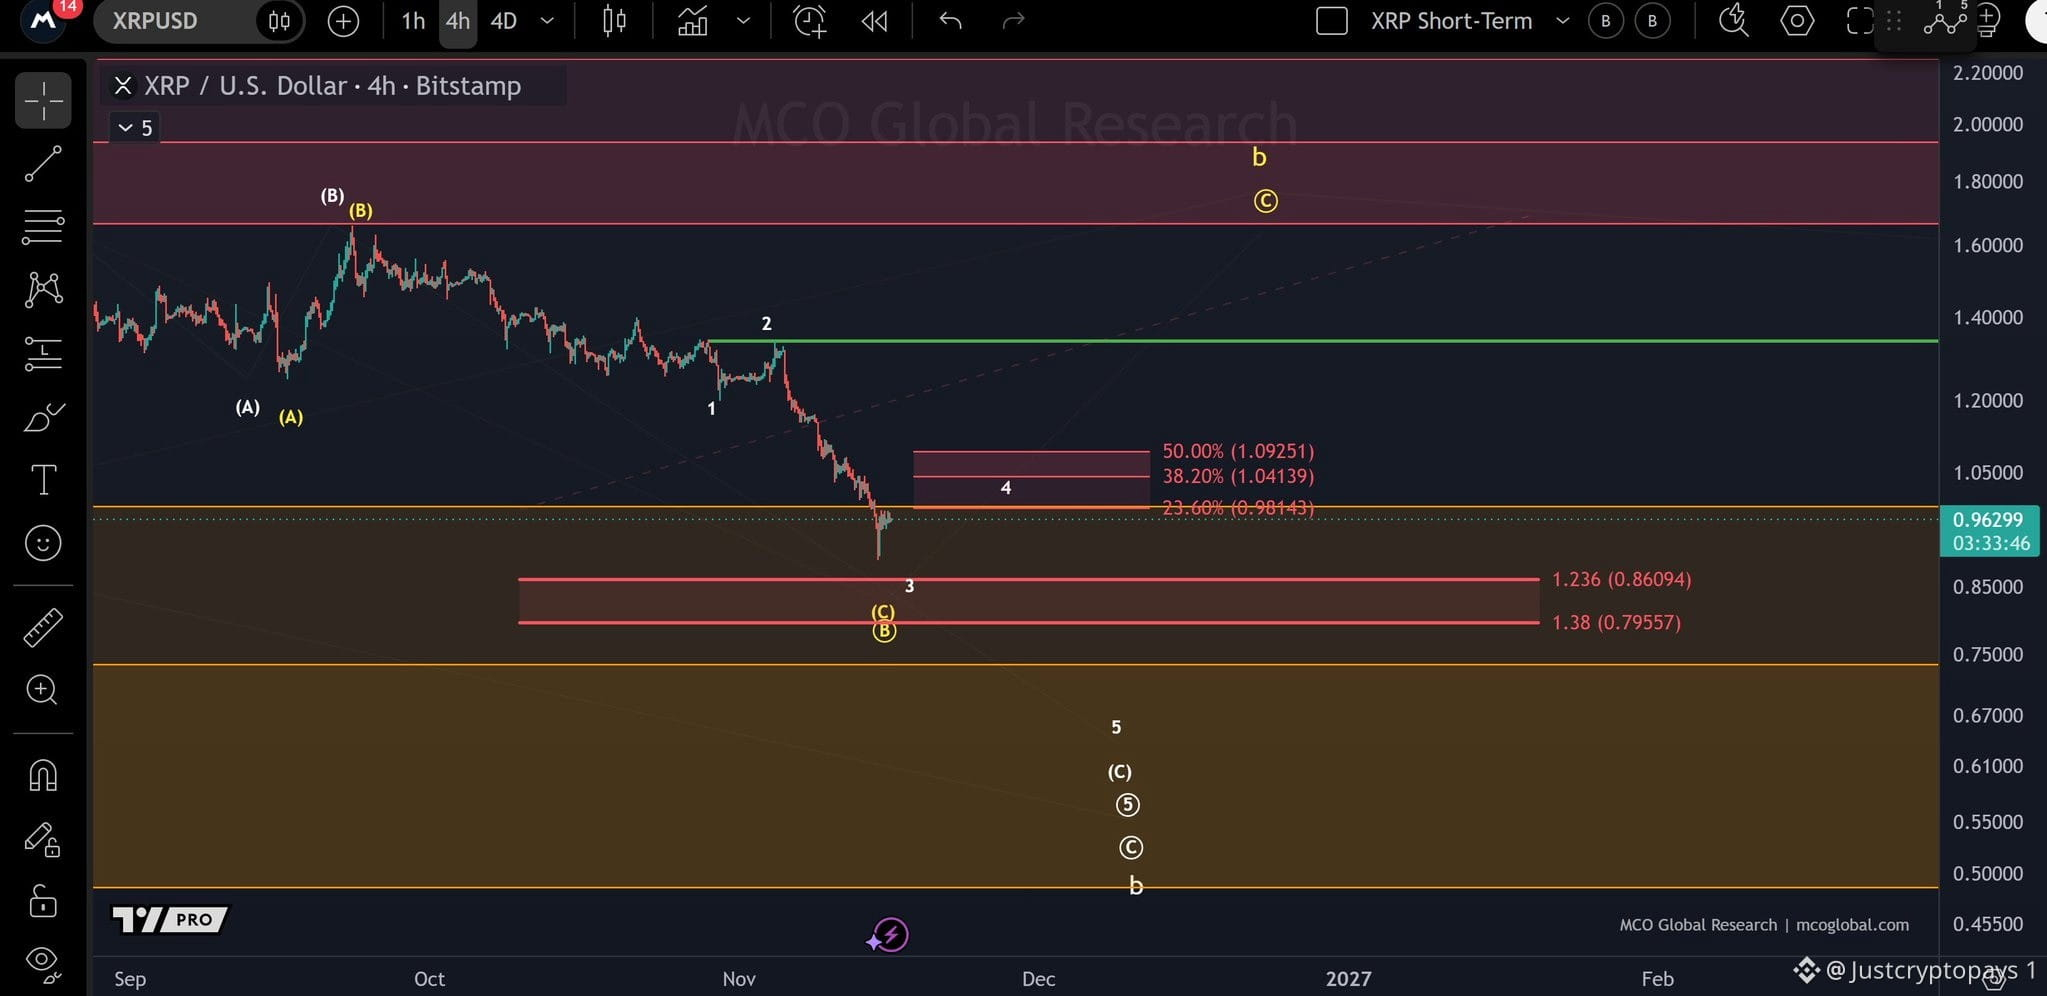
$XRP is showing a relatively weak bounce, with no clear indication of a bottom just yet. The first resistance remains between $0.981 and $1.09. A break above this zone would be the first sign that a local low may be in. #XRP #Ripple
$XRP is showing a relatively weak bounce, with no clear indication of a bottom just yet. The first resistance remains between $0.981 and $1.09. A break above this zone would be the first sign that a local low may be in. #XRP #Ripple
64
عرض الترجمة
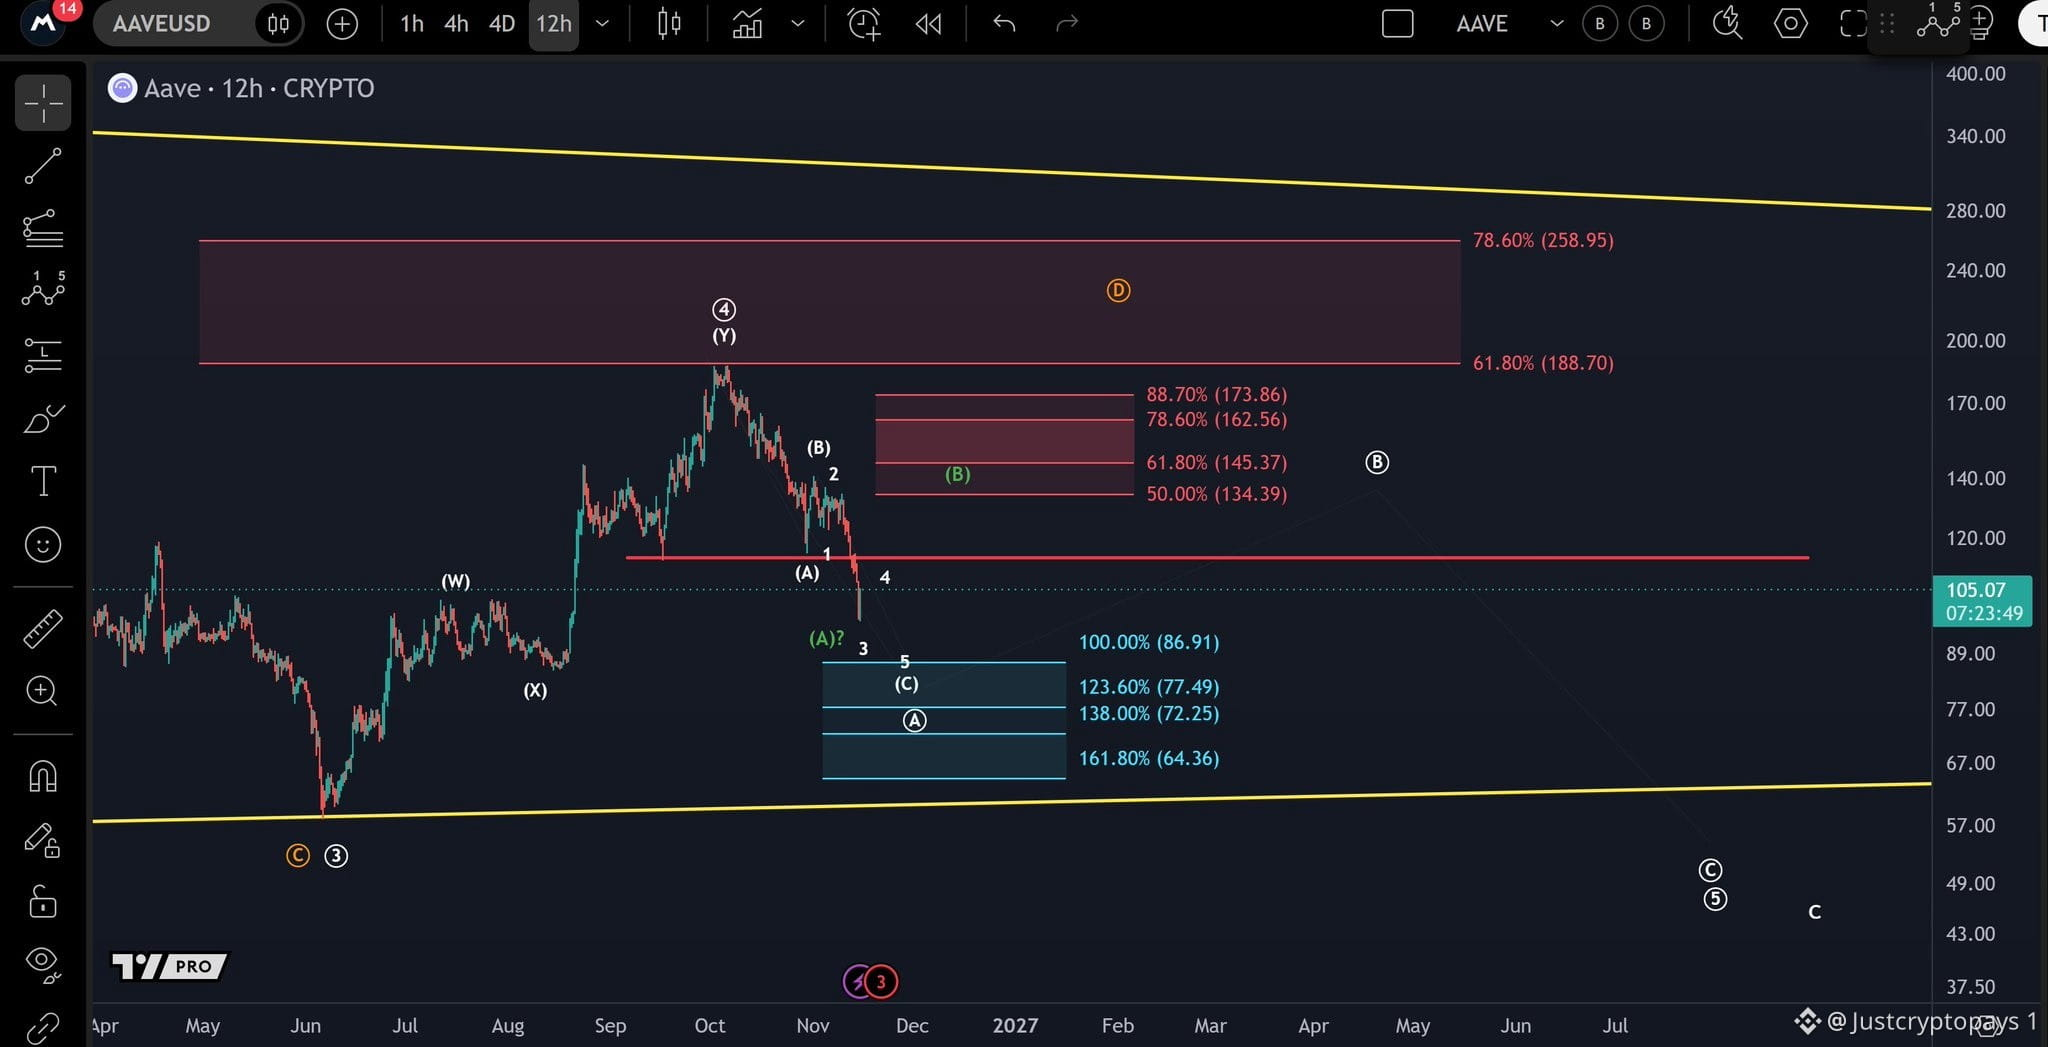
$AAVE Under the white scenario, the price could still see further downside toward the blue target zone between $64.36 and $86.91. This is where wave (C) of circle wave A could potentially come to an end. This scenario remains valid as long as the price stays below the red resistance level at $113.90. #Macro Insights# #Altcoin Season#
$AAVE Under the white scenario, the price could still see further downside toward the blue target zone between $64.36 and $86.91. This is where wave (C) of circle wave A could potentially come to an end. This scenario remains valid as long as the price stays below the red resistance level at $113.90. #Macro Insights# #Altcoin Season#
65
عرض الترجمة
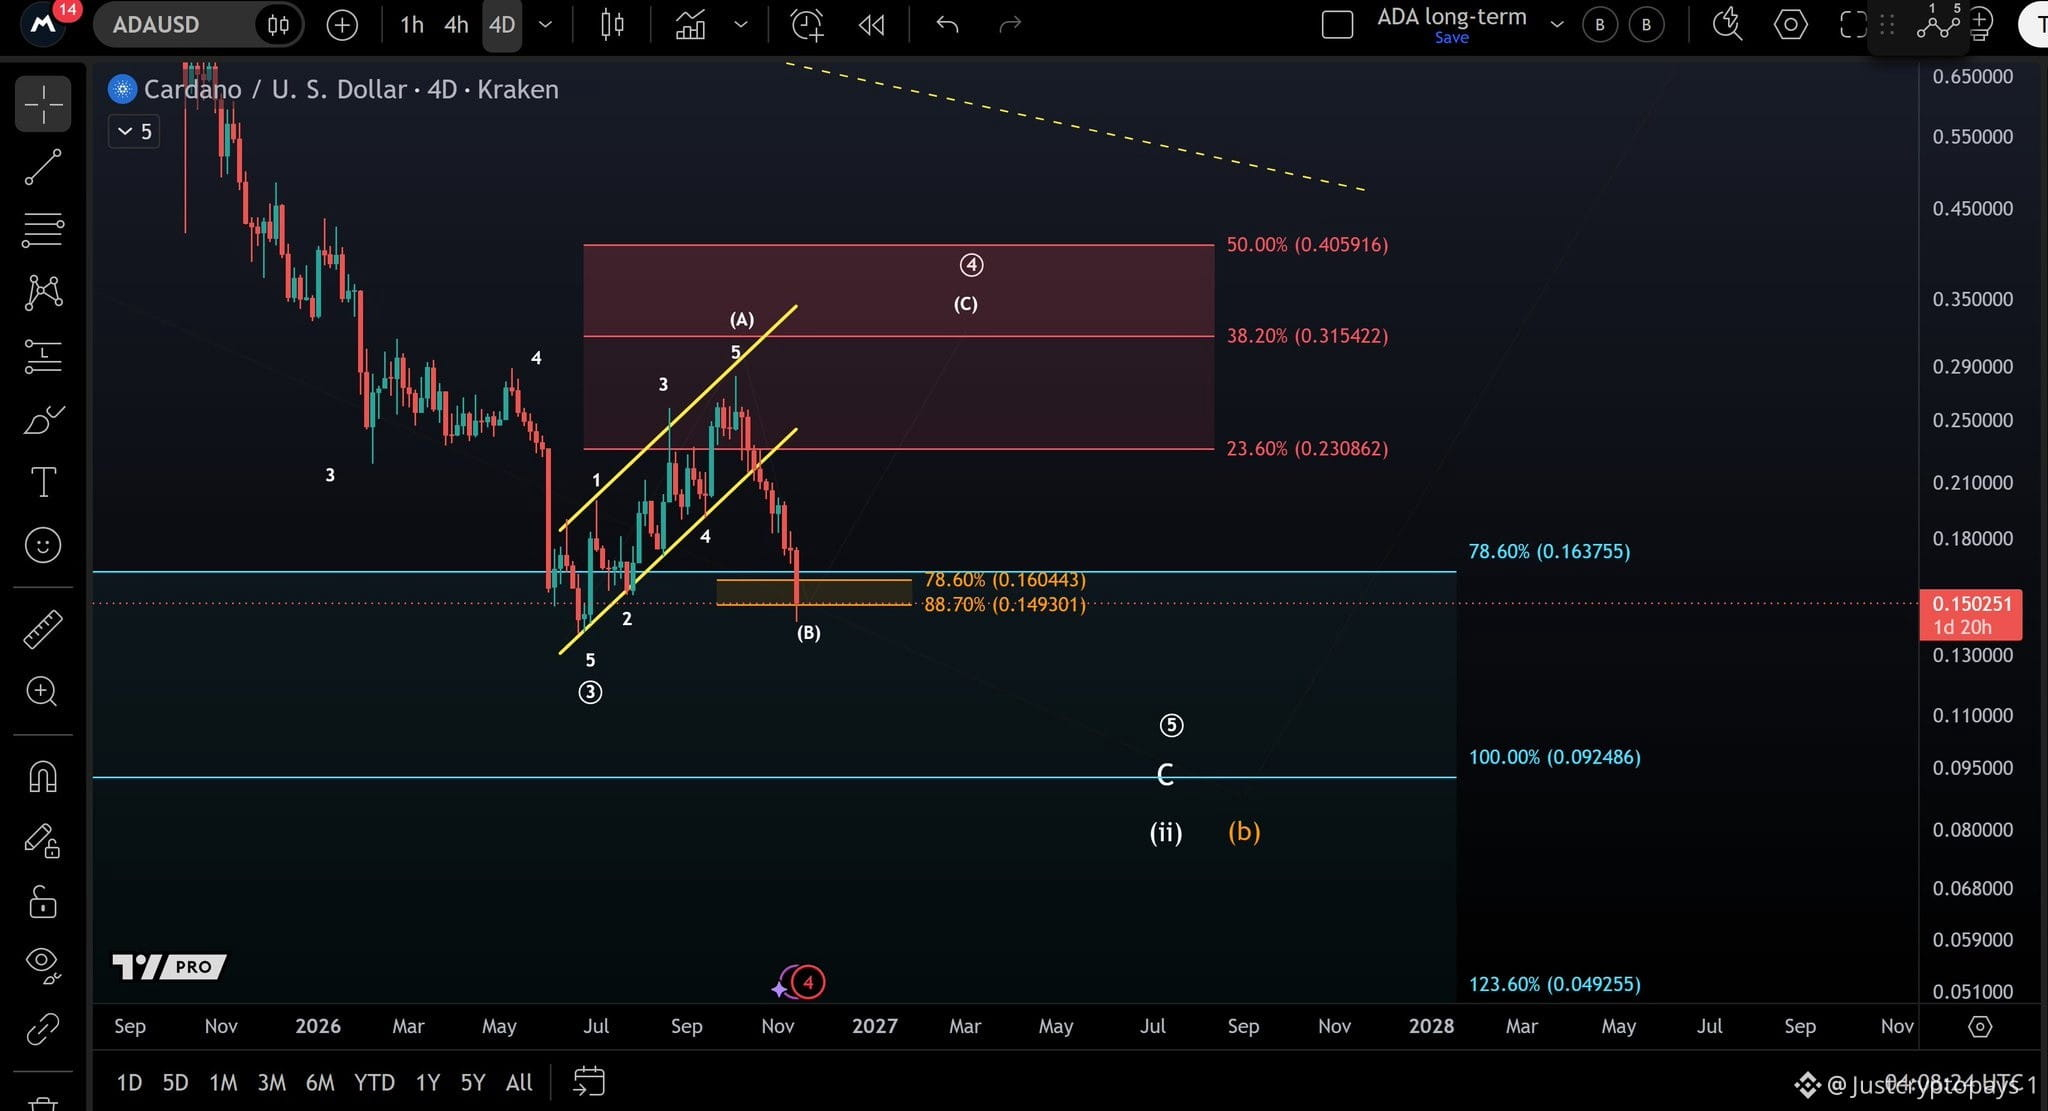
$ADA Price is currently testing the 88.7% Fibonacci retracement at $0.149, but there is still no clear indication of a bottom. If ADA breaks below the weekend low and fails to reclaim it, the next downside target sits at the 100% extension around $0.092. #Macro Insights# #Altcoin Season#
$ADA Price is currently testing the 88.7% Fibonacci retracement at $0.149, but there is still no clear indication of a bottom. If ADA breaks below the weekend low and fails to reclaim it, the next downside target sits at the 100% extension around $0.092. #Macro Insights# #Altcoin Season#
64
عرض الترجمة
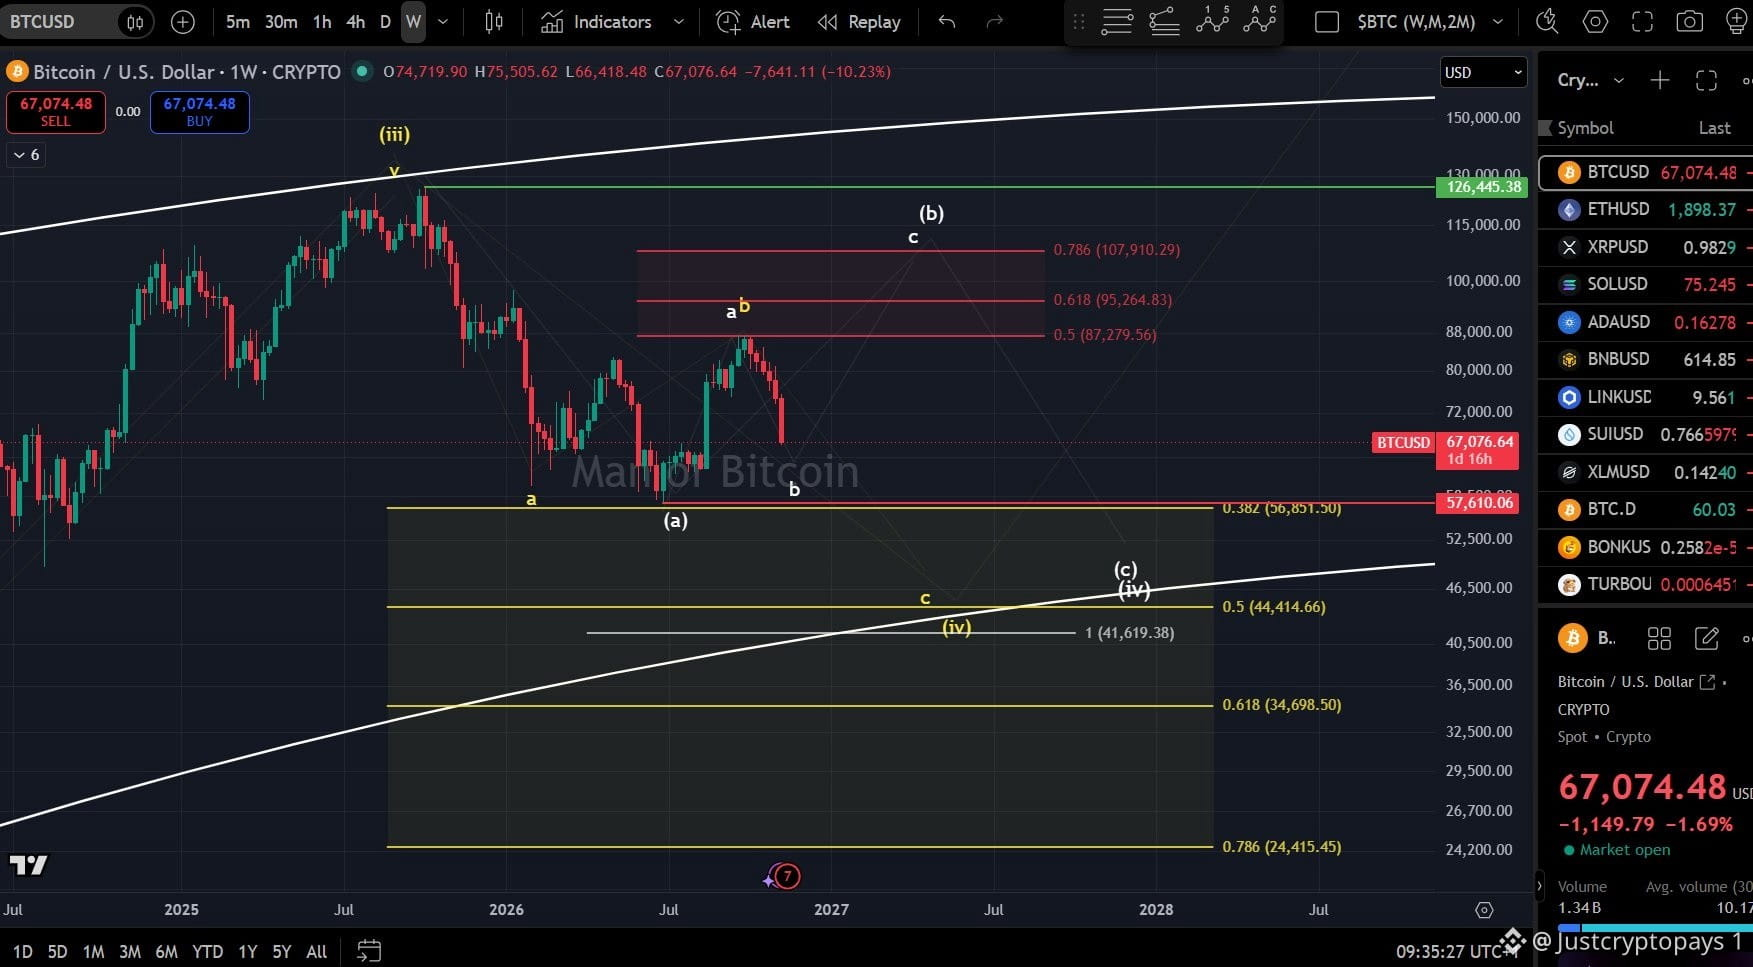
$BTC on the higher timeframe. If this weekly candle closes around the current levels, I would expect more downside. The key level to watch is $57,610. A break below it would put the white roadmap at risk. #BTC Price Analysis# #Bitcoin
$BTC on the higher timeframe. If this weekly candle closes around the current levels, I would expect more downside. The key level to watch is $57,610. A break below it would put the white roadmap at risk. #BTC Price Analysis# #Bitcoin
71
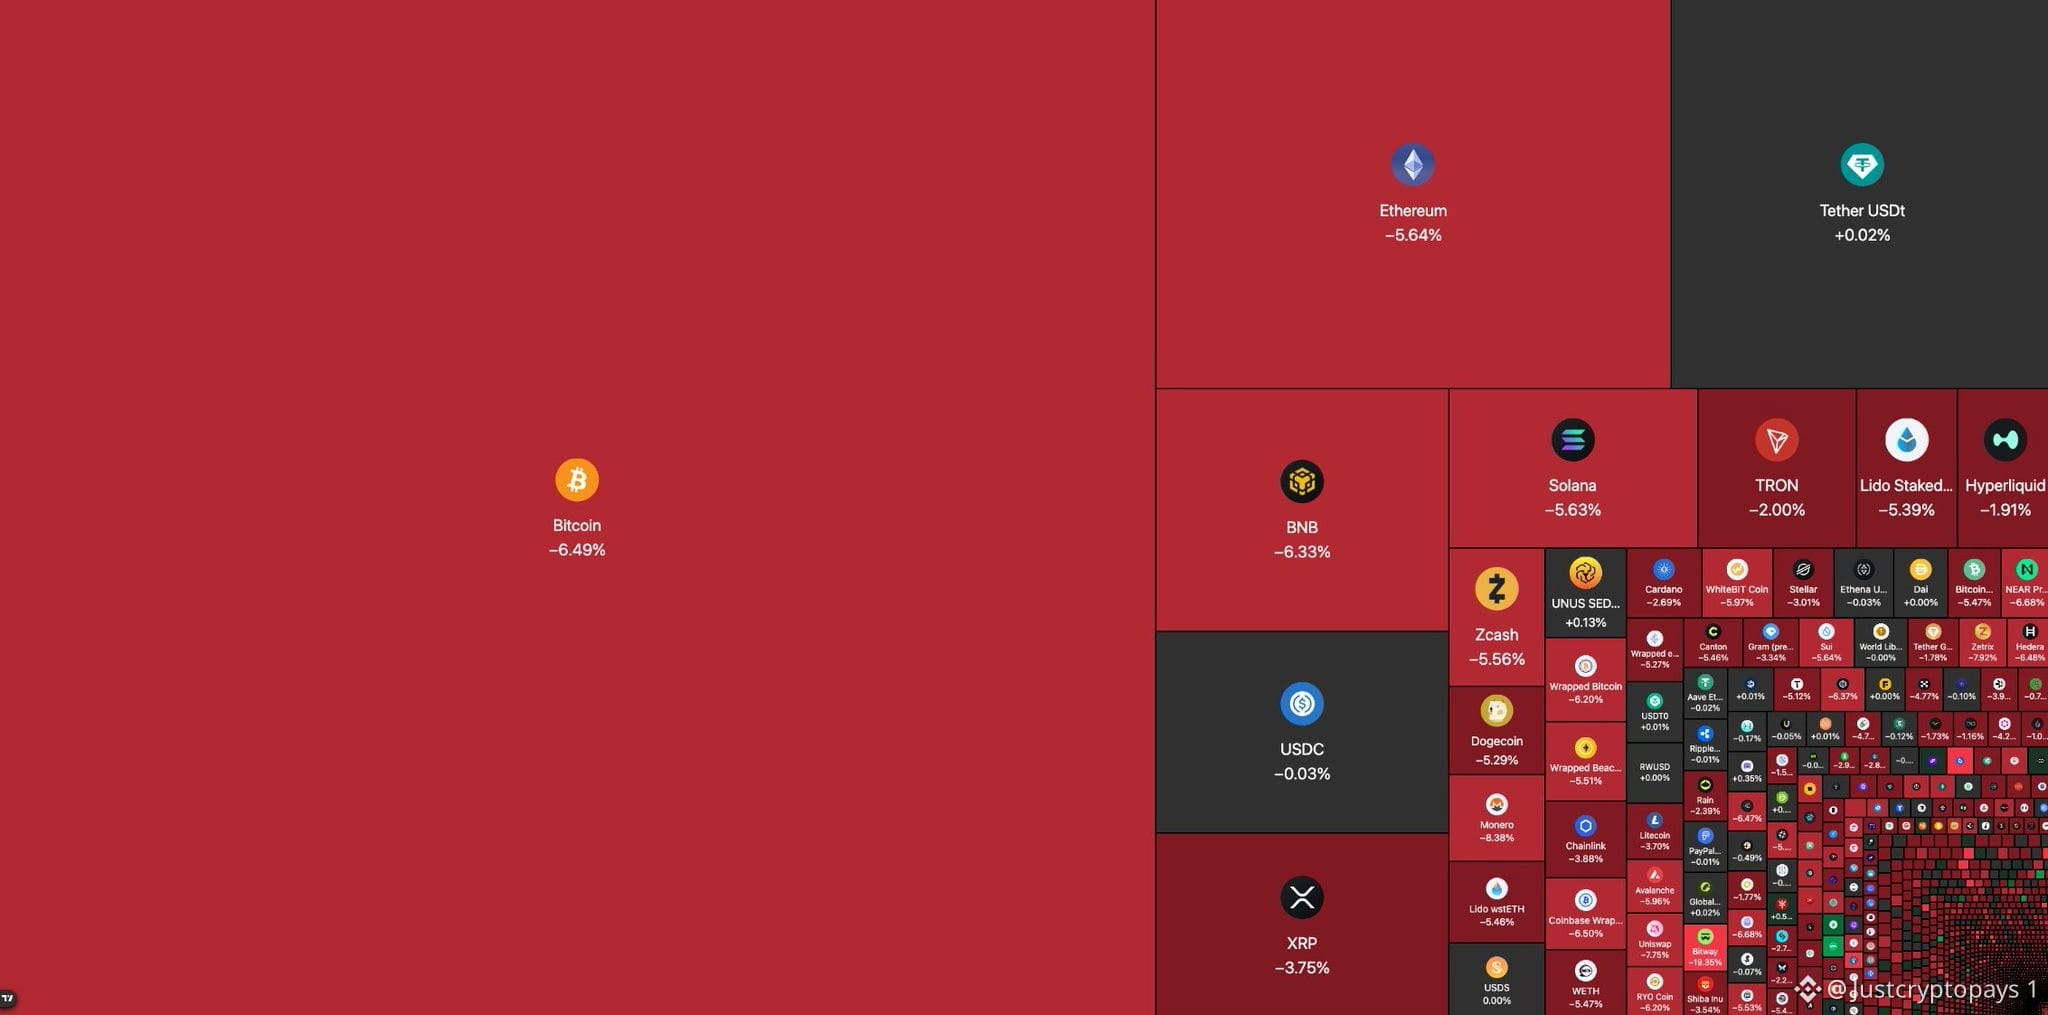
🚨 تمت تصفية مراكز في العملات المشفرة بأكثر من 440 مليون دولار خلال الساعة الماضية، مع تعرض السوق لضغوط بيع شديدة، وشملت 417 مليون دولار مراكز شراء. هبط $BTC إلى ما دون 69 ألف دولار. وانخفض $ETH إلى أقل من 1,950 دولارًا. وتراجع SOL إلى 78 دولارًا. #تحليل_سعر_BTC# #إيثيريوم
🚨 تمت تصفية مراكز في العملات المشفرة بأكثر من 440 مليون دولار خلال الساعة الماضية، مع تعرض السوق لضغوط بيع شديدة، وشملت 417 مليون دولار مراكز شراء. هبط $BTC إلى ما دون 69 ألف دولار. وانخفض $ETH إلى أقل من 1,950 دولارًا. وتراجع SOL إلى 78 دولارًا. #تحليل_سعر_BTC# #إيثيريوم
53
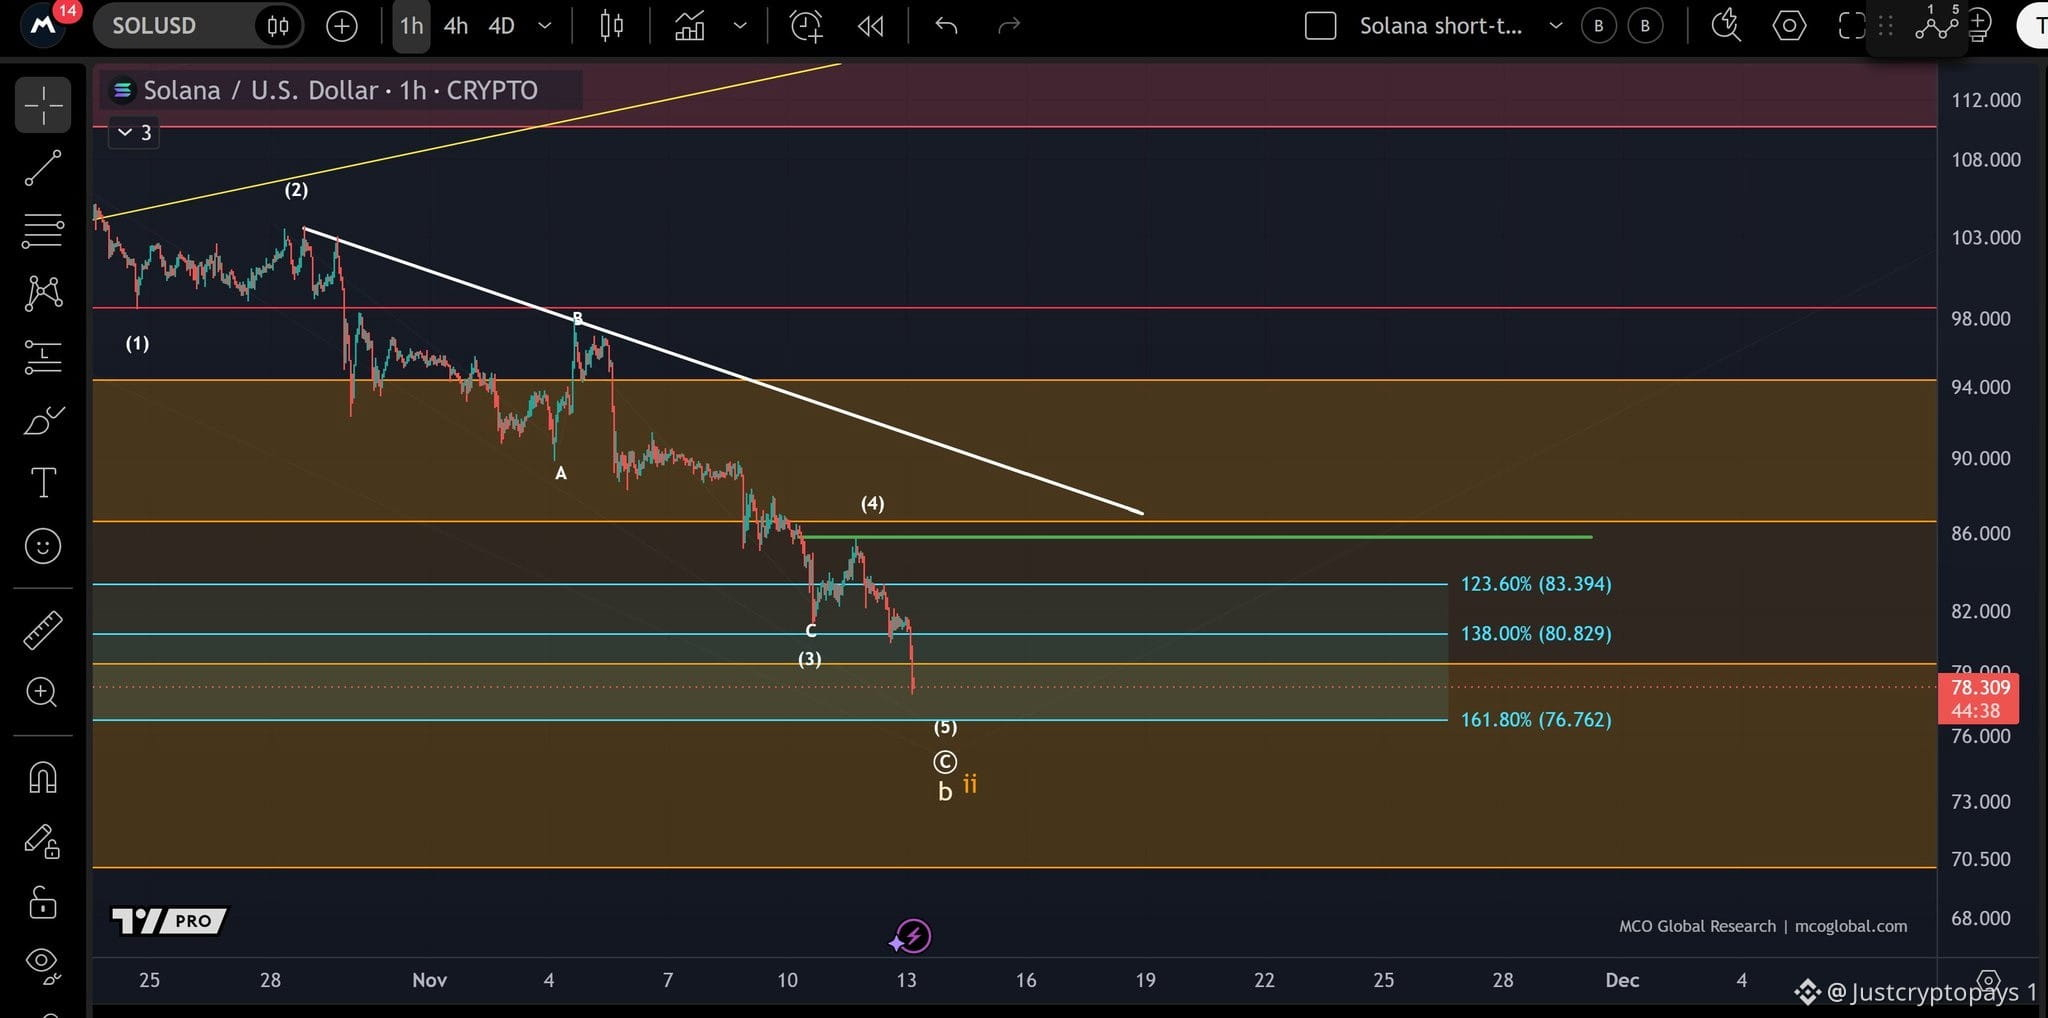
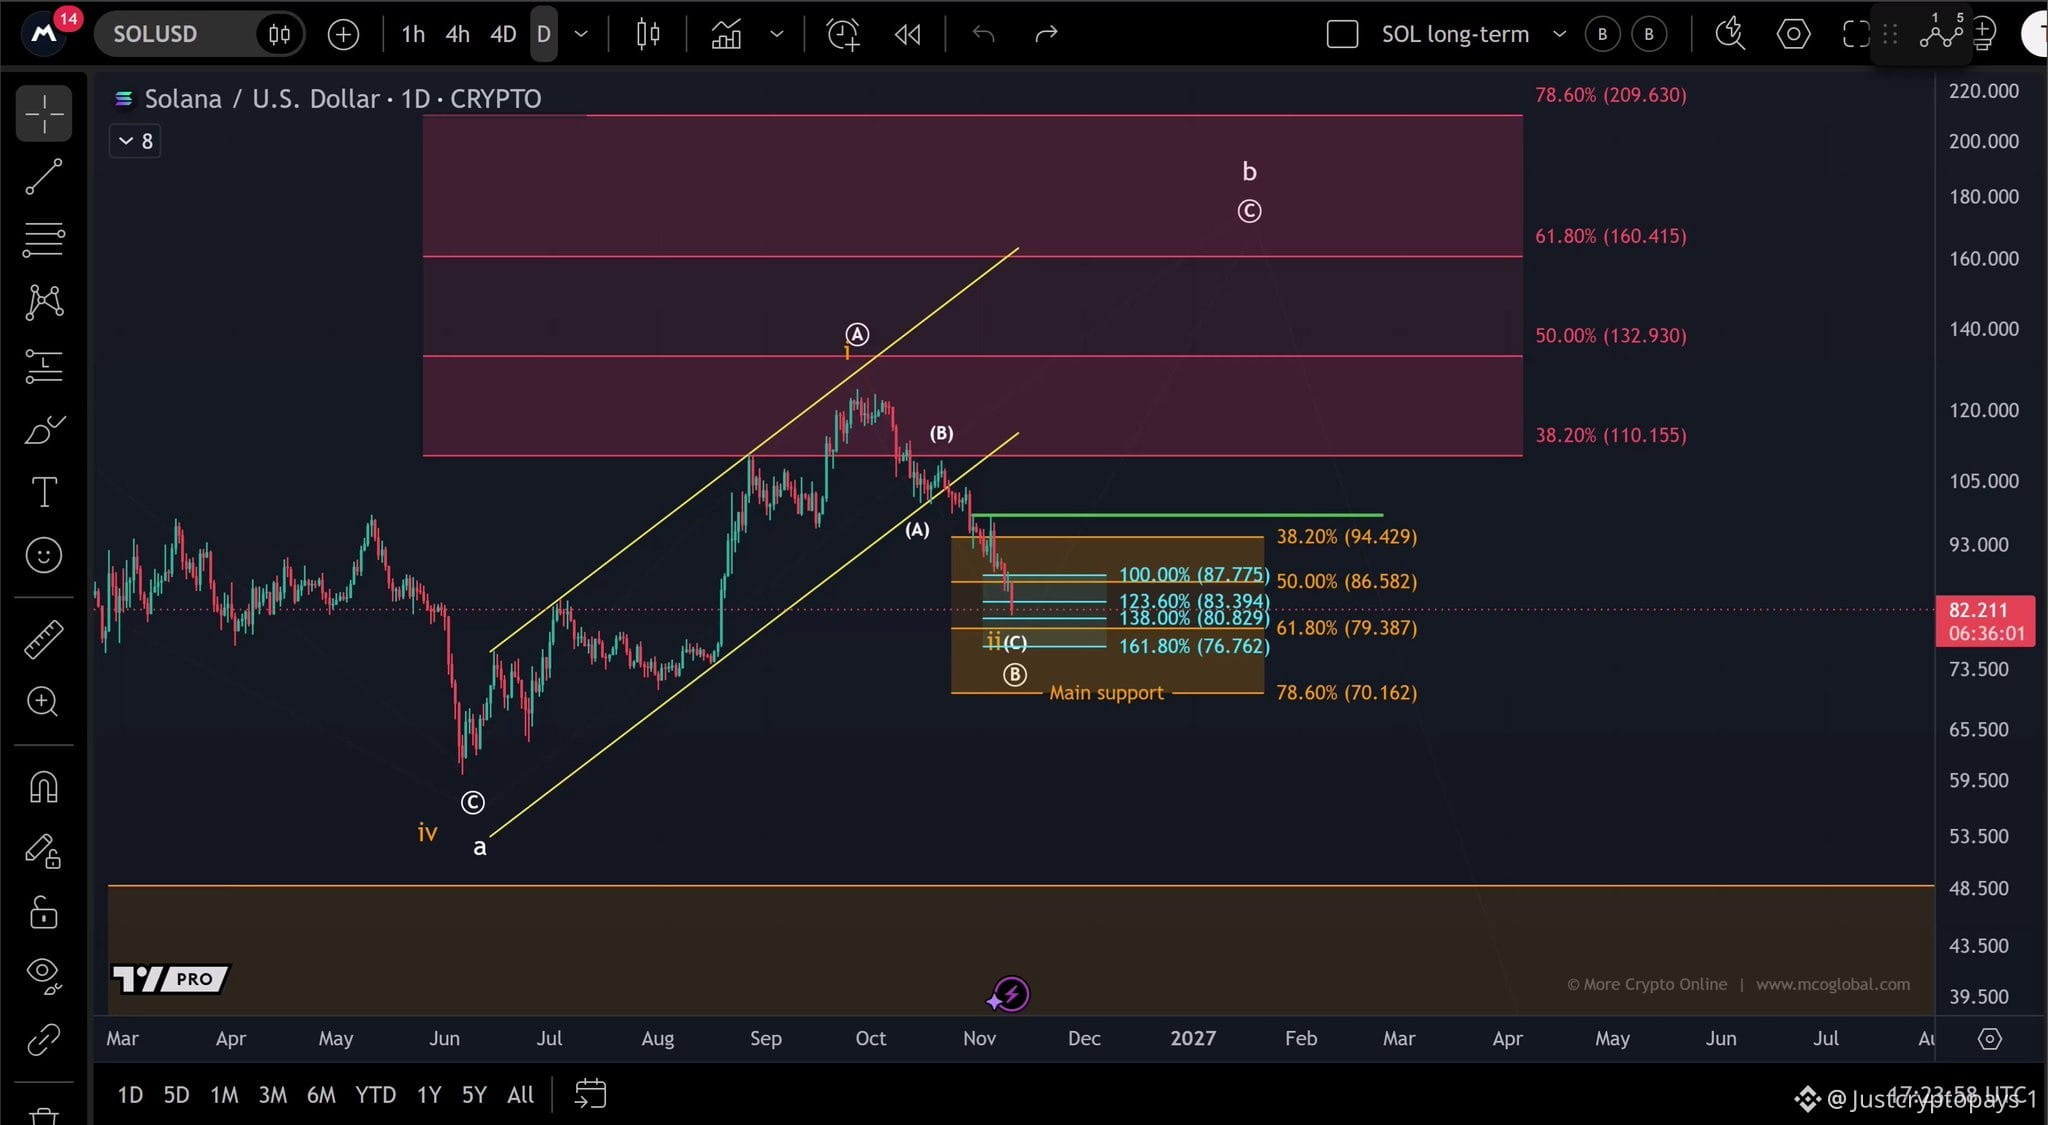
يواصل $SOL التراجع، متبعًا اتجاه Bitcoin، دون أي علامة واضحة على بلوغ القاع حتى الآن. يقع مستوى الدعم التالي عند $76.76، يليه $70 إذا استمر الهبوط. أما في الاتجاه الصعودي، فالمقاومة التالية التي تجب مراقبتها عند $85.80. #Solana #SolanaETF
يواصل $SOL التراجع، متبعًا اتجاه Bitcoin، دون أي علامة واضحة على بلوغ القاع حتى الآن. يقع مستوى الدعم التالي عند $76.76، يليه $70 إذا استمر الهبوط. أما في الاتجاه الصعودي، فالمقاومة التالية التي تجب مراقبتها عند $85.80. #Solana #SolanaETF
66
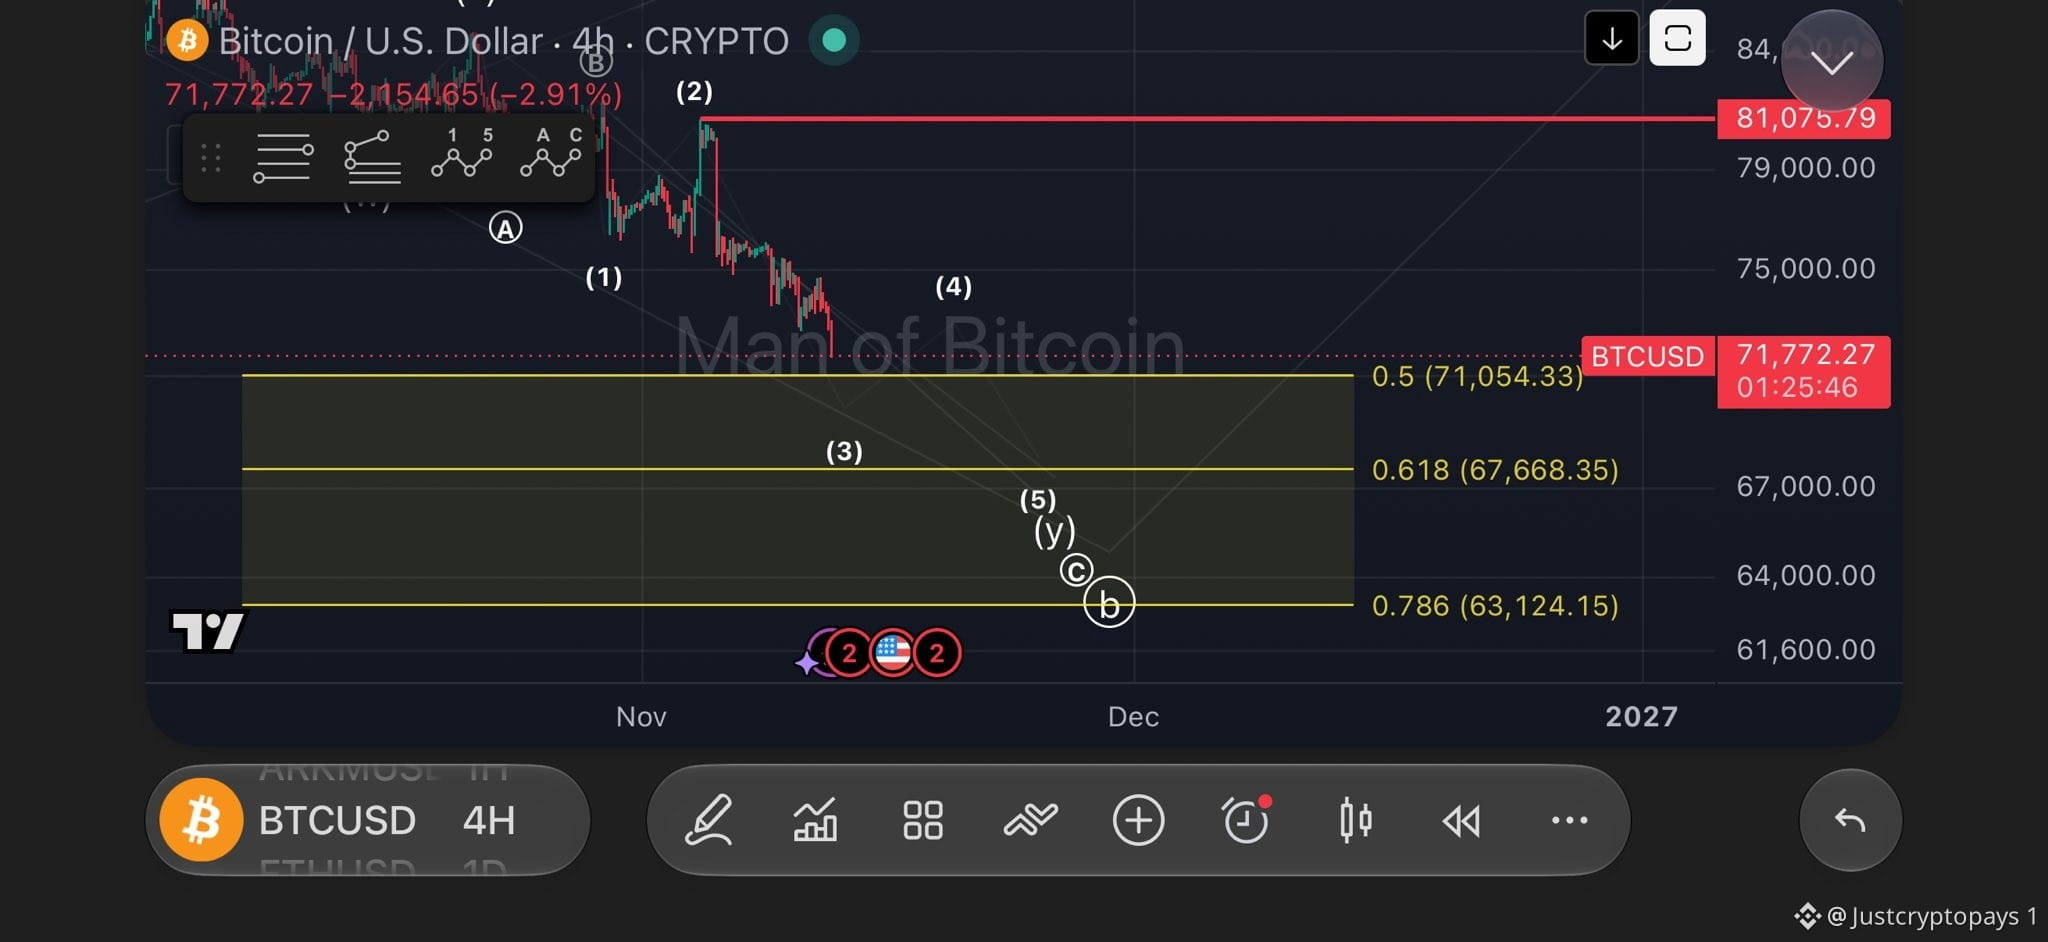
$BTC: لا يزال ضغط البيع قويًا، ويُعدّ مستوى $71,054 الهدف الهبوطي التالي. ومن الناحية المثالية، قد يواصل السعر انخفاضه إلى نطاق $67,668–$63,124. #تحليل_سعر_BTC# #بيتكوين
$BTC: لا يزال ضغط البيع قويًا، ويُعدّ مستوى $71,054 الهدف الهبوطي التالي. ومن الناحية المثالية، قد يواصل السعر انخفاضه إلى نطاق $67,668–$63,124. #تحليل_سعر_BTC# #بيتكوين
56
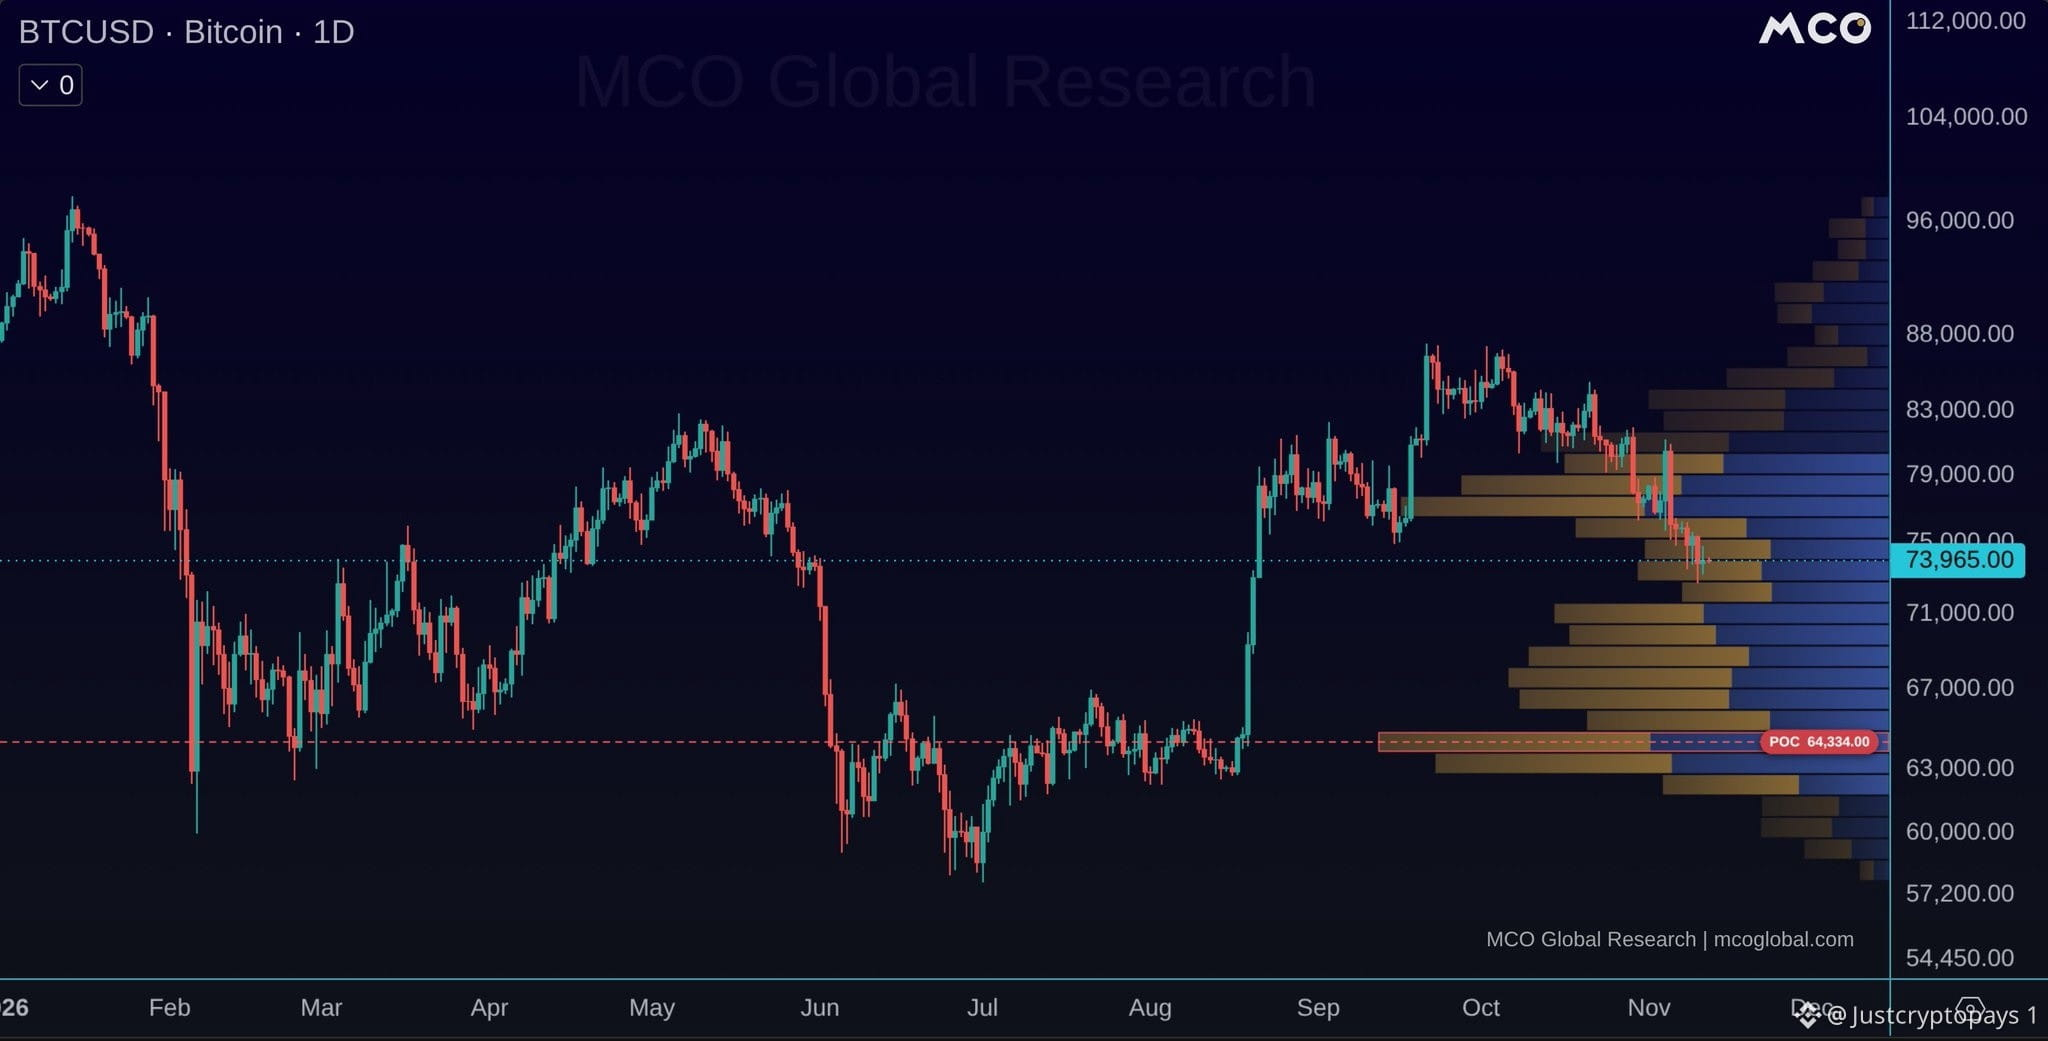
$BTC جرى تداول نحو 46% من حجم تداول بيتكوين هذا العام بين 63,300 و74,800 دولار، ويتداول السعر الآن ضمن هذا النطاق. يقع مستوى السعر ذي أعلى حجم تداول لعام 2026 عند نحو 64,300 دولار، ما يجعله منطقة مهمة لمتابعتها. في المقابل، حجم التداول ضعيف نسبيًا بين 71,600 و75,200 دولار، ما يعني محدودية النشاط التاريخي للتداول الذي يمكن أن يوفر دعمًا في تلك المنطقة. #تحليل_سعر_BTC# #بيتكوين
$BTC جرى تداول نحو 46% من حجم تداول بيتكوين هذا العام بين 63,300 و74,800 دولار، ويتداول السعر الآن ضمن هذا النطاق. يقع مستوى السعر ذي أعلى حجم تداول لعام 2026 عند نحو 64,300 دولار، ما يجعله منطقة مهمة لمتابعتها. في المقابل، حجم التداول ضعيف نسبيًا بين 71,600 و75,200 دولار، ما يعني محدودية النشاط التاريخي للتداول الذي يمكن أن يوفر دعمًا في تلك المنطقة. #تحليل_سعر_BTC# #بيتكوين
78
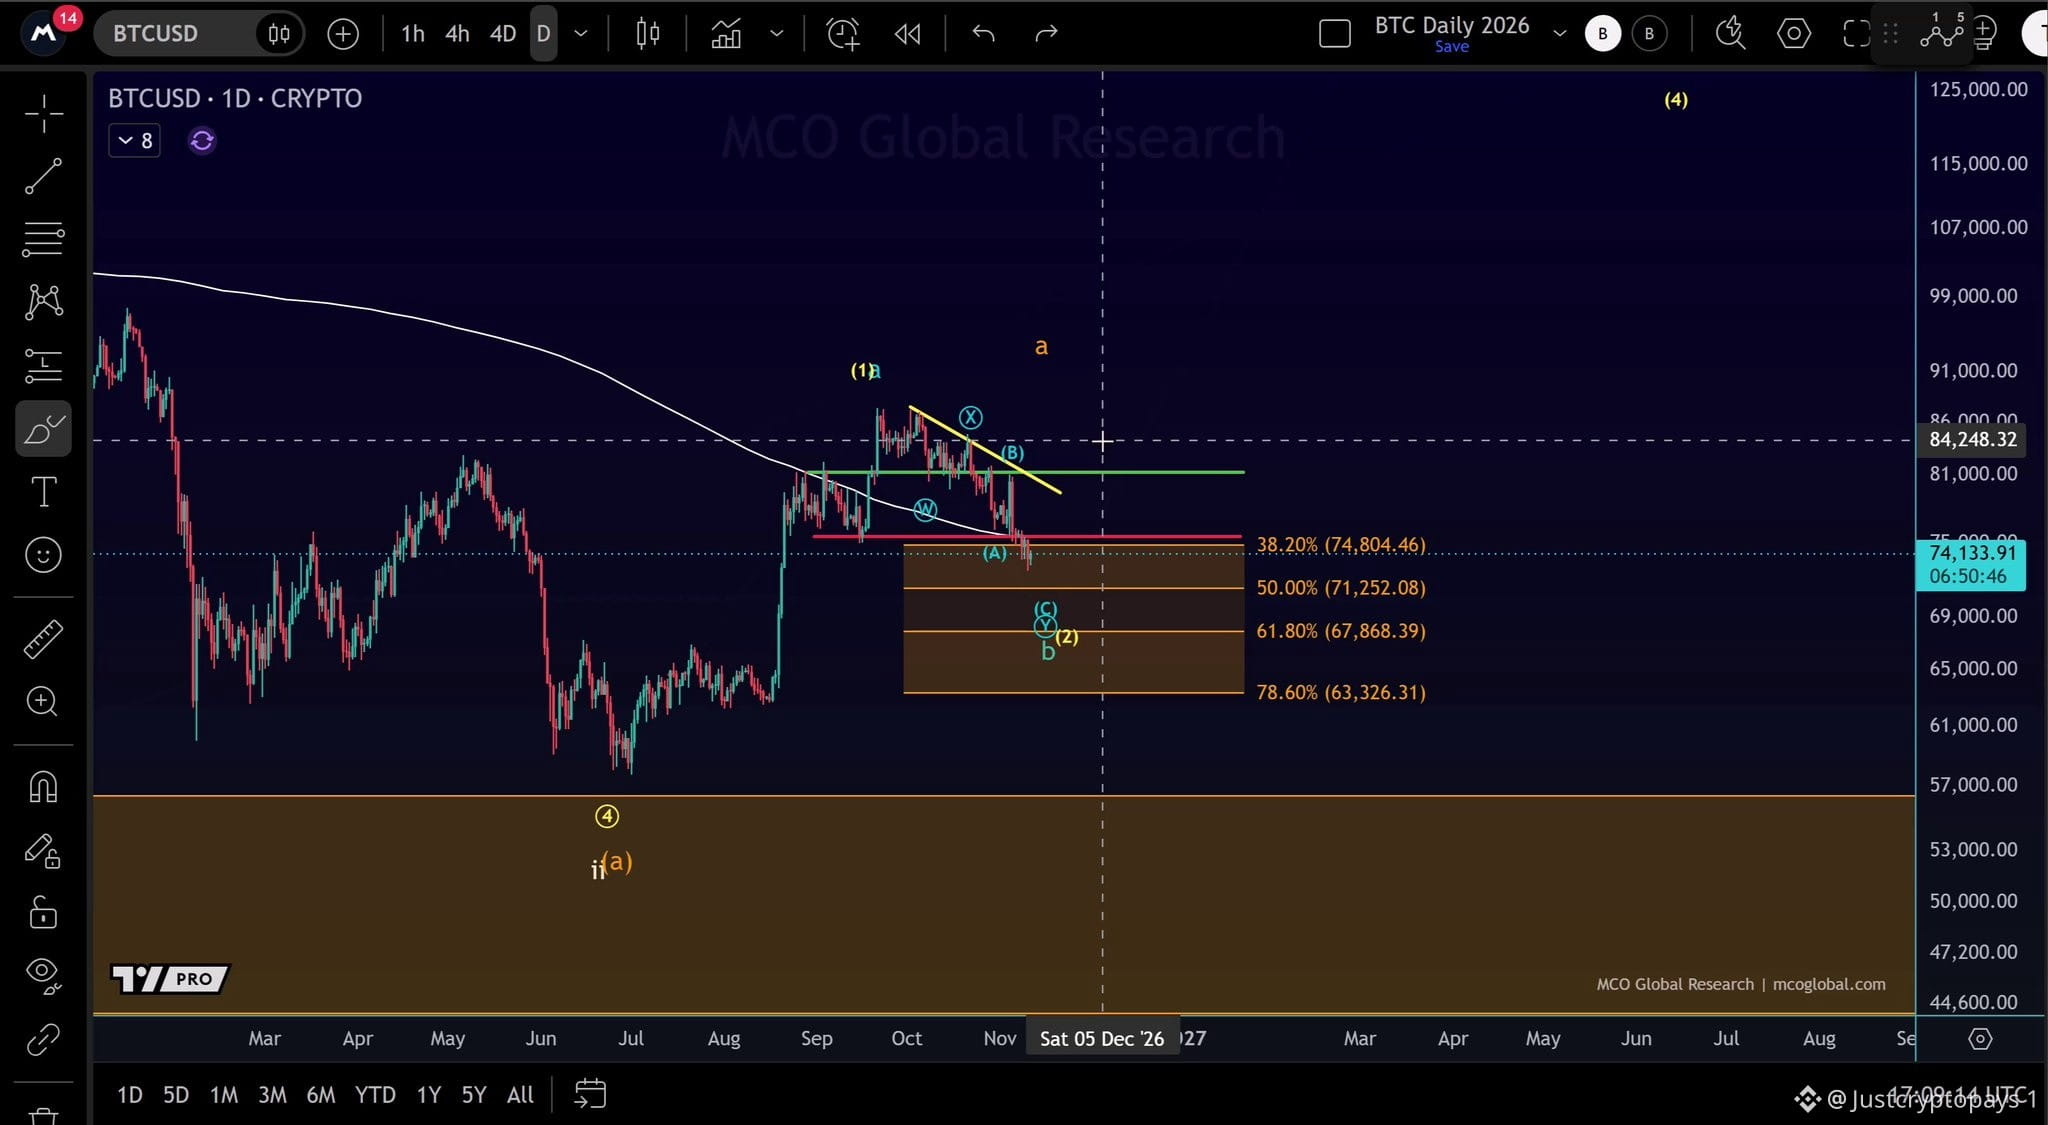
لا يزال $BTC تحت ضغط البيع، ويتداول دون المتوسط المتحرك البسيط لـ50 أسبوعًا، قرب 75,500 دولار، ودون الخط الأحمر الذي شكّل دعمًا في السابق. على الرسم البياني اليومي، يبدو أن الارتفاع من قاع يوليو قد تطوّر في خمس موجات، ما يشير إلى أن التراجع الحالي مرحلة تصحيحية ضمن تعافٍ أوسع. ما دامت منطقة الدعم بين 63,326 و74,804 دولارًا صامدة، وشكّل السعر اندفاعًا صعوديًا أوليًا، يظل التحرك نحو 100,000 دولار احتمالًا قائمًا. #تحليل_سعر_BTC# #بيتكوين
لا يزال $BTC تحت ضغط البيع، ويتداول دون المتوسط المتحرك البسيط لـ50 أسبوعًا، قرب 75,500 دولار، ودون الخط الأحمر الذي شكّل دعمًا في السابق. على الرسم البياني اليومي، يبدو أن الارتفاع من قاع يوليو قد تطوّر في خمس موجات، ما يشير إلى أن التراجع الحالي مرحلة تصحيحية ضمن تعافٍ أوسع. ما دامت منطقة الدعم بين 63,326 و74,804 دولارًا صامدة، وشكّل السعر اندفاعًا صعوديًا أوليًا، يظل التحرك نحو 100,000 دولار احتمالًا قائمًا. #تحليل_سعر_BTC# #بيتكوين
46
🇺🇸 سجلت صناديق ETF الفورية لـ $BTC و$ETH وXRP جميعها صافي تدفقات خارجة في 10 نوفمبر. - BTC: تدفقات خارجة بقيمة 95.00 مليون دولار - ETH: تدفقات خارجة بقيمة 1.32 مليون دولار - XRP: تدفقات خارجة بقيمة 7.62 مليون دولار كانت التدفقات المؤسسية سلبية للأصول الثلاثة. #تحليل_سعر_BTC# #إيثيريوم
🇺🇸 سجلت صناديق ETF الفورية لـ $BTC و$ETH وXRP جميعها صافي تدفقات خارجة في 10 نوفمبر. - BTC: تدفقات خارجة بقيمة 95.00 مليون دولار - ETH: تدفقات خارجة بقيمة 1.32 مليون دولار - XRP: تدفقات خارجة بقيمة 7.62 مليون دولار كانت التدفقات المؤسسية سلبية للأصول الثلاثة. #تحليل_سعر_BTC# #إيثيريوم
59
يقترب $SOL من مستوى تصحيح فيبوناتشي 61.8% عند 79.38 دولارًا، وهو ضمن نطاق الهدف الأوسع الممتد من 76.76 إلى 87.77 دولارًا. تواصل سولانا تتبّع تحركات سعر بيتكوين، ولا يزال المزيد من الهبوط ممكنًا، إذ يُتوقع أيضًا أن يتحرك BTC نحو مستويات أدنى. وظلت النظرة قصيرة الأجل هبوطية خلال الأسابيع القليلة الماضية. ومع ذلك، لا تزال الصورة الأكبر تتيح مجالًا لتعافٍ أقوى في الموجة C الدائرية من الموجة b، بمجرد اكتمال الموجة B الدائرية. #Solana #SolanaETF
يقترب $SOL من مستوى تصحيح فيبوناتشي 61.8% عند 79.38 دولارًا، وهو ضمن نطاق الهدف الأوسع الممتد من 76.76 إلى 87.77 دولارًا. تواصل سولانا تتبّع تحركات سعر بيتكوين، ولا يزال المزيد من الهبوط ممكنًا، إذ يُتوقع أيضًا أن يتحرك BTC نحو مستويات أدنى. وظلت النظرة قصيرة الأجل هبوطية خلال الأسابيع القليلة الماضية. ومع ذلك، لا تزال الصورة الأكبر تتيح مجالًا لتعافٍ أقوى في الموجة C الدائرية من الموجة b، بمجرد اكتمال الموجة B الدائرية. #Solana #SolanaETF
67
🇺🇸 تحولت تدفقات صناديق ETF الفورية إلى السلبية الأسبوع الماضي، مع تسجيل BTC وETH و$SOL و$XRP جميعها صافي تدفقات خارجة. BTC: -$1.28B ETH: -$365.28M SOL: -$26.25M XRP: -$529.51K وسجلت بيتكوين وإيثيريوم أكبر عمليات السحب، ما يشير إلى ضعف الطلب المؤسسي في السوق. #SolanaETF #XRPETF
🇺🇸 تحولت تدفقات صناديق ETF الفورية إلى السلبية الأسبوع الماضي، مع تسجيل BTC وETH و$SOL و$XRP جميعها صافي تدفقات خارجة. BTC: -$1.28B ETH: -$365.28M SOL: -$26.25M XRP: -$529.51K وسجلت بيتكوين وإيثيريوم أكبر عمليات السحب، ما يشير إلى ضعف الطلب المؤسسي في السوق. #SolanaETF #XRPETF
44
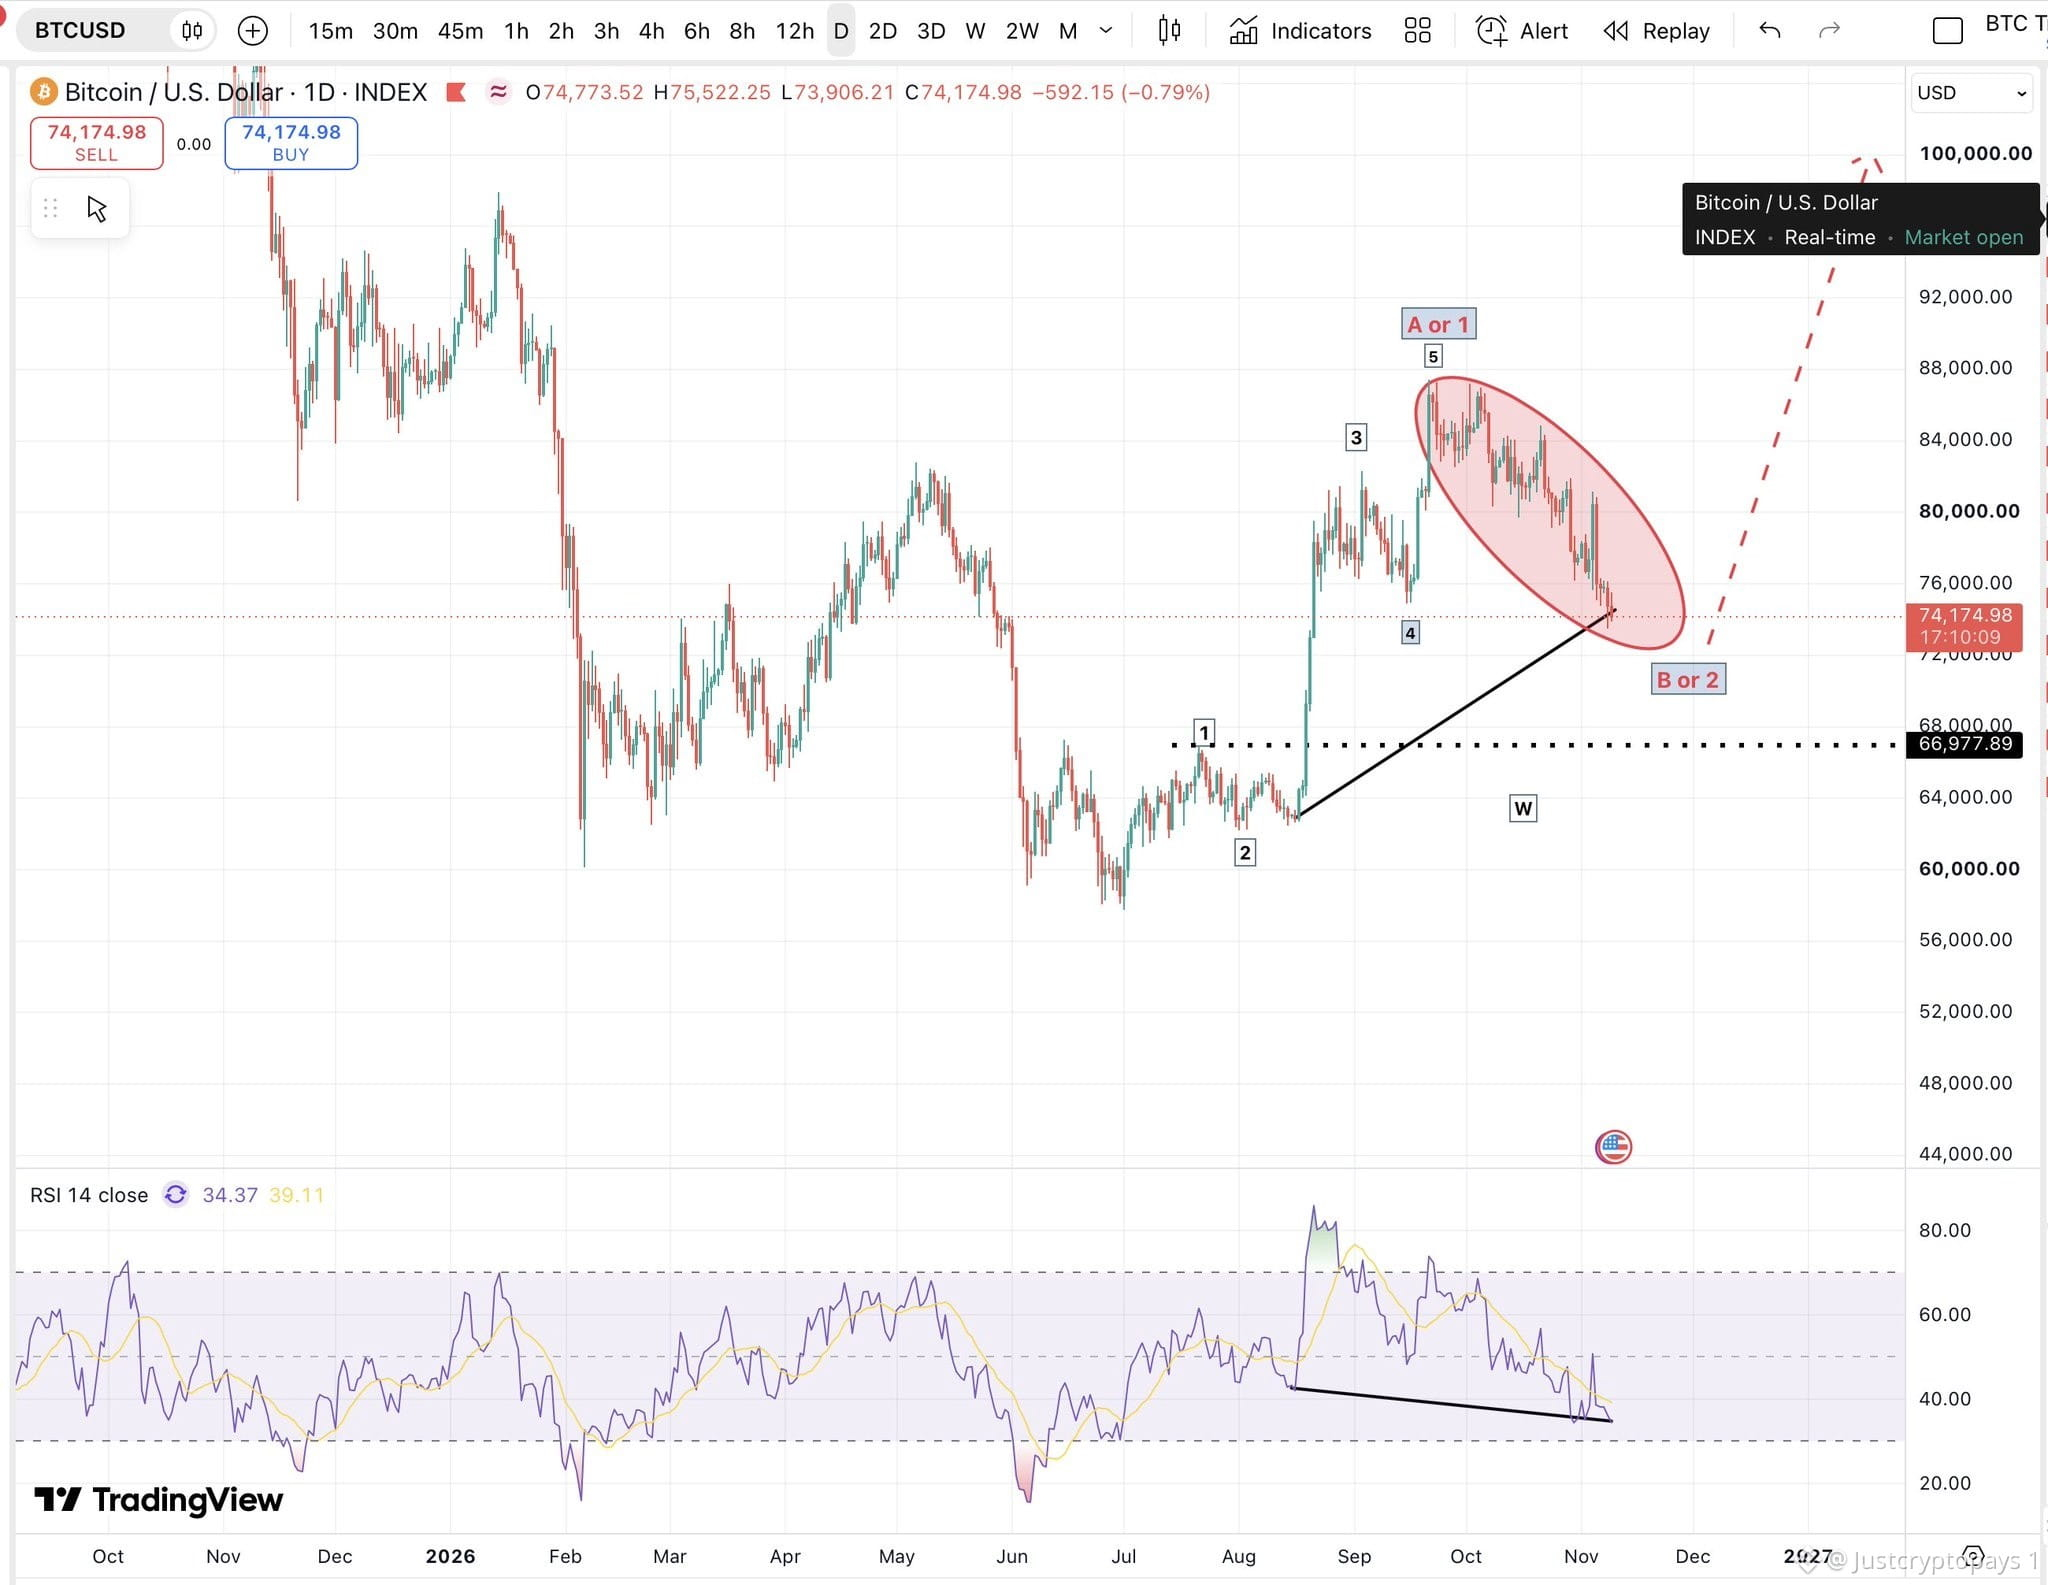
ربما يكون $BTC قد أكمل بالفعل حركته الصاعدة ذات الموجات الخمس وصولًا إلى قمة سبتمبر. إذا كان هذا الترقيم صحيحًا، فقد يمثّل الارتفاع الموجة A أو الموجة 1. لا يزال التراجع الحالي يبدو تصحيحيًا لا اندفاعيًا. بعد اكتمال هذا التصحيح، سأترقب حركة صعود أخرى، قد تكون الموجة C أو الموجة 3. في الوقت الحالي، ينصب التركيز على انتظار تأكيد السعر لتشكّل قاع قبل التفكير في الحركة التالية. #تحليل_سعر_BTC# #بيتكوين#
ربما يكون $BTC قد أكمل بالفعل حركته الصاعدة ذات الموجات الخمس وصولًا إلى قمة سبتمبر. إذا كان هذا الترقيم صحيحًا، فقد يمثّل الارتفاع الموجة A أو الموجة 1. لا يزال التراجع الحالي يبدو تصحيحيًا لا اندفاعيًا. بعد اكتمال هذا التصحيح، سأترقب حركة صعود أخرى، قد تكون الموجة C أو الموجة 3. في الوقت الحالي، ينصب التركيز على انتظار تأكيد السعر لتشكّل قاع قبل التفكير في الحركة التالية. #تحليل_سعر_BTC# #بيتكوين#
63
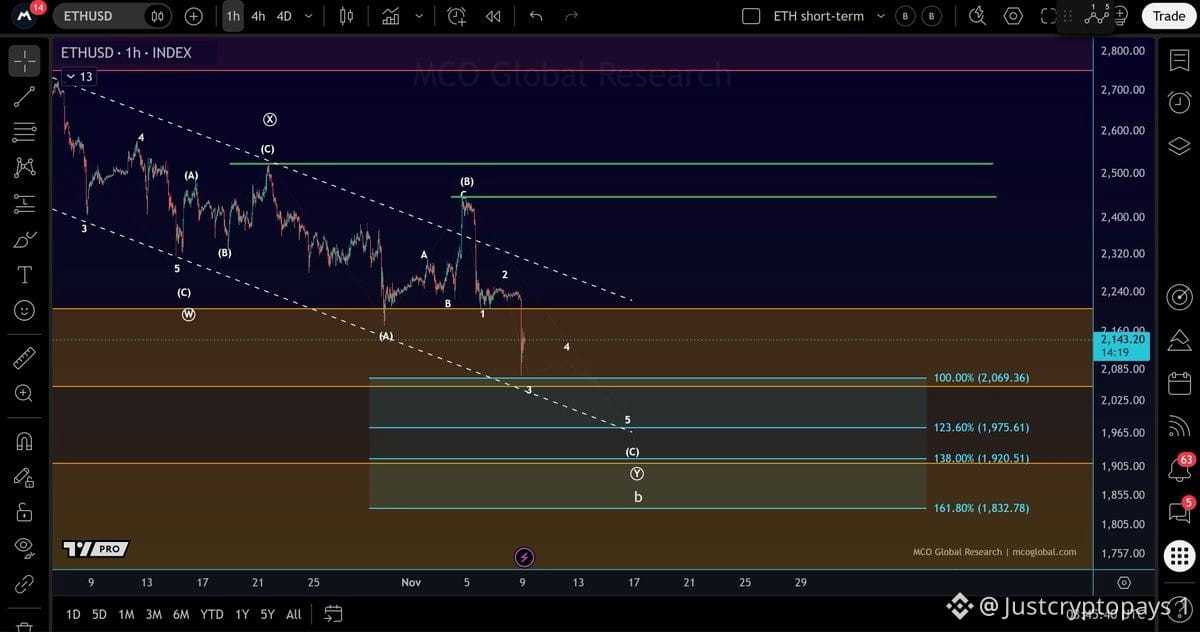
كانت الموجة 2 ضعيفة بشكل غير معتاد، وقد تكون الموجة 3 الهابطة قد بدأت الآن. دخل السعر منطقة الهدف الزرقاء بين $1,832 و$2,069. وستكون أول إشارة إلى احتمال تشكّل قاع هي اختراق الحد العلوي للقناة أو التحرك فوق آخر قمة تأرجحية عند $2,255. #ETH #Ethereum
كانت الموجة 2 ضعيفة بشكل غير معتاد، وقد تكون الموجة 3 الهابطة قد بدأت الآن. دخل السعر منطقة الهدف الزرقاء بين $1,832 و$2,069. وستكون أول إشارة إلى احتمال تشكّل قاع هي اختراق الحد العلوي للقناة أو التحرك فوق آخر قمة تأرجحية عند $2,255. #ETH #Ethereum
64
🔥 فعّلت $ZEC ترقية NU7 على الشبكة الرئيسية، مقدّمةً آلية جديدة لاستدامة الشبكة. وبموجب هذا التغيير، ستُسحب 60% من رسوم المعاملات من التداول، ثم يُعاد توزيعها لاحقًا عبر مكافآت الكتل المستقبلية. #رؤى_ماكرو# #موسم_العملات_البديلة#
🔥 فعّلت $ZEC ترقية NU7 على الشبكة الرئيسية، مقدّمةً آلية جديدة لاستدامة الشبكة. وبموجب هذا التغيير، ستُسحب 60% من رسوم المعاملات من التداول، ثم يُعاد توزيعها لاحقًا عبر مكافآت الكتل المستقبلية. #رؤى_ماكرو# #موسم_العملات_البديلة#
71
سجّل الدخول لاستكشاف المزيد من المُحتوى
انضم إلى مُستخدمي العملات الرقمية حول العالم على Binance Square
⚡️ احصل على أحدث المعلومات المفيدة عن العملات الرقمية.
💬 موثوقة من قبل أكبر منصّة لتداول العملات الرقمية في العالم.
👍 اكتشف الرؤى الحقيقية من صنّاع المُحتوى الموثوقين.
البريد الإلكتروني / رقم الهاتف
المواضيع الرائجة
NvidiaBeatsEstimatesAICloudStocksRiseAfterHours
2,508 مشاهدات
52 يقومون بالنقاش
إنفيديا تتجاوز التوقعات بإيرادات قدرها 115.8 مليار دولار، وتتوقع 130 مليار دولار وتضيف 150 مليار دولار إلى برنامج إعادة شراء الأسهم
Binance News
·3 إعجاب
·5.6k مشاهدات
A Packed Week of Earnings and Data Tests Markets
150,239 مشاهدات
665 يقومون بالنقاش
AnthropicIPOTestsInvestorAppetiteForAI
331,998 مشاهدات
2,910 يقومون بالنقاش