

CryptoZeno 1
406 منشورات

CryptoZeno 1
إبلاغ
حظر المُستخدم
Featured Creator on #CoinMarketCap #BinanceSquare and #CryptoQuant | On Chain Research and Market Insights
0 تتابع
8 المتابعون
19 إعجاب
منشورات
·
--
عرض الترجمة
Bitcoin Is Reclaiming Momentum While Long-Term Holders Tighten Supply
$BTC
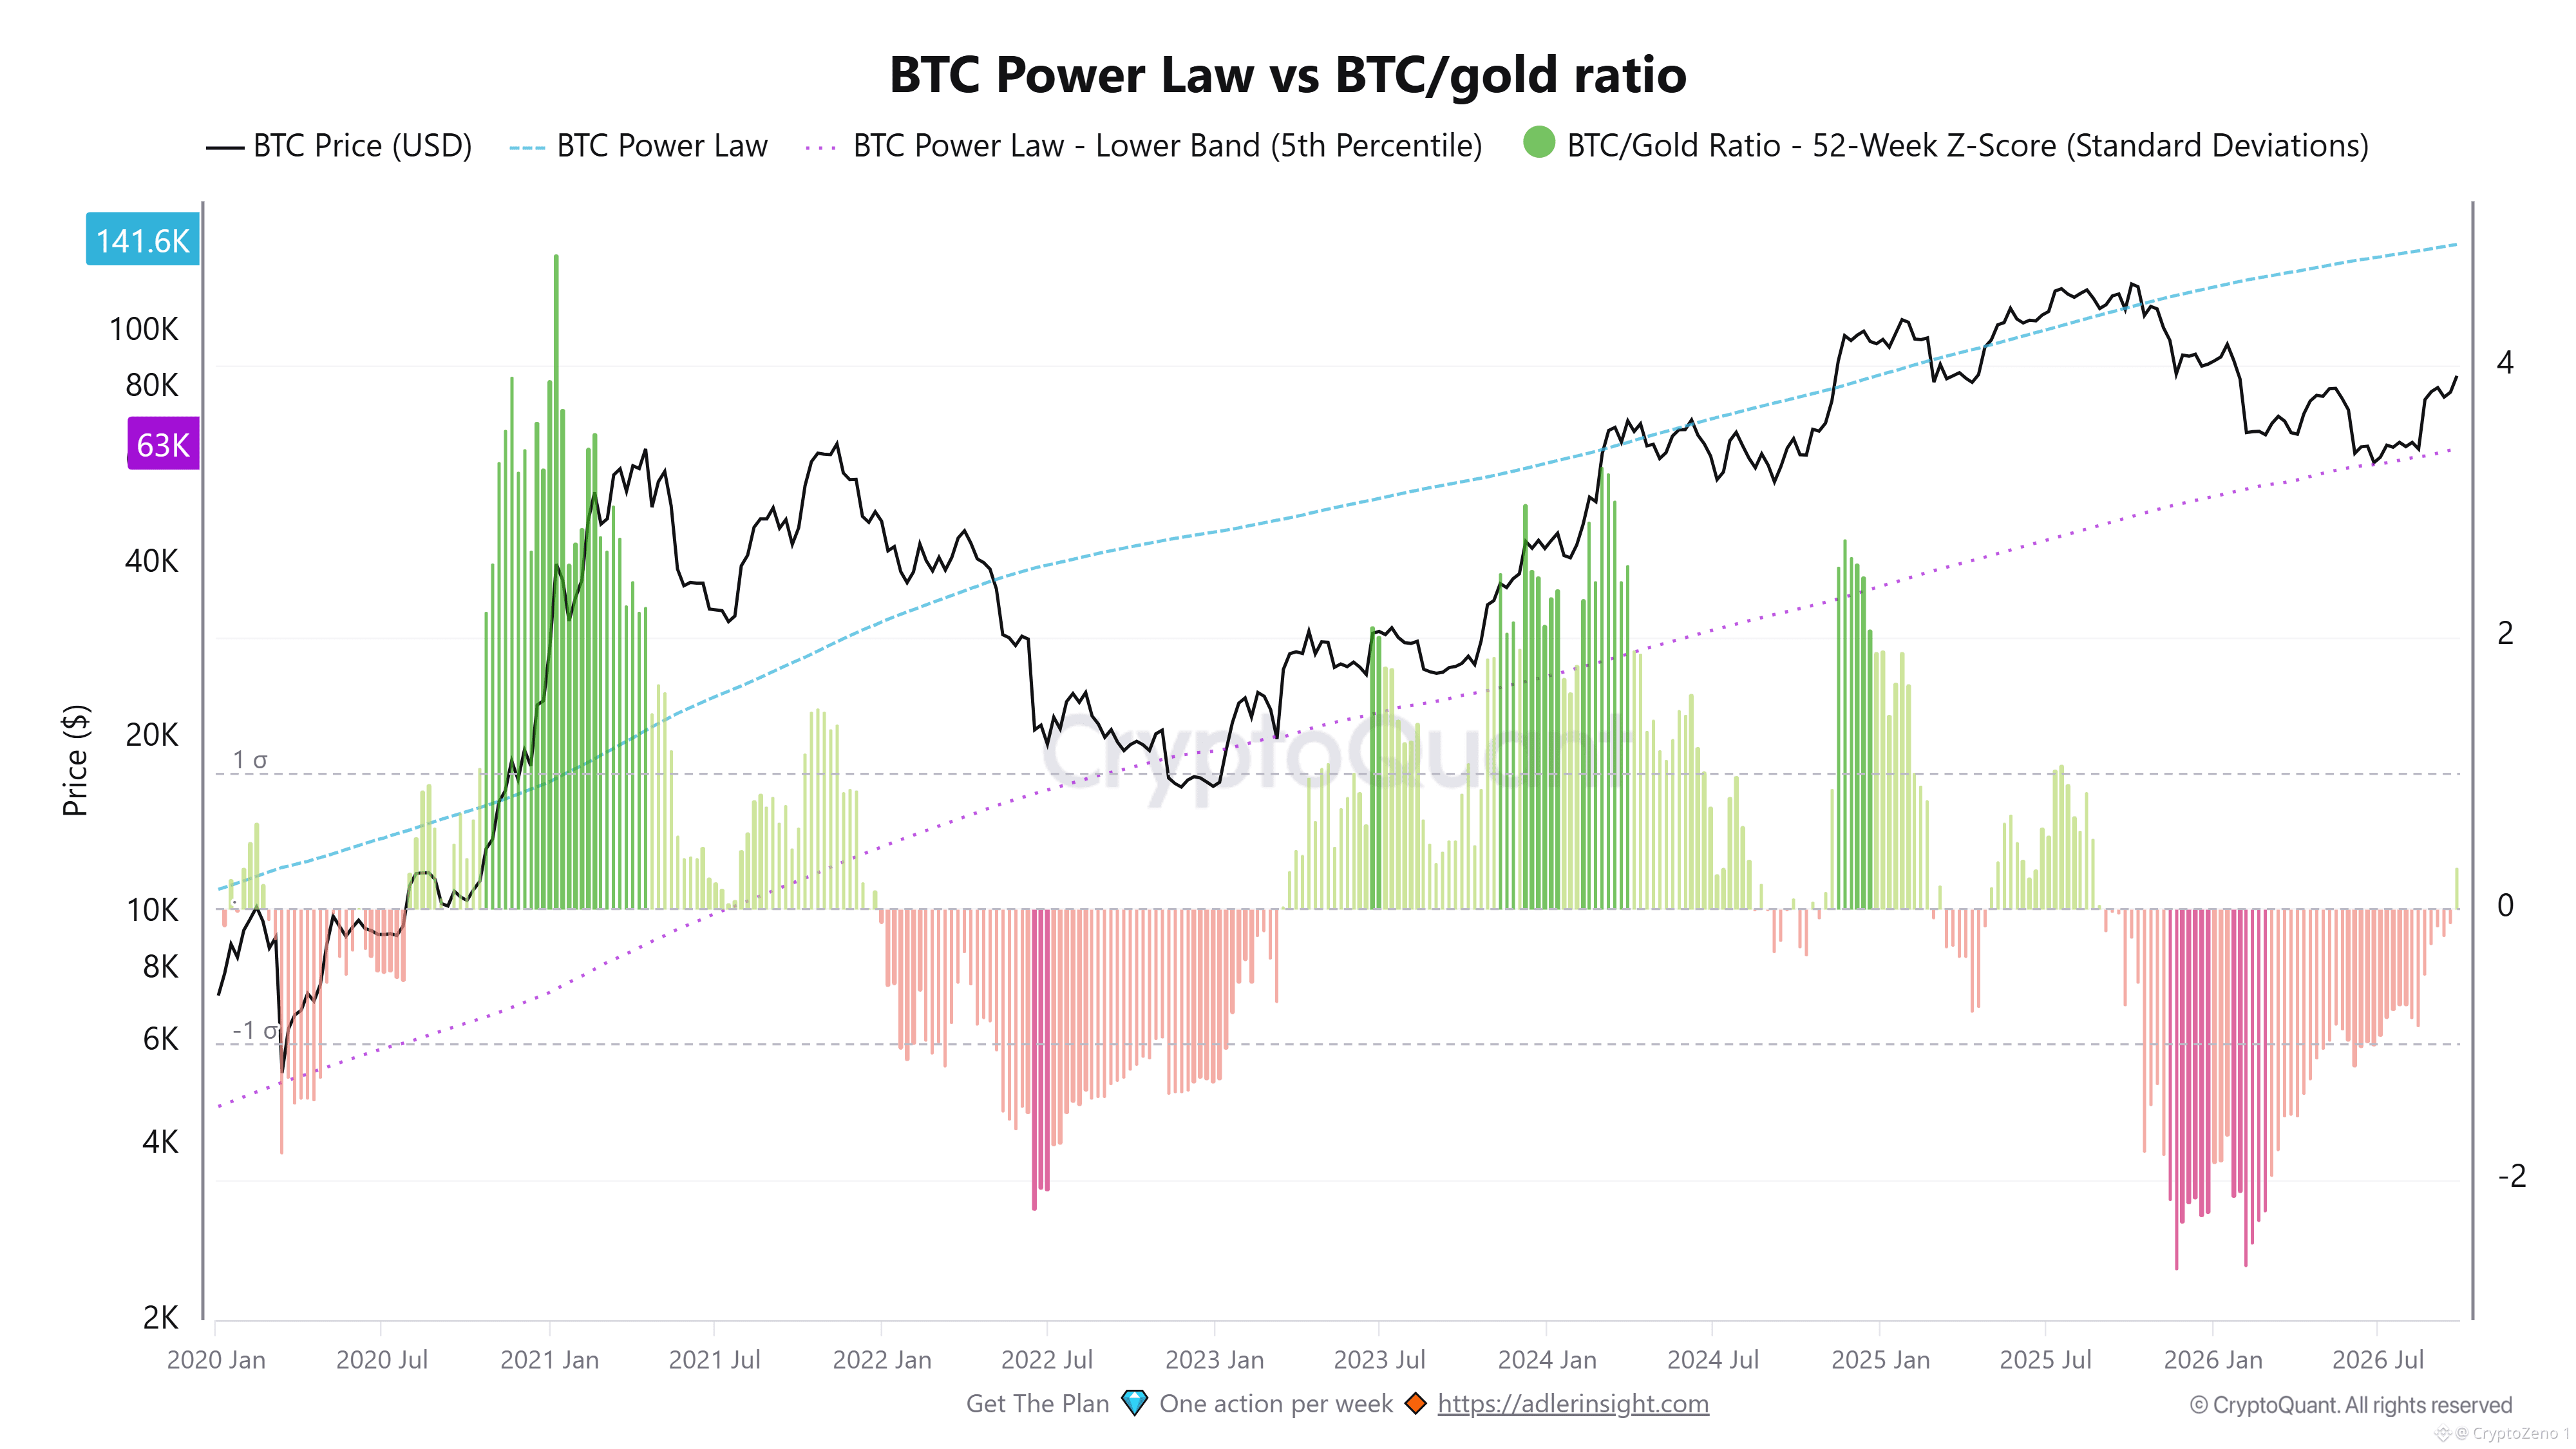
is currently trading around $83K, still well above the Power Law lower band near $63K but below the model trend around $140K. This places BTC in a structurally supported valuation zone rather than an extreme overvaluation regime. The BTC/Gold 52-week Z-Score also remains deeply depressed after a prolonged negative period, showing that Bitcoin has significantly underperformed gold on a relative basis and has not yet returned to historical extremes.
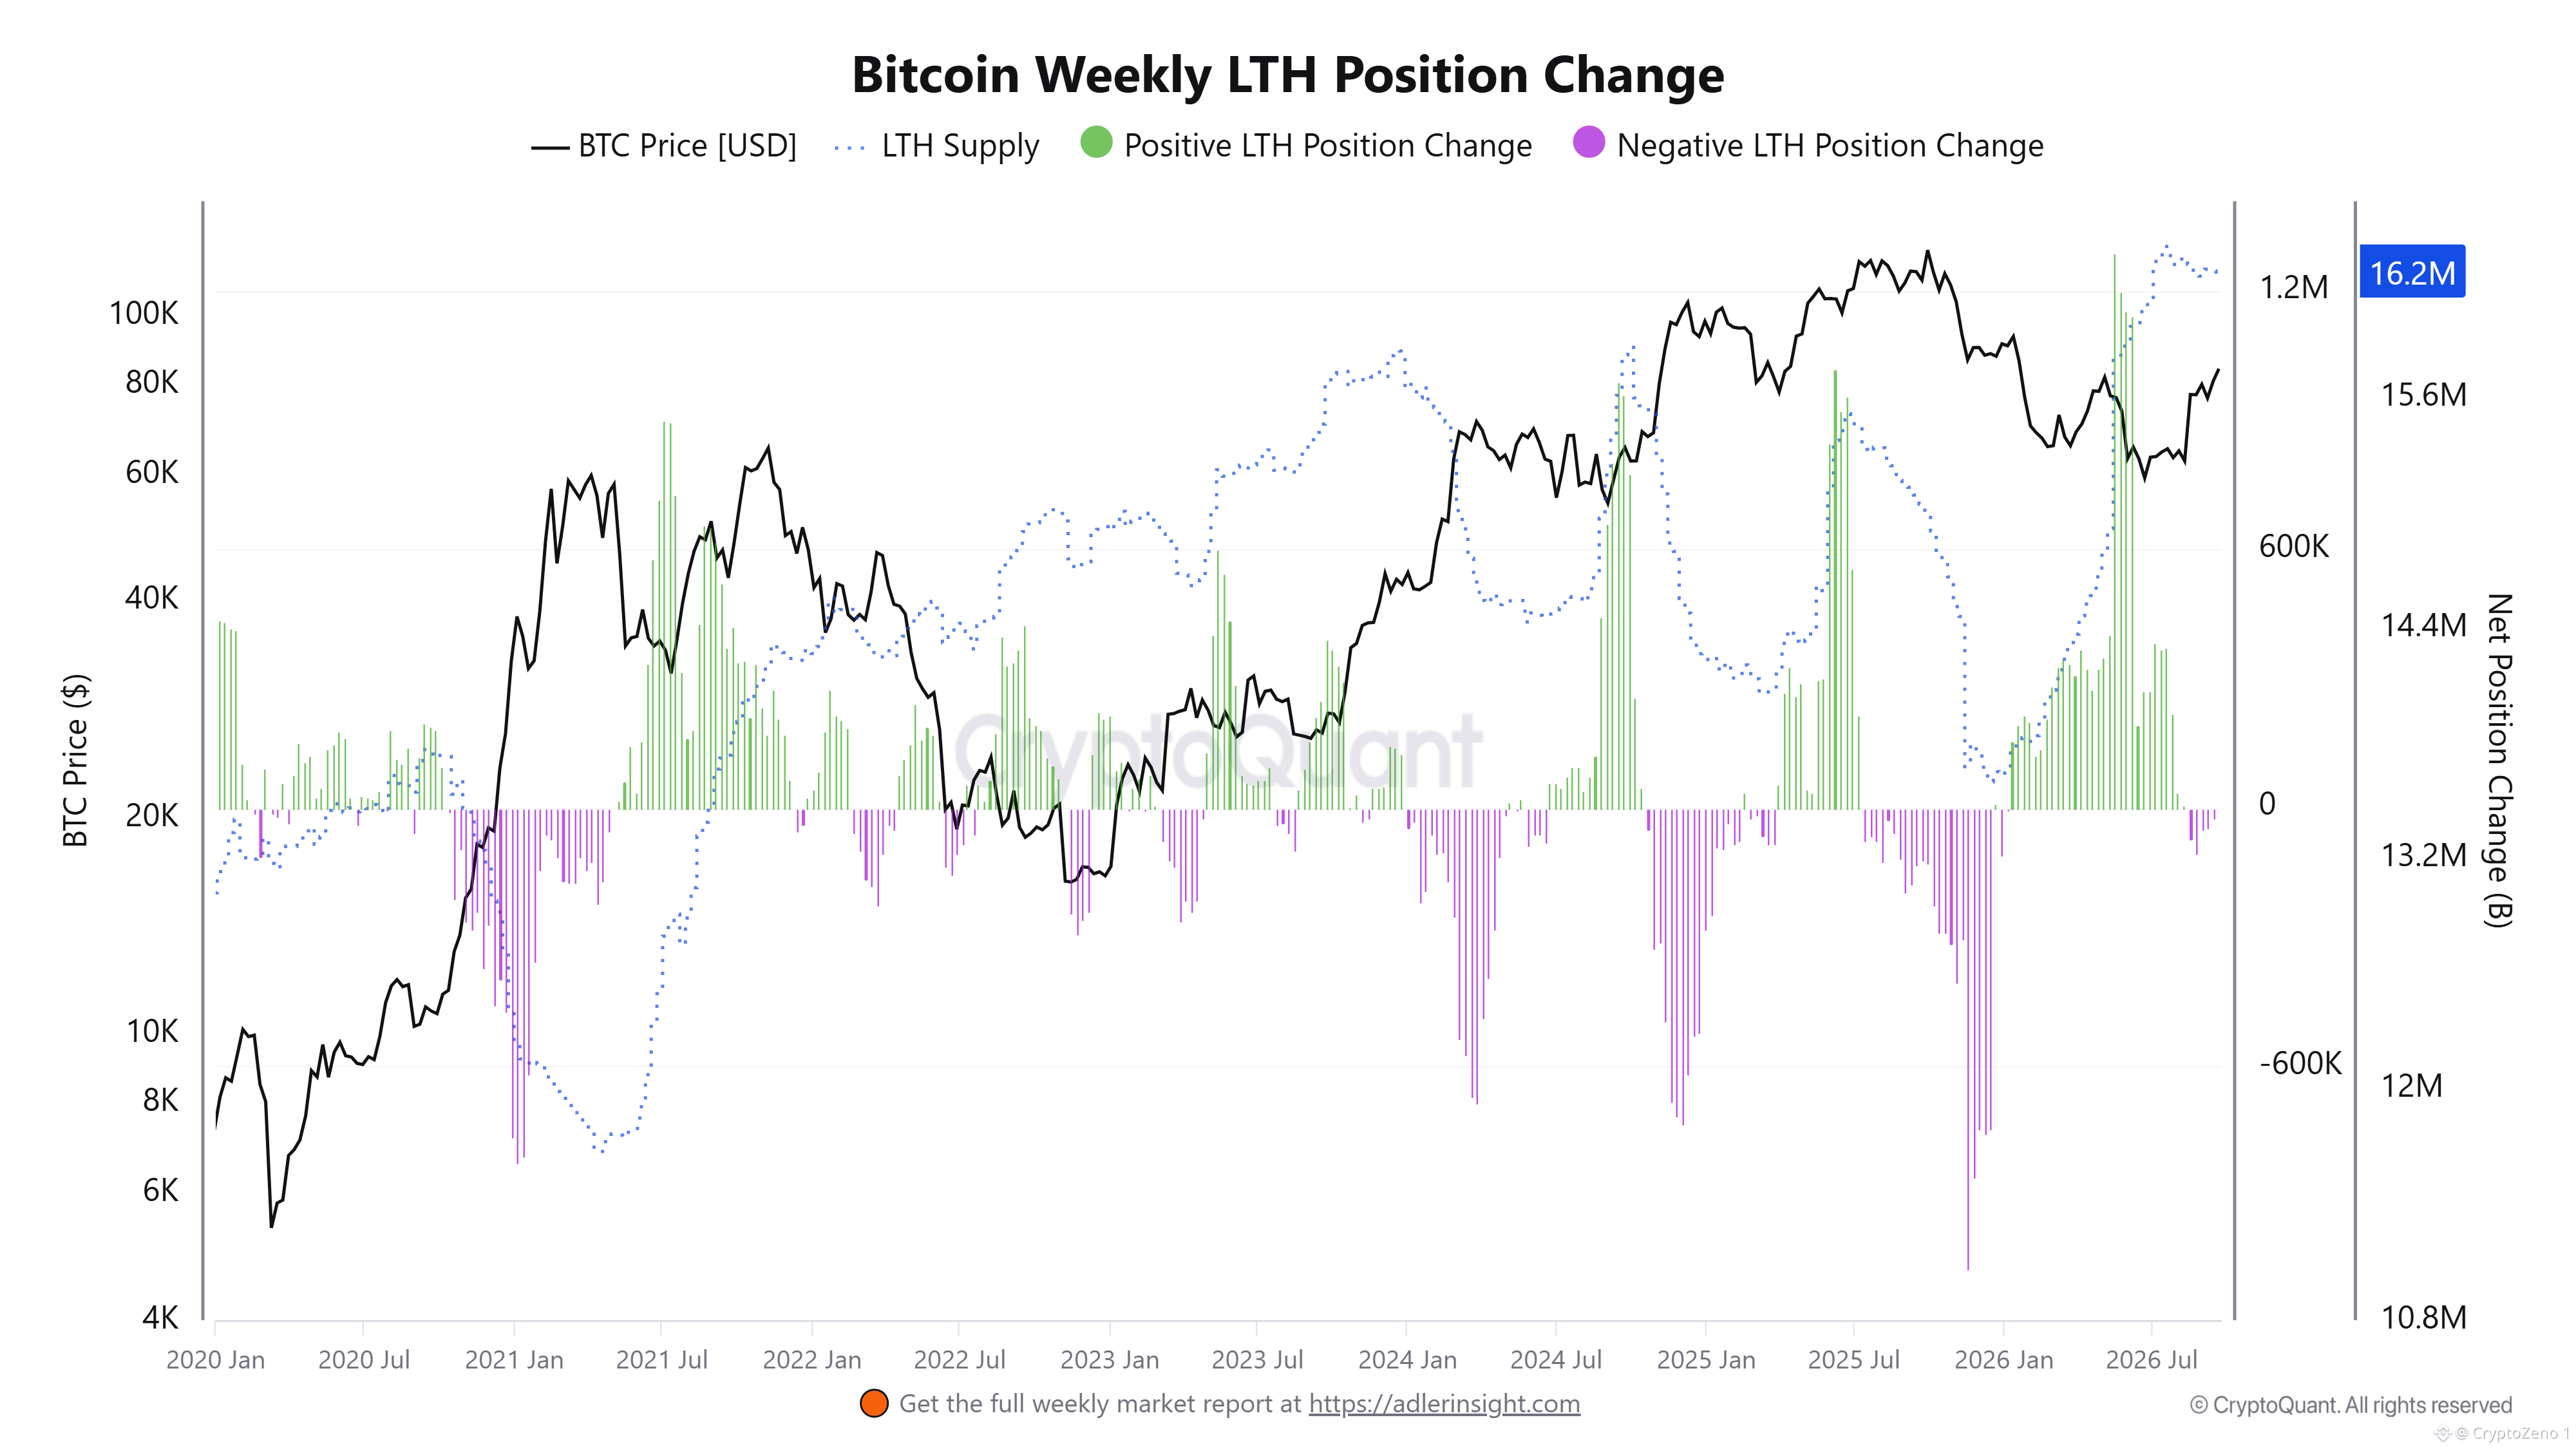
The more important signal comes from long-term holder behavior. The weekly LTH Position Change has recently shifted strongly positive, with several large accumulation spikes appearing as BTC recovered from the $60K area. At the same time, LTH supply has climbed toward 16.2M BTC, suggesting that coins are increasingly moving into longer-duration holdings rather than being consistently distributed into the market.
This creates an interesting divergence between relative valuation and on-chain conviction. BTC remains far below its Power Law trajectory while the BTC/Gold ratio is still compressed, yet long-term holders are expanding their position. Historically, sustained increases in LTH supply can reduce liquid supply available for immediate selling, creating a stronger foundation when demand begins to accelerate.
The key structure to monitor is whether this LTH accumulation persists while BTC holds above the Power Law lower band around $63K. A sustained recovery in the BTC/Gold ratio alongside continued LTH accumulation would indicate improving relative strength and tightening supply conditions. Until then, the data points to a market that is recovering from a period of heavy relative weakness, but has not yet reached the kind of valuation extremes typically associated with late-cycle overheating. #BTC Price Analysis# #Macro Insights#
Bitcoin Is Reclaiming Momentum While Long-Term Holders Tighten Supply
$BTC
is currently trading around $83K, still well above the Power Law lower band near $63K but below the model trend around $140K. This places BTC in a structurally supported valuation zone rather than an extreme overvaluation regime. The BTC/Gold 52-week Z-Score also remains deeply depressed after a prolonged negative period, showing that Bitcoin has significantly underperformed gold on a relative basis and has not yet returned to historical extremes.
The more important signal comes from long-term holder behavior. The weekly LTH Position Change has recently shifted strongly positive, with several large accumulation spikes appearing as BTC recovered from the $60K area. At the same time, LTH supply has climbed toward 16.2M BTC, suggesting that coins are increasingly moving into longer-duration holdings rather than being consistently distributed into the market.
This creates an interesting divergence between relative valuation and on-chain conviction. BTC remains far below its Power Law trajectory while the BTC/Gold ratio is still compressed, yet long-term holders are expanding their position. Historically, sustained increases in LTH supply can reduce liquid supply available for immediate selling, creating a stronger foundation when demand begins to accelerate.
The key structure to monitor is whether this LTH accumulation persists while BTC holds above the Power Law lower band around $63K. A sustained recovery in the BTC/Gold ratio alongside continued LTH accumulation would indicate improving relative strength and tightening supply conditions. Until then, the data points to a market that is recovering from a period of heavy relative weakness, but has not yet reached the kind of valuation extremes typically associated with late-cycle overheating. #BTC Price Analysis# #Macro Insights#
$BTC
is currently trading around $83K, still well above the Power Law lower band near $63K but below the model trend around $140K. This places BTC in a structurally supported valuation zone rather than an extreme overvaluation regime. The BTC/Gold 52-week Z-Score also remains deeply depressed after a prolonged negative period, showing that Bitcoin has significantly underperformed gold on a relative basis and has not yet returned to historical extremes.
The more important signal comes from long-term holder behavior. The weekly LTH Position Change has recently shifted strongly positive, with several large accumulation spikes appearing as BTC recovered from the $60K area. At the same time, LTH supply has climbed toward 16.2M BTC, suggesting that coins are increasingly moving into longer-duration holdings rather than being consistently distributed into the market.
This creates an interesting divergence between relative valuation and on-chain conviction. BTC remains far below its Power Law trajectory while the BTC/Gold ratio is still compressed, yet long-term holders are expanding their position. Historically, sustained increases in LTH supply can reduce liquid supply available for immediate selling, creating a stronger foundation when demand begins to accelerate.
The key structure to monitor is whether this LTH accumulation persists while BTC holds above the Power Law lower band around $63K. A sustained recovery in the BTC/Gold ratio alongside continued LTH accumulation would indicate improving relative strength and tightening supply conditions. Until then, the data points to a market that is recovering from a period of heavy relative weakness, but has not yet reached the kind of valuation extremes typically associated with late-cycle overheating. #BTC Price Analysis# #Macro Insights#
21
·
--
عرض الترجمة
💥 #Bitcoin Is Recovering While On-Chain Risk Remains Restrained
$BTC has recovered toward the $84K area, but the on-chain structure still looks far from the conditions that historically accompanied late cycle overheating. The current setup is more consistent with a market rebuilding strength after a prolonged reset in realized profit and sell-side pressure.
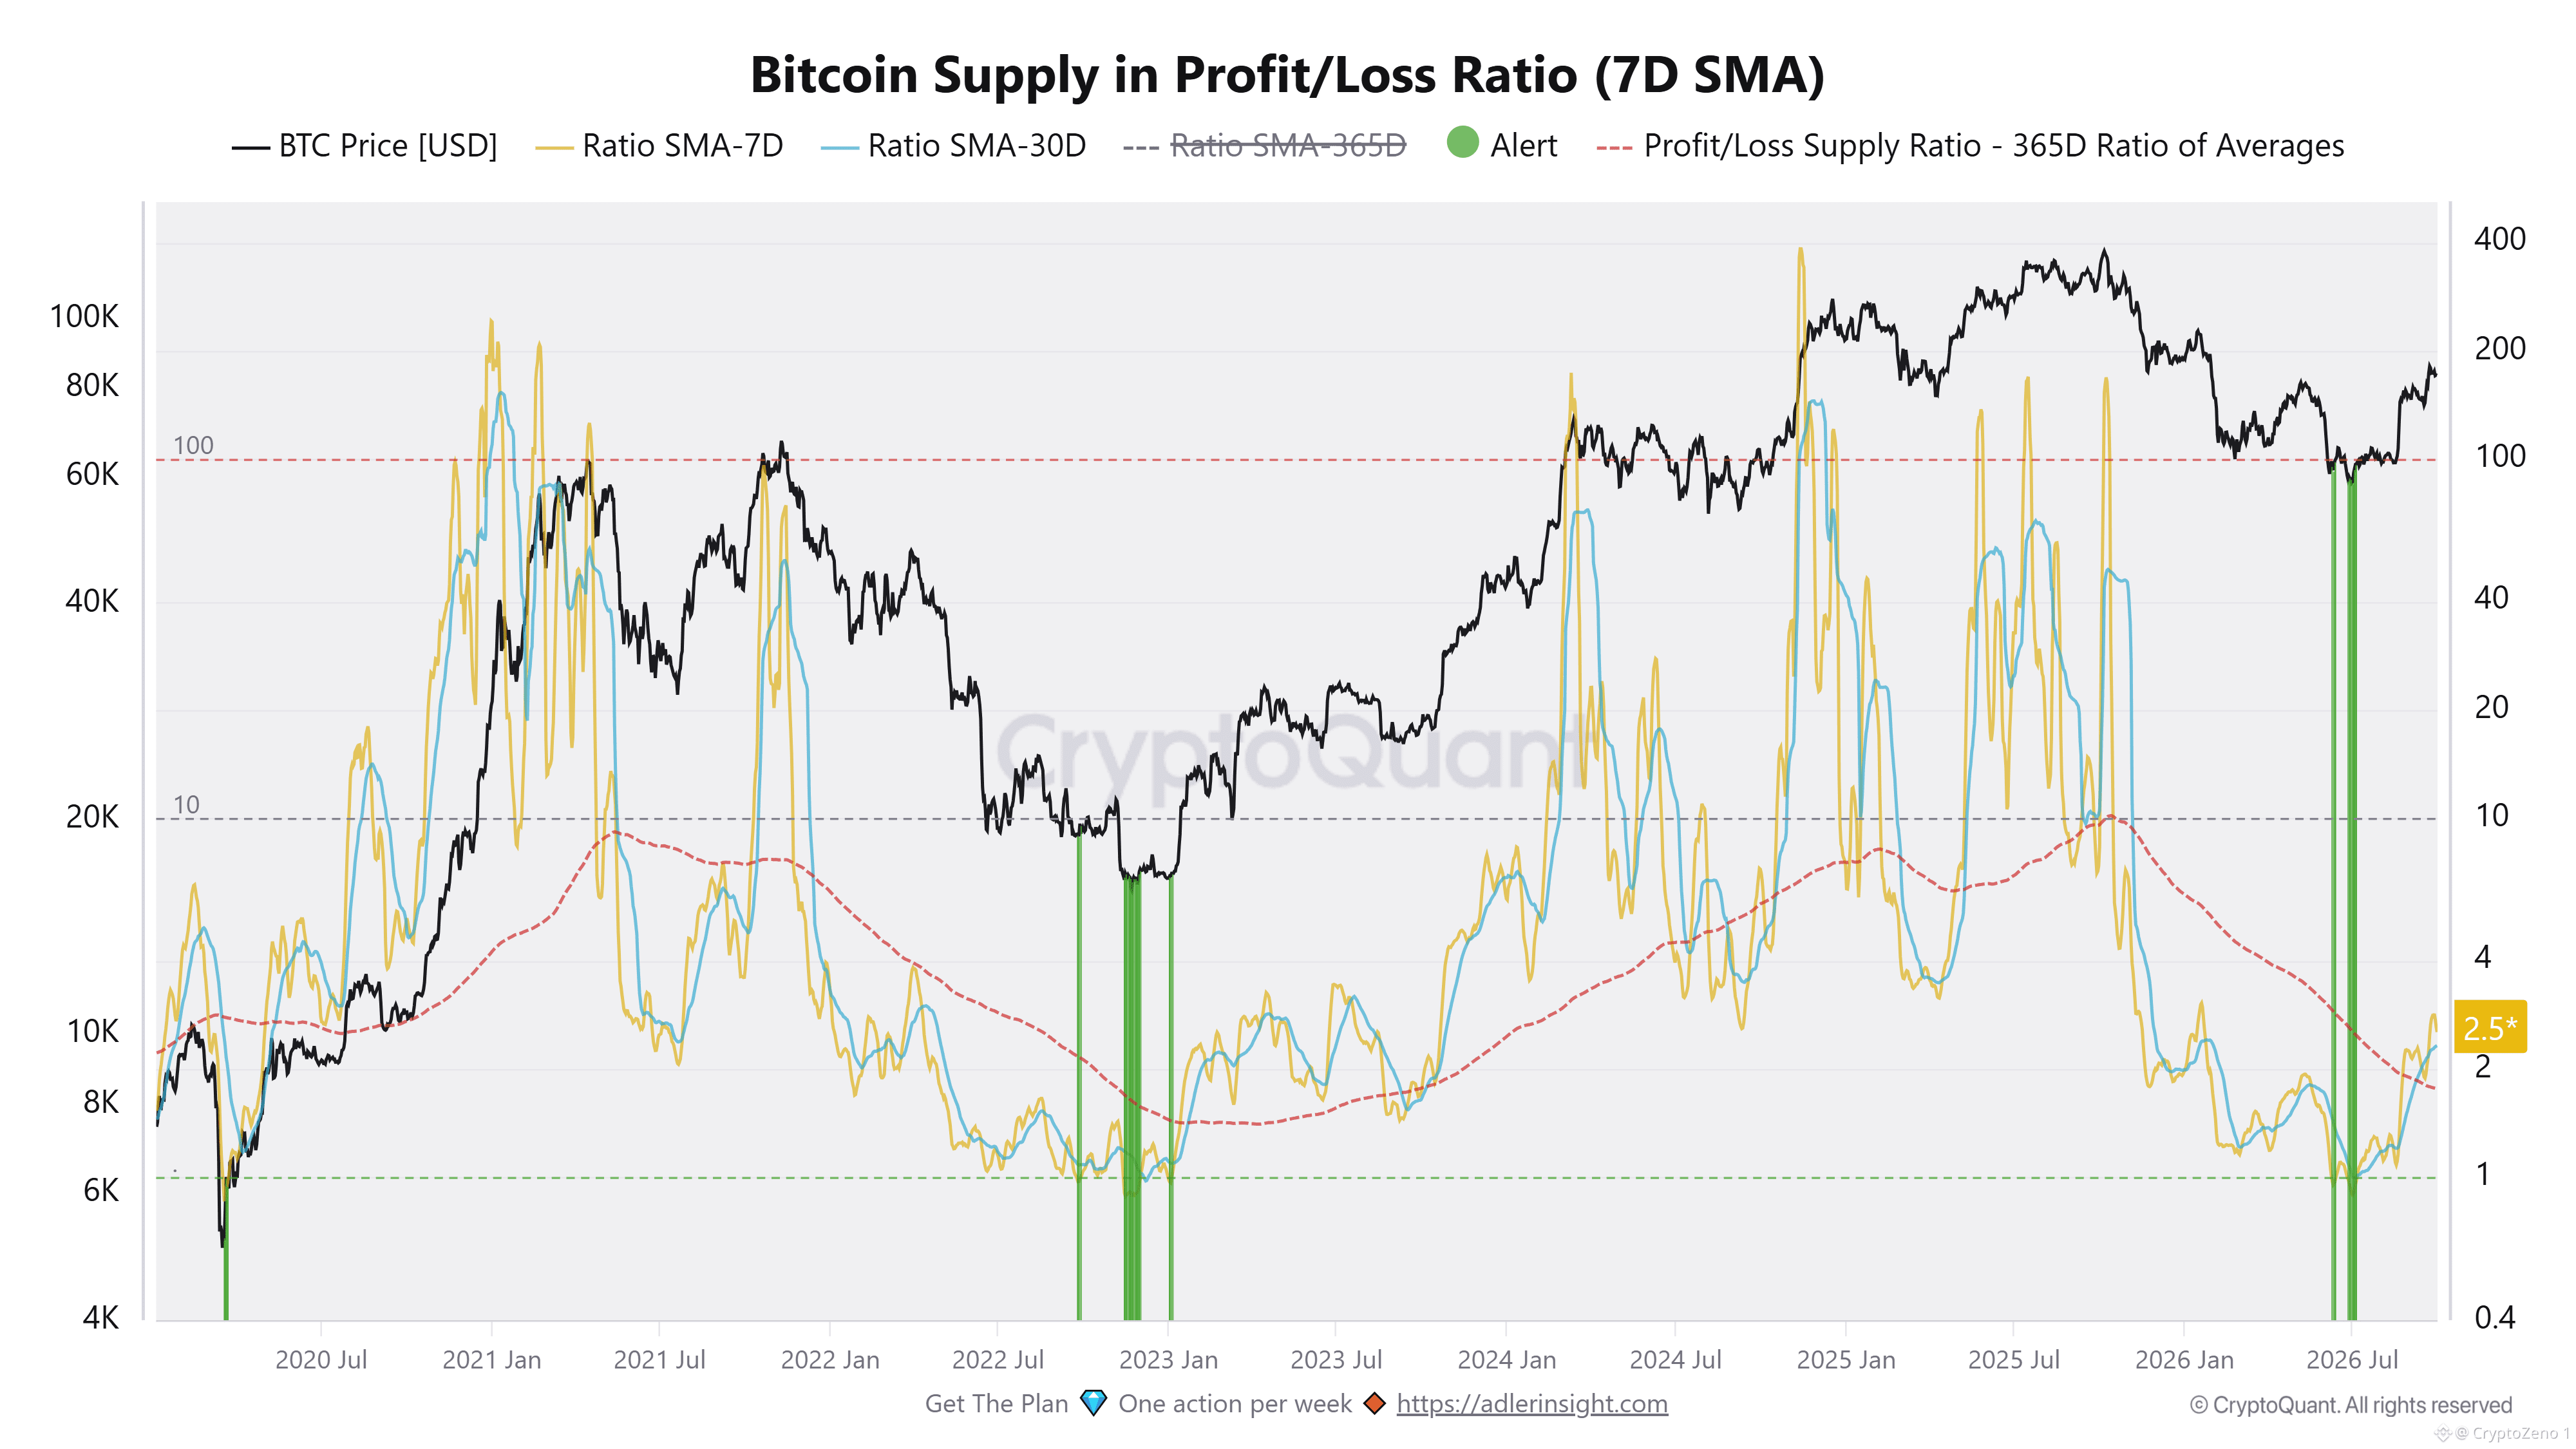
The Supply in Profit/Loss Ratio is now around 2.5, well above the 1.0 level that has previously marked periods of widespread capitulation, but still far below the 10+ readings seen during stronger profit-taking phases. This is important because the latest price recovery has not yet pushed the ratio into a zone where profitable supply becomes an obvious source of aggressive distribution. The 7-day and 30-day averages are also turning higher, showing that the improvement is gaining some persistence rather than being a single-day move.
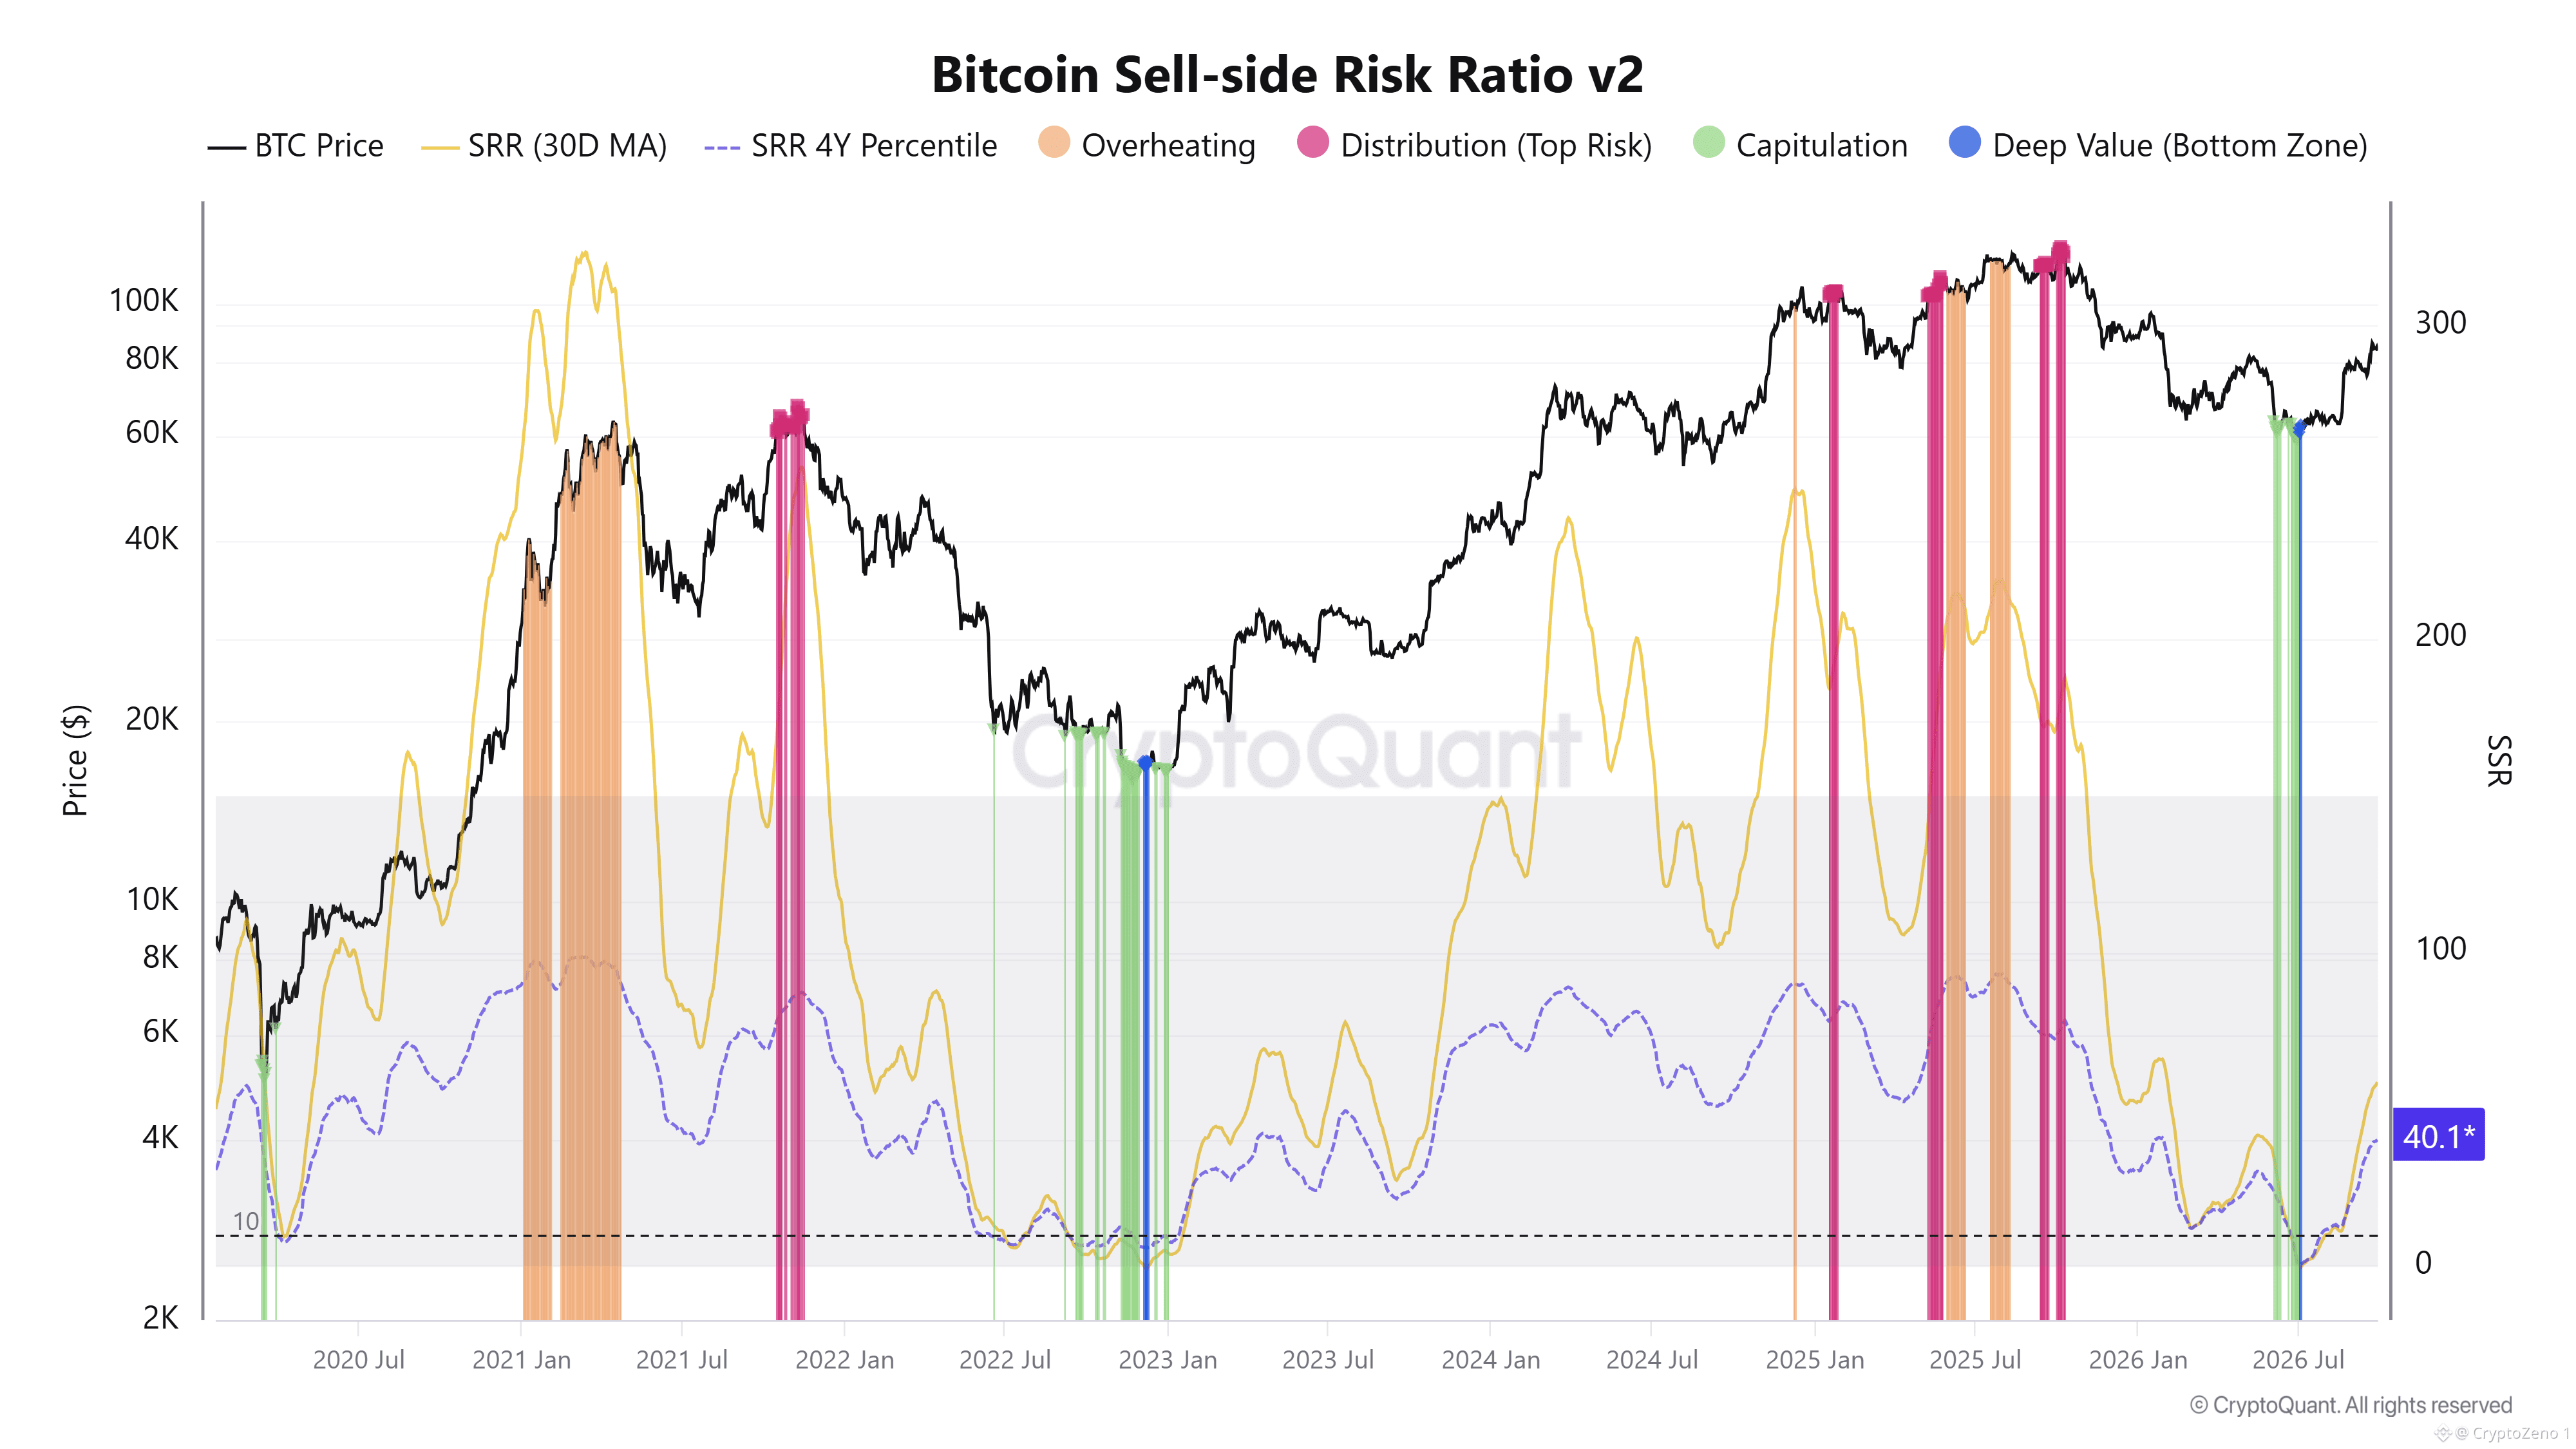
The Sell-side Risk Ratio adds another layer to the picture. Its current reading is around 40.1, after falling sharply into the lower range earlier in 2026. Historically, deep declines in this metric have appeared when the market has exhausted a large portion of its forced or emotional selling. The recent rebound therefore suggests that realized profit-taking is returning as price recovers, but the indicator remains well below the elevated levels associated with overheating and major distribution.
This leaves Bitcoin in an interesting transition. Price has regained momentum, while on-chain risk metrics have not yet reached the extremes that typically define a mature speculative phase. That does not remove the possibility of another correction, especially if macro liquidity or risk appetite deteriorates, but it does suggest that the current advance is occurring without an obvious on-chain excess. The next signal to watch is whether these ratios continue rising with price or begin accelerating toward historical risk zones. #BTC Price Analysis# #Macro Insights#
💥 #Bitcoin Is Recovering While On-Chain Risk Remains Restrained
$BTC has recovered toward the $84K area, but the on-chain structure still looks far from the conditions that historically accompanied late cycle overheating. The current setup is more consistent with a market rebuilding strength after a prolonged reset in realized profit and sell-side pressure.
The Supply in Profit/Loss Ratio is now around 2.5, well above the 1.0 level that has previously marked periods of widespread capitulation, but still far below the 10+ readings seen during stronger profit-taking phases. This is important because the latest price recovery has not yet pushed the ratio into a zone where profitable supply becomes an obvious source of aggressive distribution. The 7-day and 30-day averages are also turning higher, showing that the improvement is gaining some persistence rather than being a single-day move.
The Sell-side Risk Ratio adds another layer to the picture. Its current reading is around 40.1, after falling sharply into the lower range earlier in 2026. Historically, deep declines in this metric have appeared when the market has exhausted a large portion of its forced or emotional selling. The recent rebound therefore suggests that realized profit-taking is returning as price recovers, but the indicator remains well below the elevated levels associated with overheating and major distribution.
This leaves Bitcoin in an interesting transition. Price has regained momentum, while on-chain risk metrics have not yet reached the extremes that typically define a mature speculative phase. That does not remove the possibility of another correction, especially if macro liquidity or risk appetite deteriorates, but it does suggest that the current advance is occurring without an obvious on-chain excess. The next signal to watch is whether these ratios continue rising with price or begin accelerating toward historical risk zones. #BTC Price Analysis# #Macro Insights#
$BTC has recovered toward the $84K area, but the on-chain structure still looks far from the conditions that historically accompanied late cycle overheating. The current setup is more consistent with a market rebuilding strength after a prolonged reset in realized profit and sell-side pressure.
The Supply in Profit/Loss Ratio is now around 2.5, well above the 1.0 level that has previously marked periods of widespread capitulation, but still far below the 10+ readings seen during stronger profit-taking phases. This is important because the latest price recovery has not yet pushed the ratio into a zone where profitable supply becomes an obvious source of aggressive distribution. The 7-day and 30-day averages are also turning higher, showing that the improvement is gaining some persistence rather than being a single-day move.
The Sell-side Risk Ratio adds another layer to the picture. Its current reading is around 40.1, after falling sharply into the lower range earlier in 2026. Historically, deep declines in this metric have appeared when the market has exhausted a large portion of its forced or emotional selling. The recent rebound therefore suggests that realized profit-taking is returning as price recovers, but the indicator remains well below the elevated levels associated with overheating and major distribution.
This leaves Bitcoin in an interesting transition. Price has regained momentum, while on-chain risk metrics have not yet reached the extremes that typically define a mature speculative phase. That does not remove the possibility of another correction, especially if macro liquidity or risk appetite deteriorates, but it does suggest that the current advance is occurring without an obvious on-chain excess. The next signal to watch is whether these ratios continue rising with price or begin accelerating toward historical risk zones. #BTC Price Analysis# #Macro Insights#
83
·
--
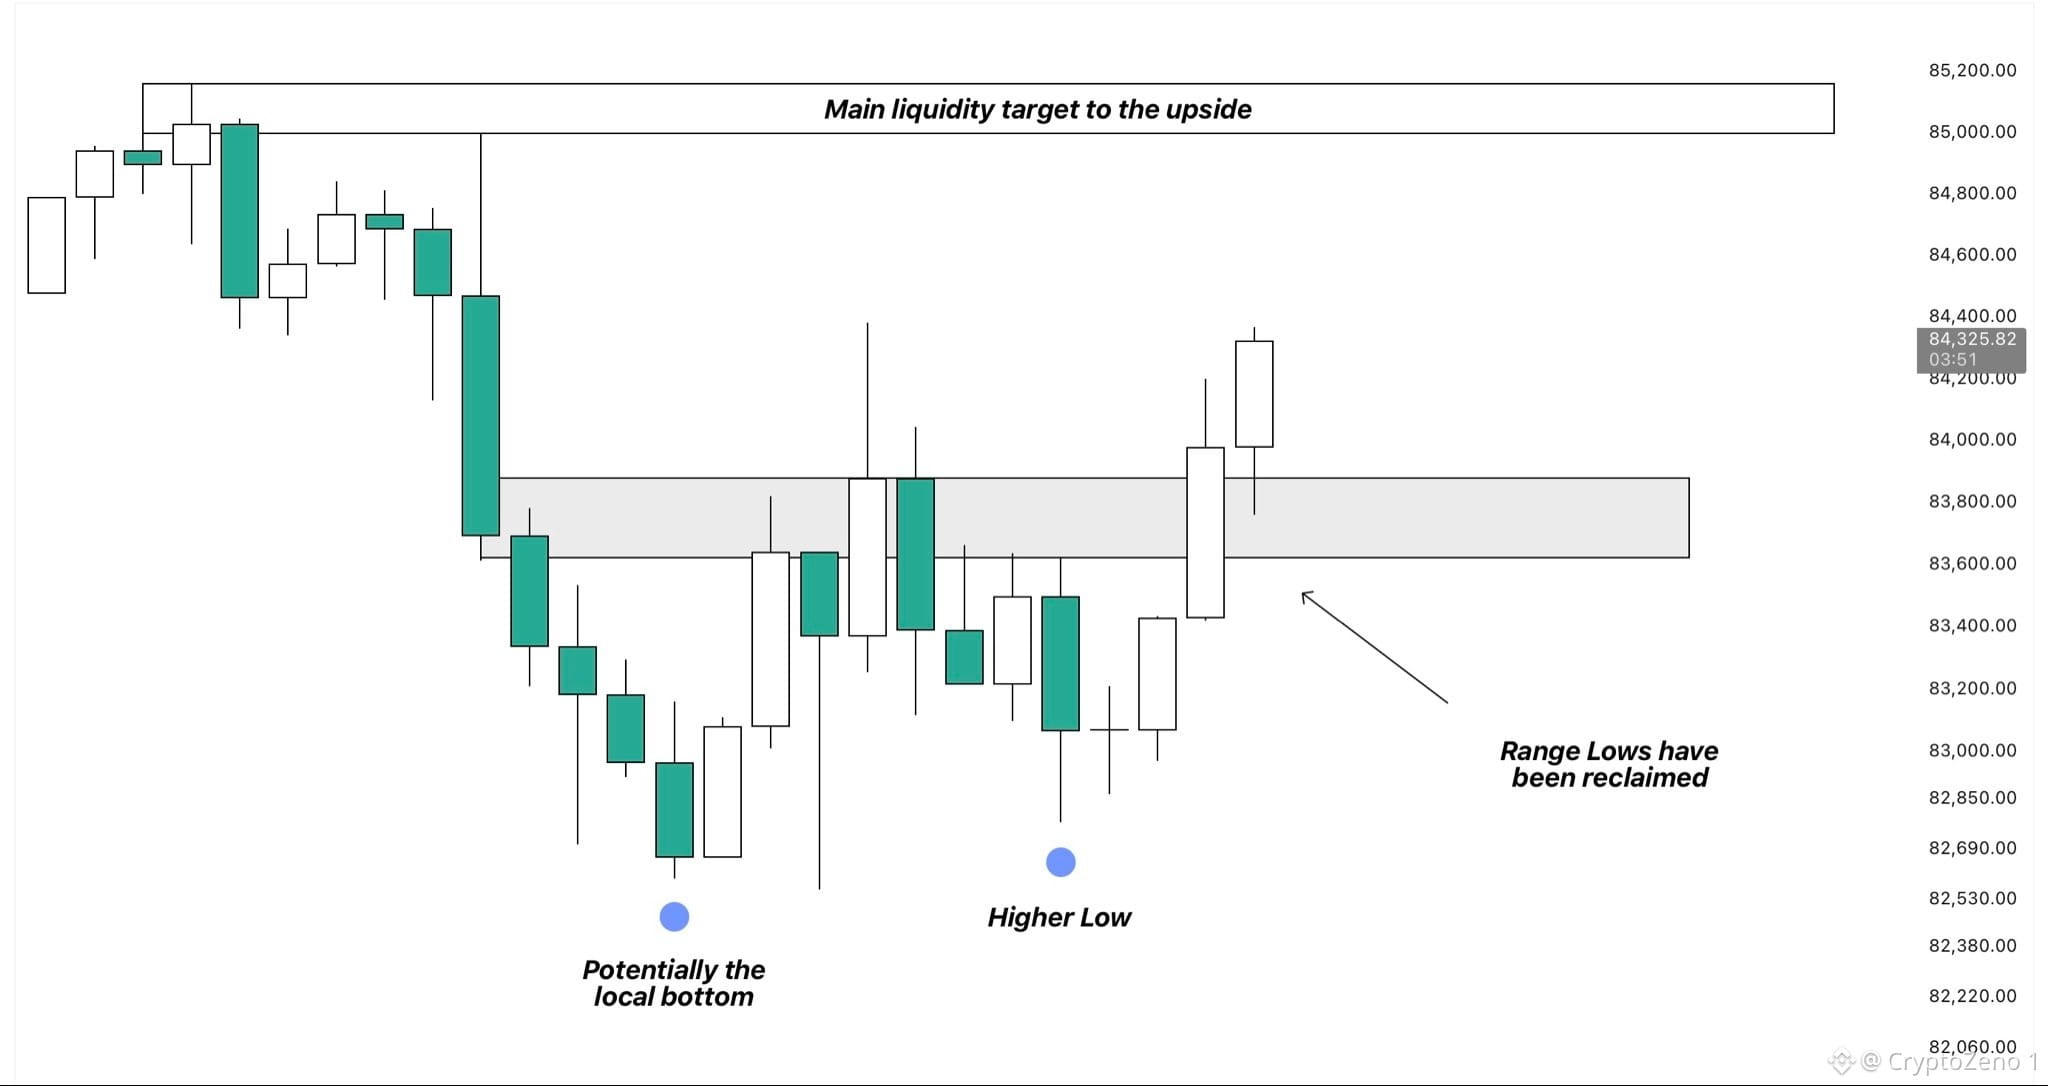
$BTC قد يكون القاع المحلي قد تم تشكيله بالفعل.
لقد استعاد السعر رسميًا الآن قيعان النطاق ويواصل إيجاد قبول فوقها.
على إطار LTF، قام BTC بالفعل بطباعة قاع أعلى وهو الآن قريب من تشكيل قمة أعلى أيضًا.
من هنا، أعتقد أن استمرار الحركة باتجاه منطقة $85k مرجّح جدًا، إذ إن هذا هو أيضًا المكان الذي تستقر فيه غالبية السيولة قصيرة الأجل حاليًا.
إذا كانت الزخمات الصعودية قوية بما يكفي لدفع السعر عبر هذا المستوى، فقد نشهد بعد ذلك استمرارًا باتجاه القمم قرب $87k.
أما في حال حدوث رفض عندها، فسيحافظ ذلك على بقاء BTC ضمن نطاق تداول في الوقت الحالي. #تحليل_سعر_BTC# #رؤى_ماكرو#
$BTC قد يكون القاع المحلي قد تم تشكيله بالفعل.
لقد استعاد السعر رسميًا الآن قيعان النطاق ويواصل إيجاد قبول فوقها.
على إطار LTF، قام BTC بالفعل بطباعة قاع أعلى وهو الآن قريب من تشكيل قمة أعلى أيضًا.
من هنا، أعتقد أن استمرار الحركة باتجاه منطقة $85k مرجّح جدًا، إذ إن هذا هو أيضًا المكان الذي تستقر فيه غالبية السيولة قصيرة الأجل حاليًا.
إذا كانت الزخمات الصعودية قوية بما يكفي لدفع السعر عبر هذا المستوى، فقد نشهد بعد ذلك استمرارًا باتجاه القمم قرب $87k.
أما في حال حدوث رفض عندها، فسيحافظ ذلك على بقاء BTC ضمن نطاق تداول في الوقت الحالي. #تحليل_سعر_BTC# #رؤى_ماكرو#
لقد استعاد السعر رسميًا الآن قيعان النطاق ويواصل إيجاد قبول فوقها.
على إطار LTF، قام BTC بالفعل بطباعة قاع أعلى وهو الآن قريب من تشكيل قمة أعلى أيضًا.
من هنا، أعتقد أن استمرار الحركة باتجاه منطقة $85k مرجّح جدًا، إذ إن هذا هو أيضًا المكان الذي تستقر فيه غالبية السيولة قصيرة الأجل حاليًا.
إذا كانت الزخمات الصعودية قوية بما يكفي لدفع السعر عبر هذا المستوى، فقد نشهد بعد ذلك استمرارًا باتجاه القمم قرب $87k.
أما في حال حدوث رفض عندها، فسيحافظ ذلك على بقاء BTC ضمن نطاق تداول في الوقت الحالي. #تحليل_سعر_BTC# #رؤى_ماكرو#
96
·
--
عرض الترجمة
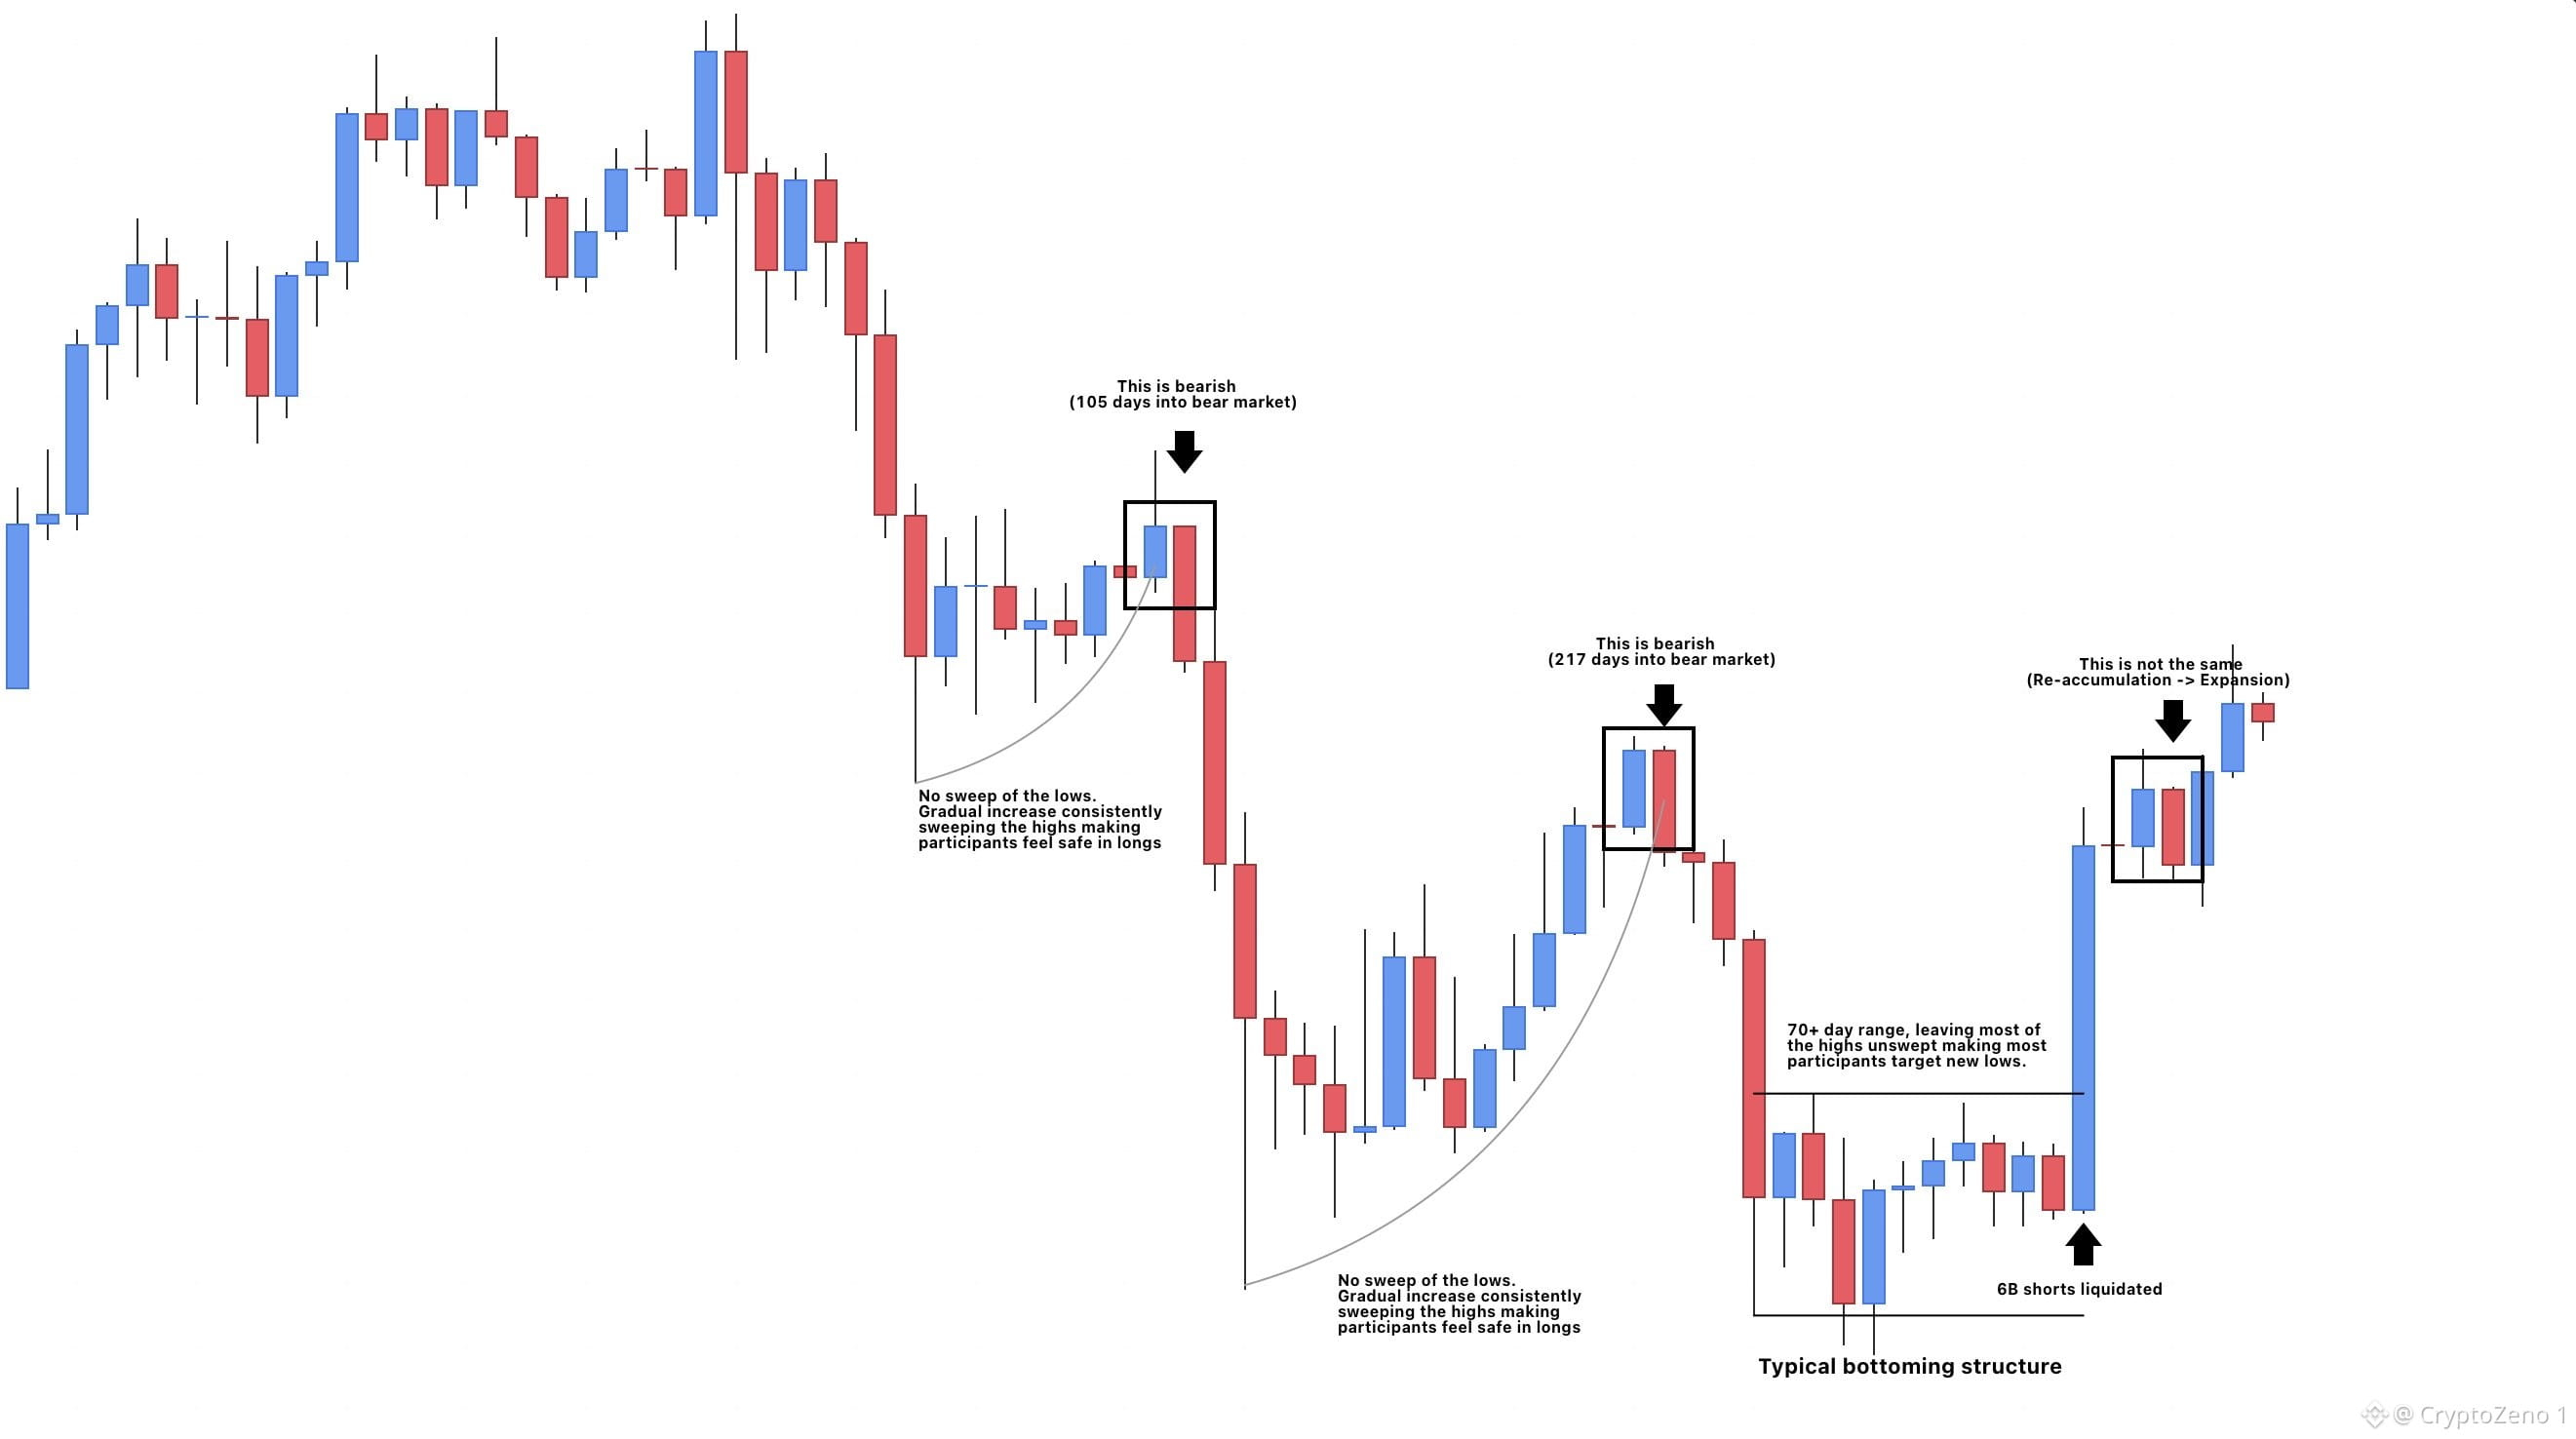
$BTC They were not the same...
The structure before and during the move matters. Were all three bearish engulfing candles? Yes. But look at the structure surrounding each occurrence.
The third came after a breakout from a 2+ month range, liquidating $6B in shorts. That's very different from the two previous instances, where price kept targeting the shorts while leaving almost all the wick lows unswept, making participants feel safe in longs.
The context matters. This is a clear indication that the bottom is in and higher prices are coming.🎲 #BTC Price Analysis# #Macro Insights#
$BTC They were not the same...
The structure before and during the move matters. Were all three bearish engulfing candles? Yes. But look at the structure surrounding each occurrence.
The third came after a breakout from a 2+ month range, liquidating $6B in shorts. That's very different from the two previous instances, where price kept targeting the shorts while leaving almost all the wick lows unswept, making participants feel safe in longs.
The context matters. This is a clear indication that the bottom is in and higher prices are coming.🎲 #BTC Price Analysis# #Macro Insights#
The structure before and during the move matters. Were all three bearish engulfing candles? Yes. But look at the structure surrounding each occurrence.
The third came after a breakout from a 2+ month range, liquidating $6B in shorts. That's very different from the two previous instances, where price kept targeting the shorts while leaving almost all the wick lows unswept, making participants feel safe in longs.
The context matters. This is a clear indication that the bottom is in and higher prices are coming.🎲 #BTC Price Analysis# #Macro Insights#
78
·
--
عرض الترجمة
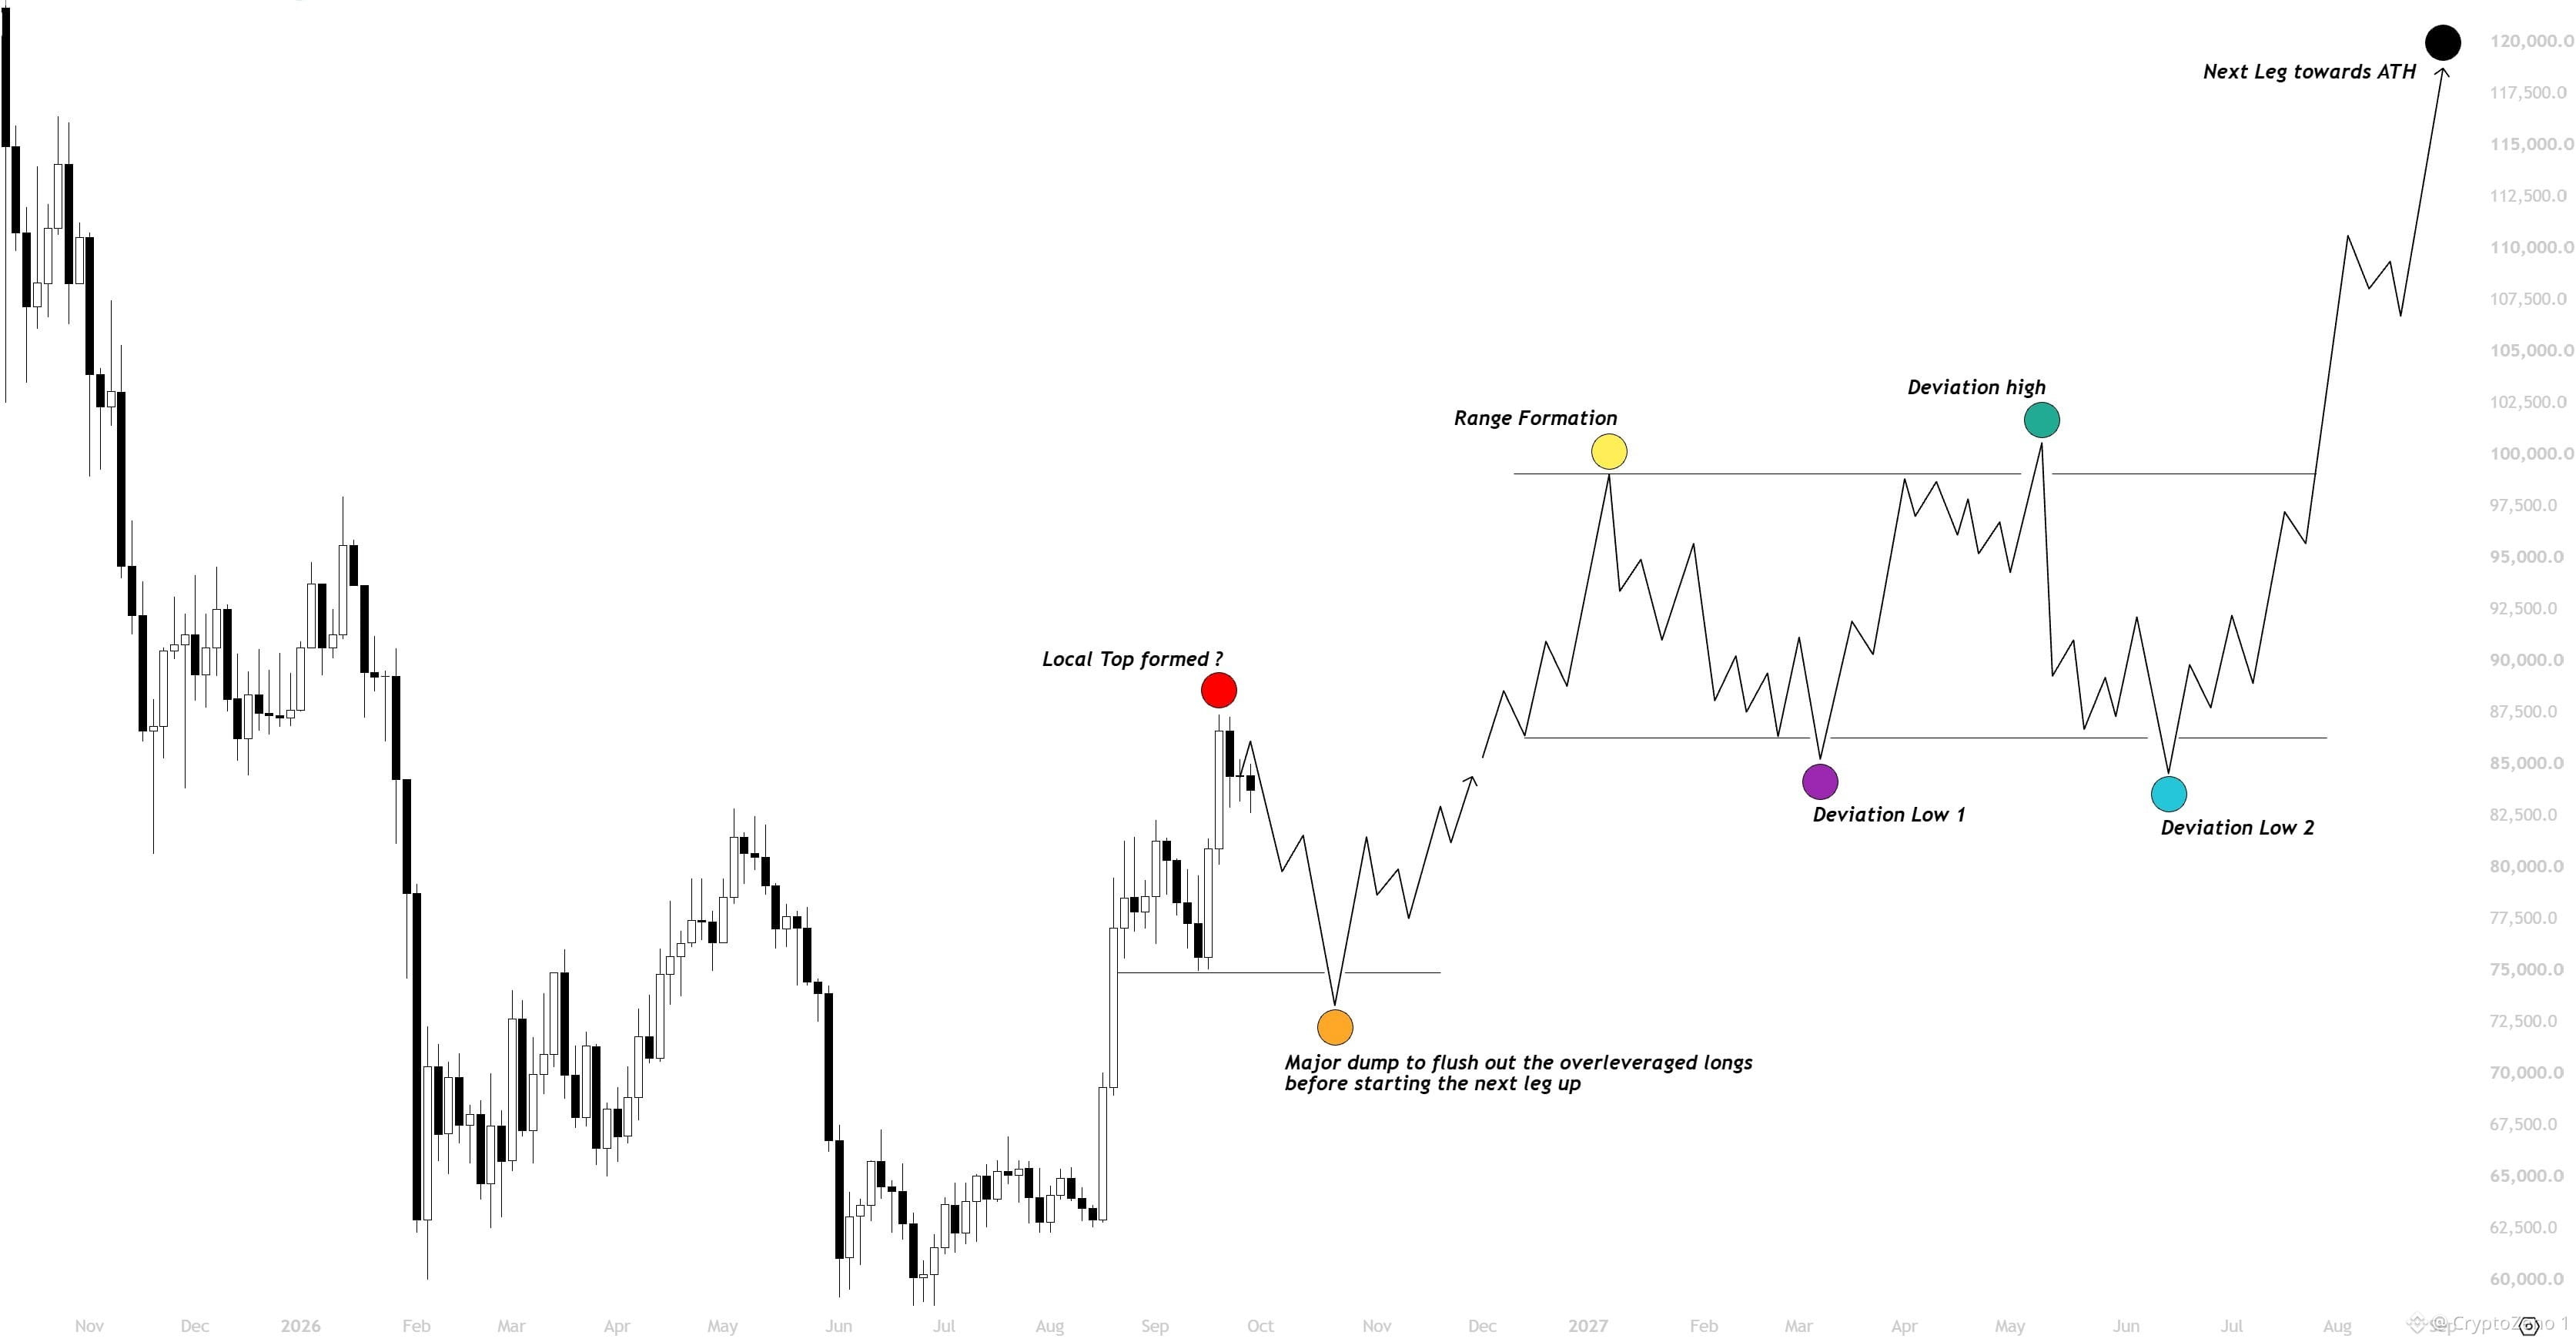
$BTC Price is starting to lose momentum around the expected top,
We might see another pump to 85.5k as a bearish retest,
But after that I am looking for price to start dumping towards the downside liquidity,
I am expecting this dump to take place over the next 1-2 weeks as the start of the new monthly candle.
So basically, October is going to be the last good month for accumulation before we absolutely go parabolic.
For price to hit 100k, I don't think it's going to happen this year as well, maybe in the first quarter of 2027.
Overall, this is my current plan for the upcoming Q4. #BTC Price Analysis# #Macro Insights# #Meme Alpha#
$BTC Price is starting to lose momentum around the expected top,
We might see another pump to 85.5k as a bearish retest,
But after that I am looking for price to start dumping towards the downside liquidity,
I am expecting this dump to take place over the next 1-2 weeks as the start of the new monthly candle.
So basically, October is going to be the last good month for accumulation before we absolutely go parabolic.
For price to hit 100k, I don't think it's going to happen this year as well, maybe in the first quarter of 2027.
Overall, this is my current plan for the upcoming Q4. #BTC Price Analysis# #Macro Insights# #Meme Alpha#
We might see another pump to 85.5k as a bearish retest,
But after that I am looking for price to start dumping towards the downside liquidity,
I am expecting this dump to take place over the next 1-2 weeks as the start of the new monthly candle.
So basically, October is going to be the last good month for accumulation before we absolutely go parabolic.
For price to hit 100k, I don't think it's going to happen this year as well, maybe in the first quarter of 2027.
Overall, this is my current plan for the upcoming Q4. #BTC Price Analysis# #Macro Insights# #Meme Alpha#
55
·
--
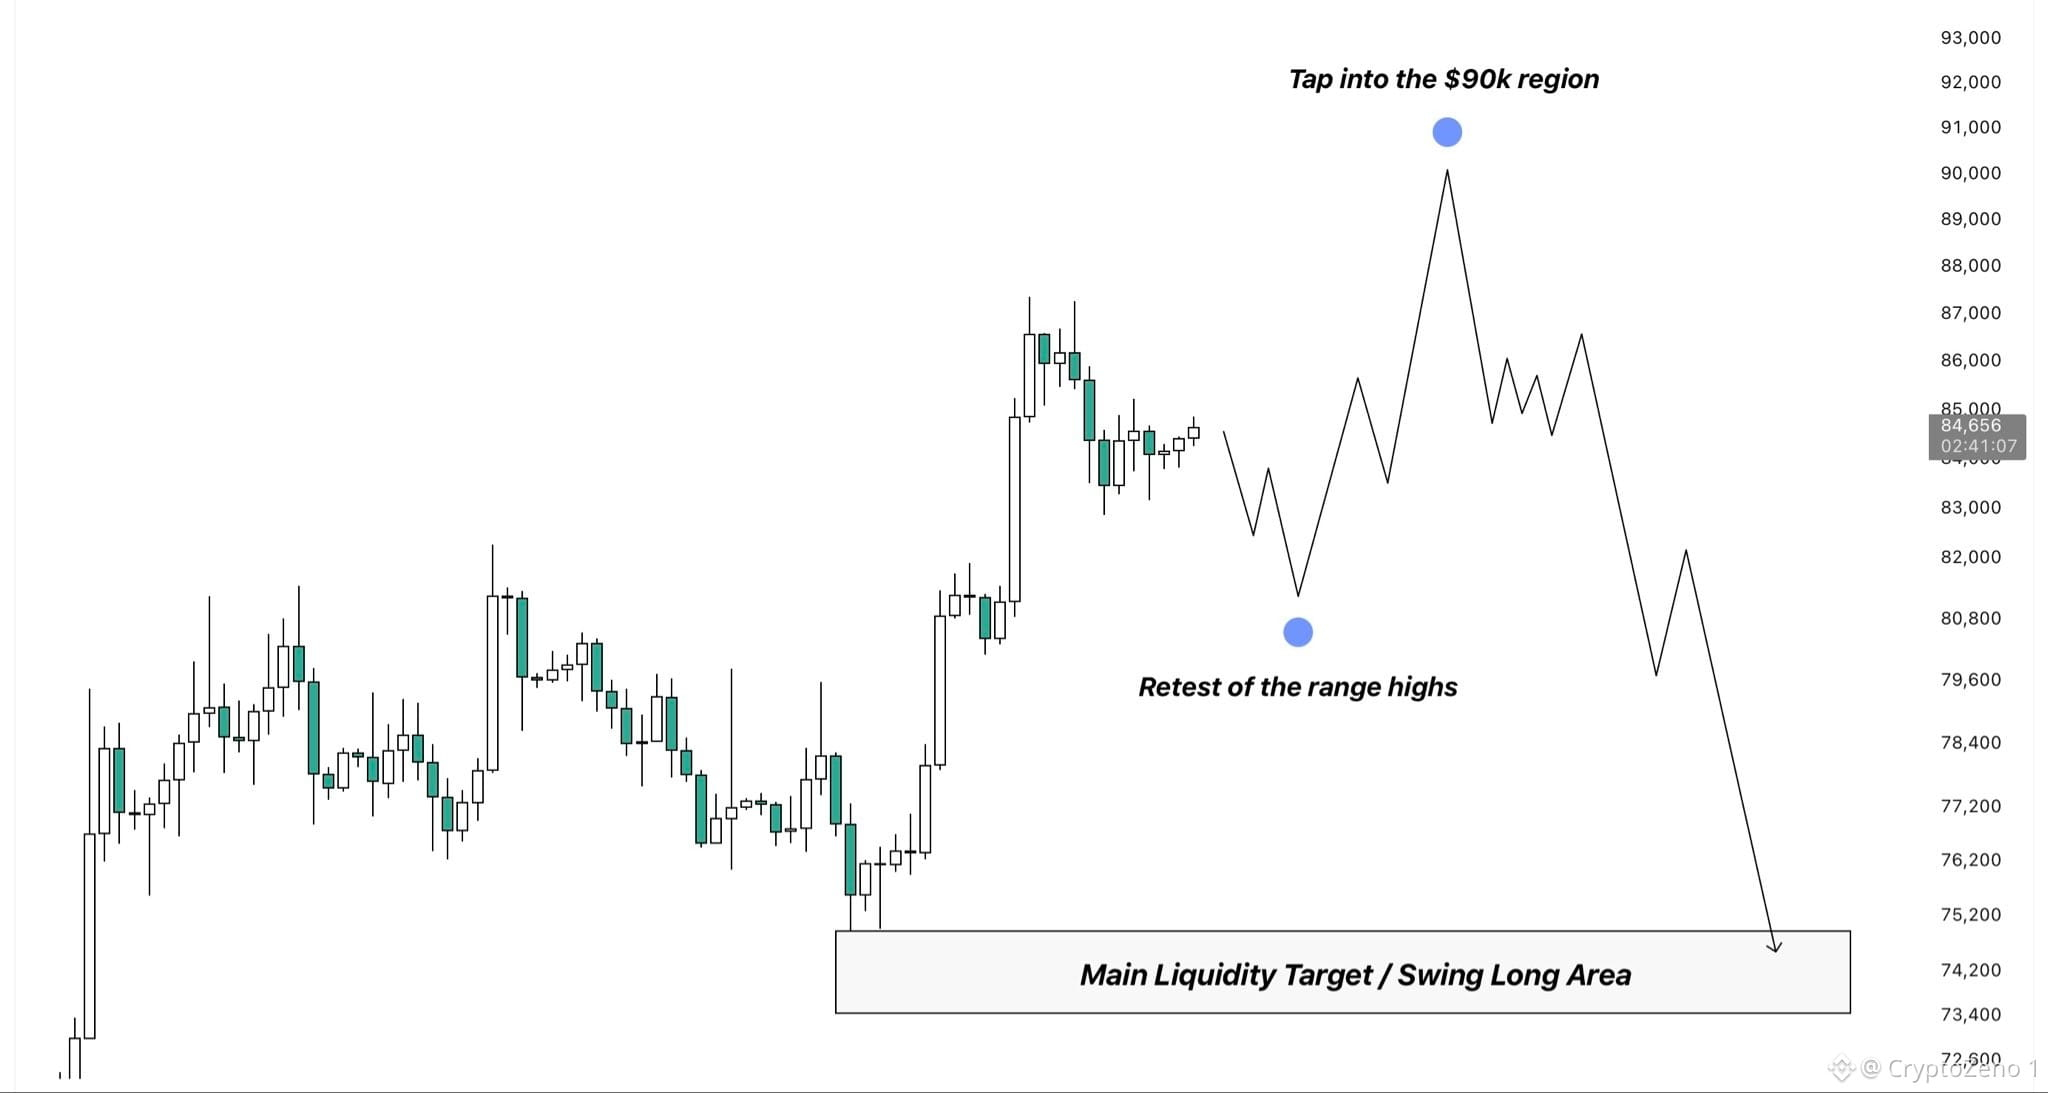
$BTC إليك مخططك التفصيلي للأسابيع القليلة القادمة.
أولاً، أريد أن أرى إغلاقاً أسبوعياً فوق 82.8 ألف دولار لتأكيد حدوث تحول في البنية السوقية لصالح الاتجاه الصاعد على الإطار الزمني الأعلى (HTF).
بعد ذلك، أتوقع أن يقوم BTC بإعادة اختبار قمم النطاق السابق للاستحواذ على مزيد من عمليات التصفية الطويلة، ثم يلي ذلك توسع آخر صعوداً باتجاه منطقة 90 ألف دولار.
عند هذه النقطة، سأكون مهتماً باحتمال صفقة بيع (Swing Short) محتملة، بهدف الوصول إلى قيعان الارتفاع الأخير. تلك المنطقة الأقل حالياً هي هدفي الرئيسي للهبوط بناءً على السيولة، وفي الوقت نفسه هي المنطقة المفضلة لدي لصفقة شراء (Swing Long) أخرى.
أعتقد أن هذا سيناريو واقعي جداً ليس فقط من منظور الرسم البياني، بل أيضاً من منظور السيولة؛ لأنه سيسمح لـ BTC بمسح السيولة على الجانبين قبل أن تبدأ الخطوة التالية للأعلى. #تحليل_سعر_البيتكوين# #رؤى_ماكرو#
$BTC إليك مخططك التفصيلي للأسابيع القليلة القادمة.
أولاً، أريد أن أرى إغلاقاً أسبوعياً فوق 82.8 ألف دولار لتأكيد حدوث تحول في البنية السوقية لصالح الاتجاه الصاعد على الإطار الزمني الأعلى (HTF).
بعد ذلك، أتوقع أن يقوم BTC بإعادة اختبار قمم النطاق السابق للاستحواذ على مزيد من عمليات التصفية الطويلة، ثم يلي ذلك توسع آخر صعوداً باتجاه منطقة 90 ألف دولار.
عند هذه النقطة، سأكون مهتماً باحتمال صفقة بيع (Swing Short) محتملة، بهدف الوصول إلى قيعان الارتفاع الأخير. تلك المنطقة الأقل حالياً هي هدفي الرئيسي للهبوط بناءً على السيولة، وفي الوقت نفسه هي المنطقة المفضلة لدي لصفقة شراء (Swing Long) أخرى.
أعتقد أن هذا سيناريو واقعي جداً ليس فقط من منظور الرسم البياني، بل أيضاً من منظور السيولة؛ لأنه سيسمح لـ BTC بمسح السيولة على الجانبين قبل أن تبدأ الخطوة التالية للأعلى. #تحليل_سعر_البيتكوين# #رؤى_ماكرو#
أولاً، أريد أن أرى إغلاقاً أسبوعياً فوق 82.8 ألف دولار لتأكيد حدوث تحول في البنية السوقية لصالح الاتجاه الصاعد على الإطار الزمني الأعلى (HTF).
بعد ذلك، أتوقع أن يقوم BTC بإعادة اختبار قمم النطاق السابق للاستحواذ على مزيد من عمليات التصفية الطويلة، ثم يلي ذلك توسع آخر صعوداً باتجاه منطقة 90 ألف دولار.
عند هذه النقطة، سأكون مهتماً باحتمال صفقة بيع (Swing Short) محتملة، بهدف الوصول إلى قيعان الارتفاع الأخير. تلك المنطقة الأقل حالياً هي هدفي الرئيسي للهبوط بناءً على السيولة، وفي الوقت نفسه هي المنطقة المفضلة لدي لصفقة شراء (Swing Long) أخرى.
أعتقد أن هذا سيناريو واقعي جداً ليس فقط من منظور الرسم البياني، بل أيضاً من منظور السيولة؛ لأنه سيسمح لـ BTC بمسح السيولة على الجانبين قبل أن تبدأ الخطوة التالية للأعلى. #تحليل_سعر_البيتكوين# #رؤى_ماكرو#
76
·
--
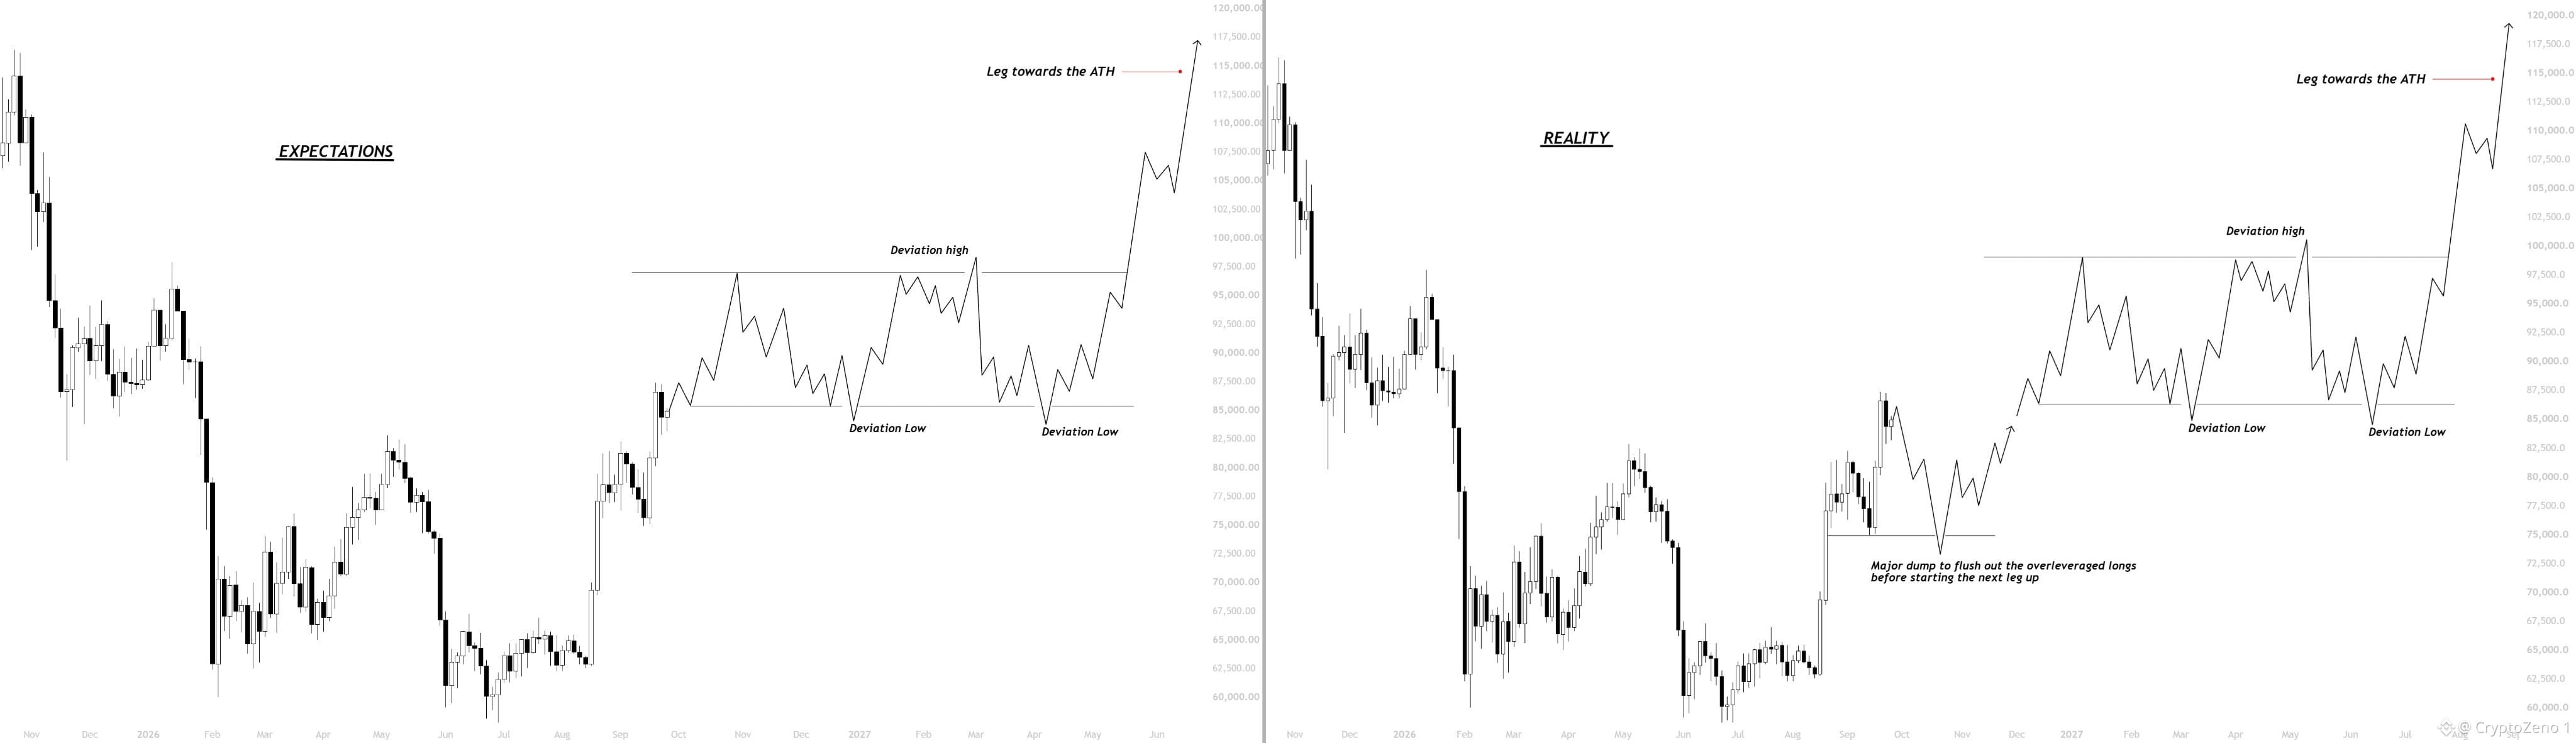
$BTC ارتفع السعر فوق 83 ألف وبدأ الناس الآن في استهداف 100 ألف دون أي تصحيح،
كامل تجمع الـ CT يتوقع منا أن نكوّن مباشرة نطاق التراكم الضخم ثم نبدأ المرحلة باتجاه القمة التاريخية (ATH)،
لكن مجددًا، لا شيء يسير كما تخطط له الأغلبية في هذه الأسواق،
والواقع بالتأكيد سيكون مختلفًا جدًا، خصوصًا مع كل هذا الـ FOMO الذي نراه حول القمة المحلية.
أتوقع أن يقوم السعر أولًا بتصفية/إخراج الصفقات الطويلة المفرطة الرافعة والمندفعة (overleverage/fomo longs) حتى 75 ألف،
ثم يواصل الصعود للمرحلة التالية إلى 95-100 ألف ويكوّن هناك نطاق التراكم الضخم قبل الذهاب إلى ATH.
بشكل عام، تظل لديّ النظرة هبوطية (bearish) حتى نرى تصفية السعر وصولًا إلى 75 ألف. #BTC Price Analysis# #Macro Insights#
$BTC ارتفع السعر فوق 83 ألف وبدأ الناس الآن في استهداف 100 ألف دون أي تصحيح،
كامل تجمع الـ CT يتوقع منا أن نكوّن مباشرة نطاق التراكم الضخم ثم نبدأ المرحلة باتجاه القمة التاريخية (ATH)،
لكن مجددًا، لا شيء يسير كما تخطط له الأغلبية في هذه الأسواق،
والواقع بالتأكيد سيكون مختلفًا جدًا، خصوصًا مع كل هذا الـ FOMO الذي نراه حول القمة المحلية.
أتوقع أن يقوم السعر أولًا بتصفية/إخراج الصفقات الطويلة المفرطة الرافعة والمندفعة (overleverage/fomo longs) حتى 75 ألف،
ثم يواصل الصعود للمرحلة التالية إلى 95-100 ألف ويكوّن هناك نطاق التراكم الضخم قبل الذهاب إلى ATH.
بشكل عام، تظل لديّ النظرة هبوطية (bearish) حتى نرى تصفية السعر وصولًا إلى 75 ألف. #BTC Price Analysis# #Macro Insights#
كامل تجمع الـ CT يتوقع منا أن نكوّن مباشرة نطاق التراكم الضخم ثم نبدأ المرحلة باتجاه القمة التاريخية (ATH)،
لكن مجددًا، لا شيء يسير كما تخطط له الأغلبية في هذه الأسواق،
والواقع بالتأكيد سيكون مختلفًا جدًا، خصوصًا مع كل هذا الـ FOMO الذي نراه حول القمة المحلية.
أتوقع أن يقوم السعر أولًا بتصفية/إخراج الصفقات الطويلة المفرطة الرافعة والمندفعة (overleverage/fomo longs) حتى 75 ألف،
ثم يواصل الصعود للمرحلة التالية إلى 95-100 ألف ويكوّن هناك نطاق التراكم الضخم قبل الذهاب إلى ATH.
بشكل عام، تظل لديّ النظرة هبوطية (bearish) حتى نرى تصفية السعر وصولًا إلى 75 ألف. #BTC Price Analysis# #Macro Insights#
78
·
--
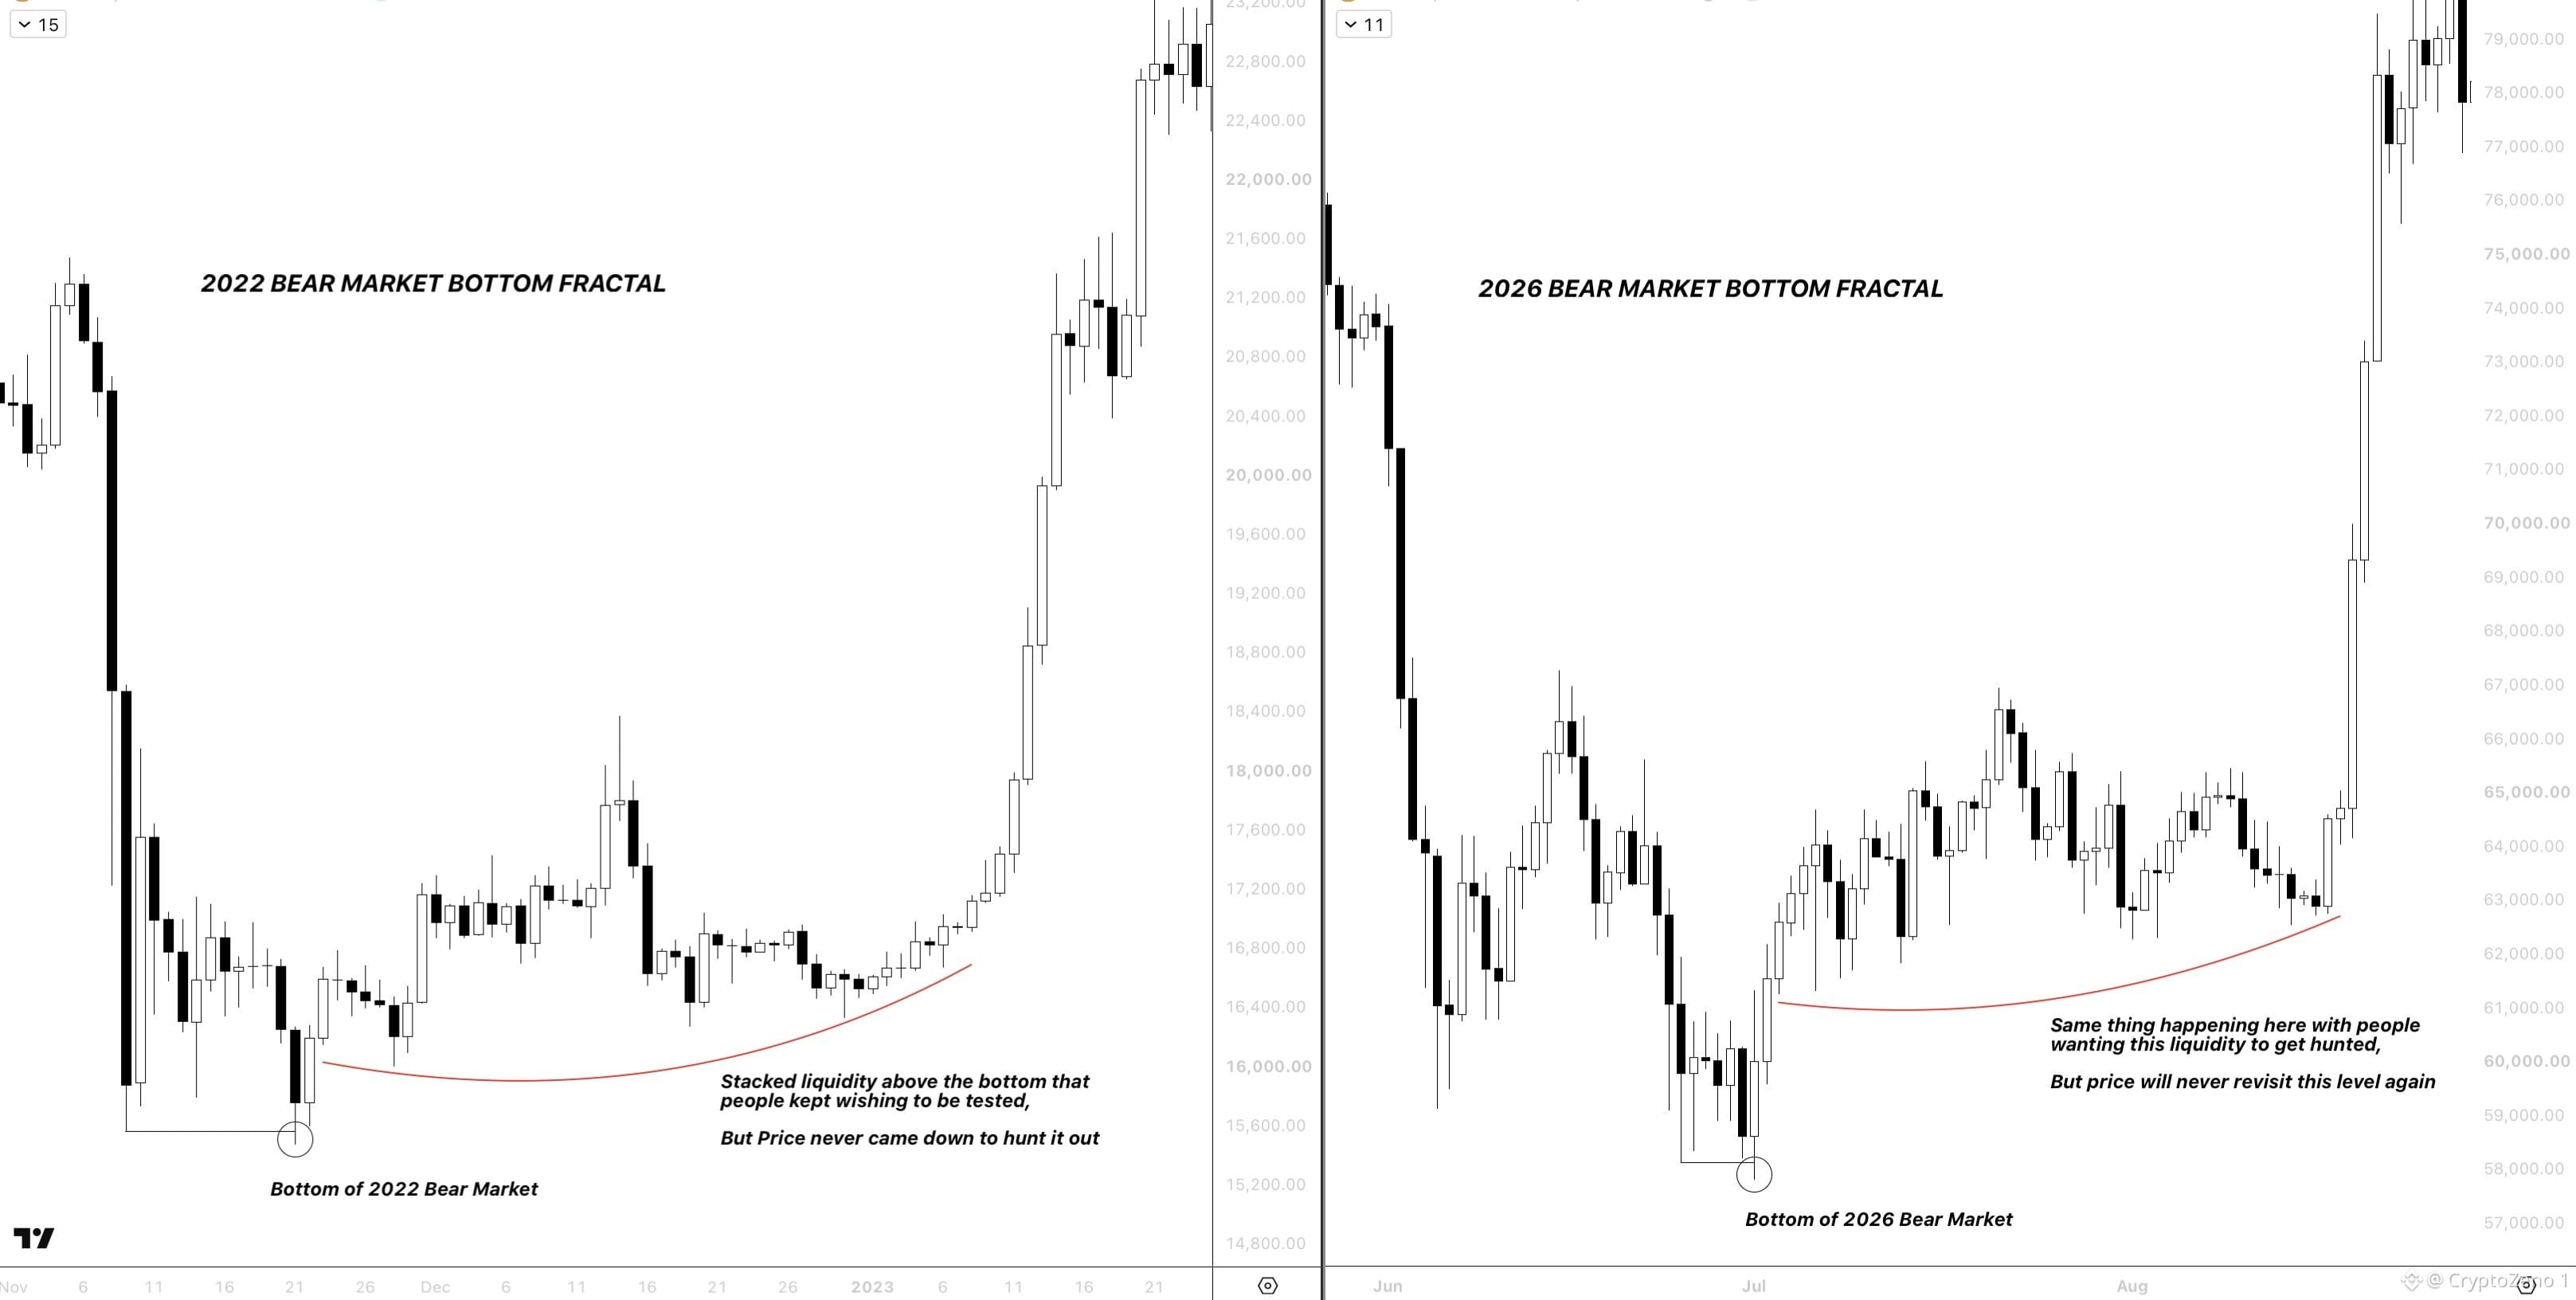
$BTC إليك لماذا أعتقد أن السعر لن يكوّن قاعًا أدنى آخر،
كثيرون يستهدفون الكتلة الهائلة من السيولة المتراكمة حول منطقة الستينات،
لكن إذا قارنّا بنية قاع سوقنا الهابط الحالي ببنية قاع آخر سوق هابط،
ستجد أننا شكّلنا بنية قاع متشابهة جدًا، وكان لدينا أيضًا قيعان غير مُستَكشَفة هناك، أي سيولة متراكمة كذلك،
ولكن مرة أخرى، لم يرجع السعر إلى تلك المستويات للمسح، واستمر فقط في الارتفاع بعد عملية هبوط/تفريغ كبيرة.
الخلاصة عمومًا هي أنه إذا كنتم تتمنّون تشكيل قيعان جديدة فقط لأنكم خارج السوق، فهذا يعني أنكم لن تحصلوا على ذلك.
بدلًا من الانتظار لمستوى لن يأتي، انتظروا التصحيح/الارتداد الرئيسي التالي وأضيفوا هناك، لأن لدينا ما يزال كامل المسار/الرحلة المتبقية. #BTC Price Analysis# #Macro Insights#
$BTC إليك لماذا أعتقد أن السعر لن يكوّن قاعًا أدنى آخر،
كثيرون يستهدفون الكتلة الهائلة من السيولة المتراكمة حول منطقة الستينات،
لكن إذا قارنّا بنية قاع سوقنا الهابط الحالي ببنية قاع آخر سوق هابط،
ستجد أننا شكّلنا بنية قاع متشابهة جدًا، وكان لدينا أيضًا قيعان غير مُستَكشَفة هناك، أي سيولة متراكمة كذلك،
ولكن مرة أخرى، لم يرجع السعر إلى تلك المستويات للمسح، واستمر فقط في الارتفاع بعد عملية هبوط/تفريغ كبيرة.
الخلاصة عمومًا هي أنه إذا كنتم تتمنّون تشكيل قيعان جديدة فقط لأنكم خارج السوق، فهذا يعني أنكم لن تحصلوا على ذلك.
بدلًا من الانتظار لمستوى لن يأتي، انتظروا التصحيح/الارتداد الرئيسي التالي وأضيفوا هناك، لأن لدينا ما يزال كامل المسار/الرحلة المتبقية. #BTC Price Analysis# #Macro Insights#
كثيرون يستهدفون الكتلة الهائلة من السيولة المتراكمة حول منطقة الستينات،
لكن إذا قارنّا بنية قاع سوقنا الهابط الحالي ببنية قاع آخر سوق هابط،
ستجد أننا شكّلنا بنية قاع متشابهة جدًا، وكان لدينا أيضًا قيعان غير مُستَكشَفة هناك، أي سيولة متراكمة كذلك،
ولكن مرة أخرى، لم يرجع السعر إلى تلك المستويات للمسح، واستمر فقط في الارتفاع بعد عملية هبوط/تفريغ كبيرة.
الخلاصة عمومًا هي أنه إذا كنتم تتمنّون تشكيل قيعان جديدة فقط لأنكم خارج السوق، فهذا يعني أنكم لن تحصلوا على ذلك.
بدلًا من الانتظار لمستوى لن يأتي، انتظروا التصحيح/الارتداد الرئيسي التالي وأضيفوا هناك، لأن لدينا ما يزال كامل المسار/الرحلة المتبقية. #BTC Price Analysis# #Macro Insights#
34
·
--
عرض الترجمة
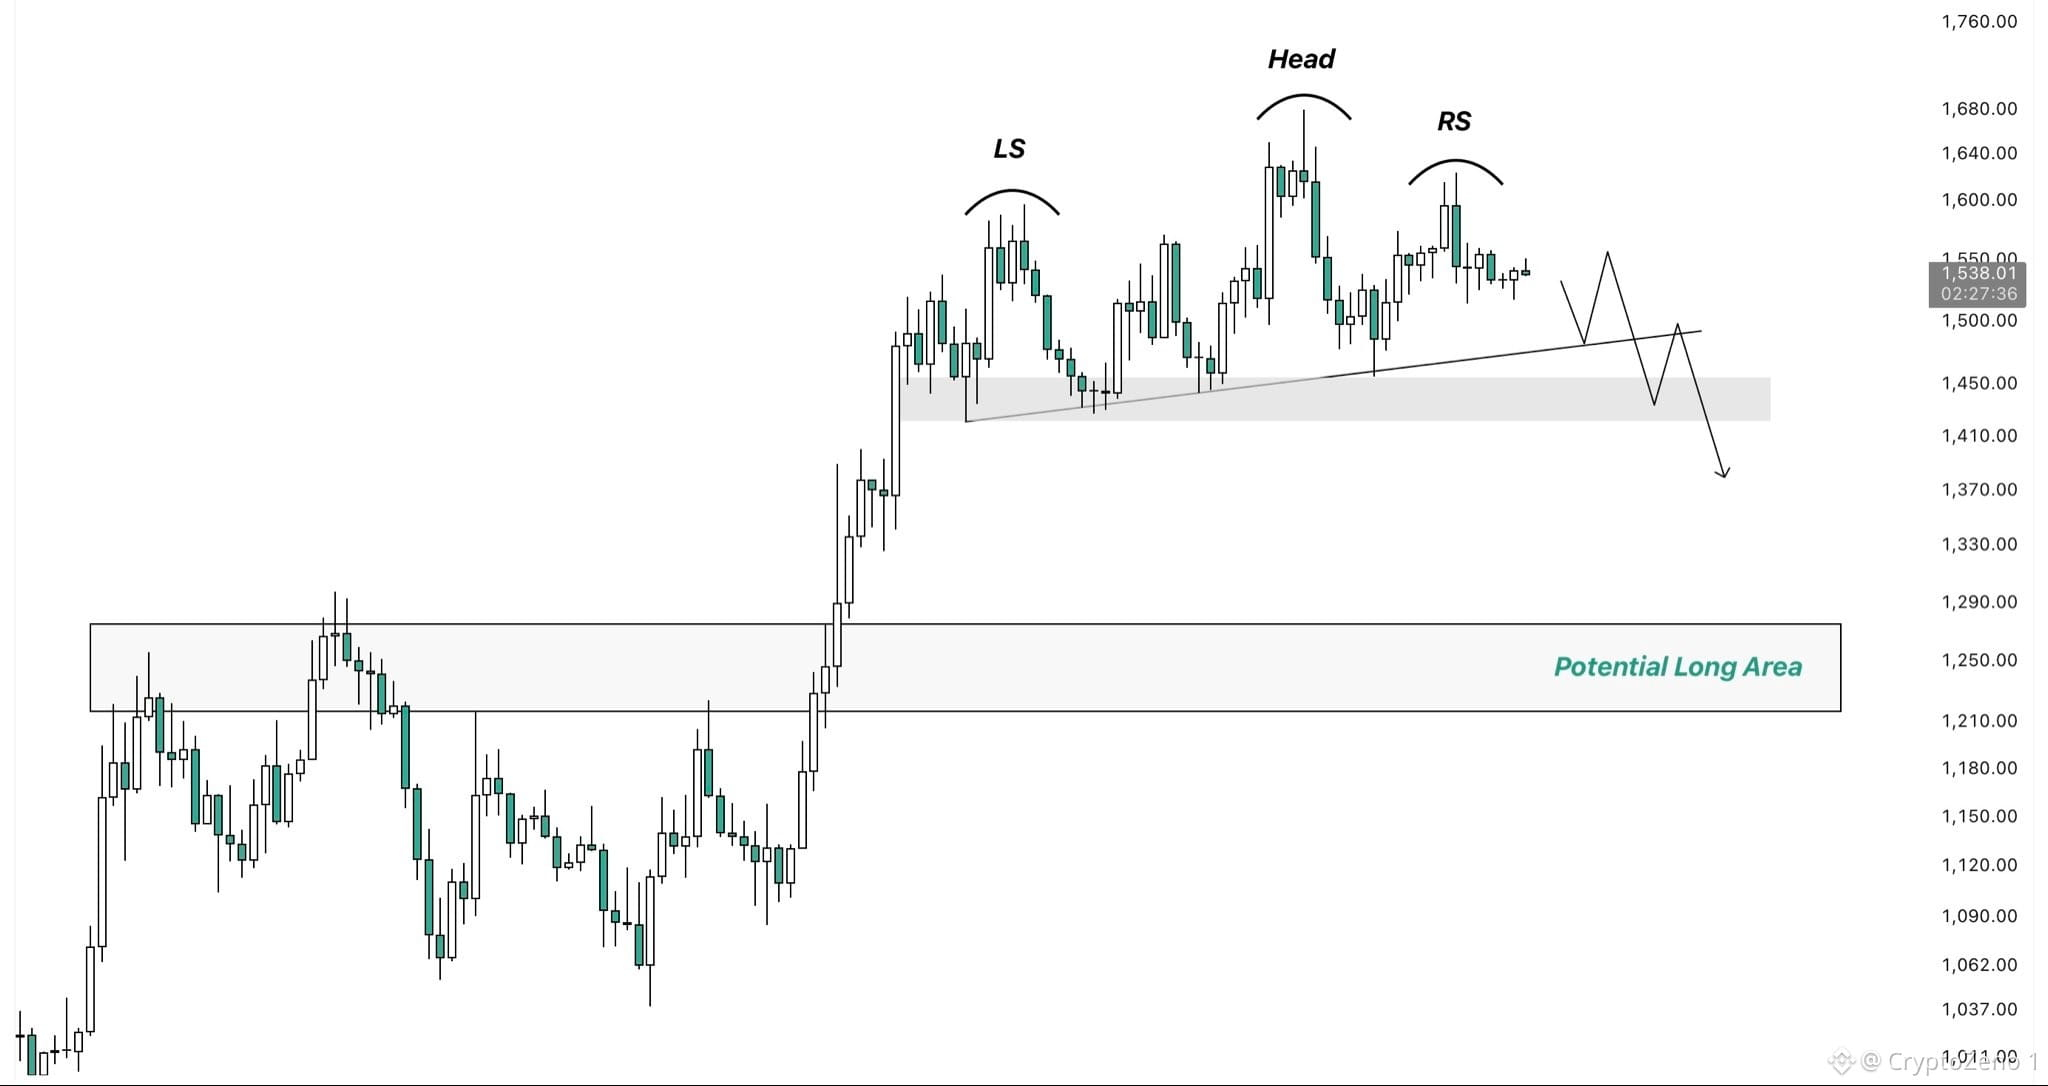
$ZEC
We got a potential short setup forming here.
Price is currently developing a pretty clean head and shoulders pattern right above a key support area.
If we get a confirmed breakdown below the neckline/support, I’ll be looking for a short targeting the $1,200–$1,300 region.
That area lines up with the highs of the previous range we recently broke out from, making it an interesting level to watch for a reaction.
A retest there could then offer a solid long opportunity for the next expansion to the upside. #BTC Price Analysis# #Macro Insights#
$ZEC
We got a potential short setup forming here.
Price is currently developing a pretty clean head and shoulders pattern right above a key support area.
If we get a confirmed breakdown below the neckline/support, I’ll be looking for a short targeting the $1,200–$1,300 region.
That area lines up with the highs of the previous range we recently broke out from, making it an interesting level to watch for a reaction.
A retest there could then offer a solid long opportunity for the next expansion to the upside. #BTC Price Analysis# #Macro Insights#
We got a potential short setup forming here.
Price is currently developing a pretty clean head and shoulders pattern right above a key support area.
If we get a confirmed breakdown below the neckline/support, I’ll be looking for a short targeting the $1,200–$1,300 region.
That area lines up with the highs of the previous range we recently broke out from, making it an interesting level to watch for a reaction.
A retest there could then offer a solid long opportunity for the next expansion to the upside. #BTC Price Analysis# #Macro Insights#
37
·
--
عرض الترجمة
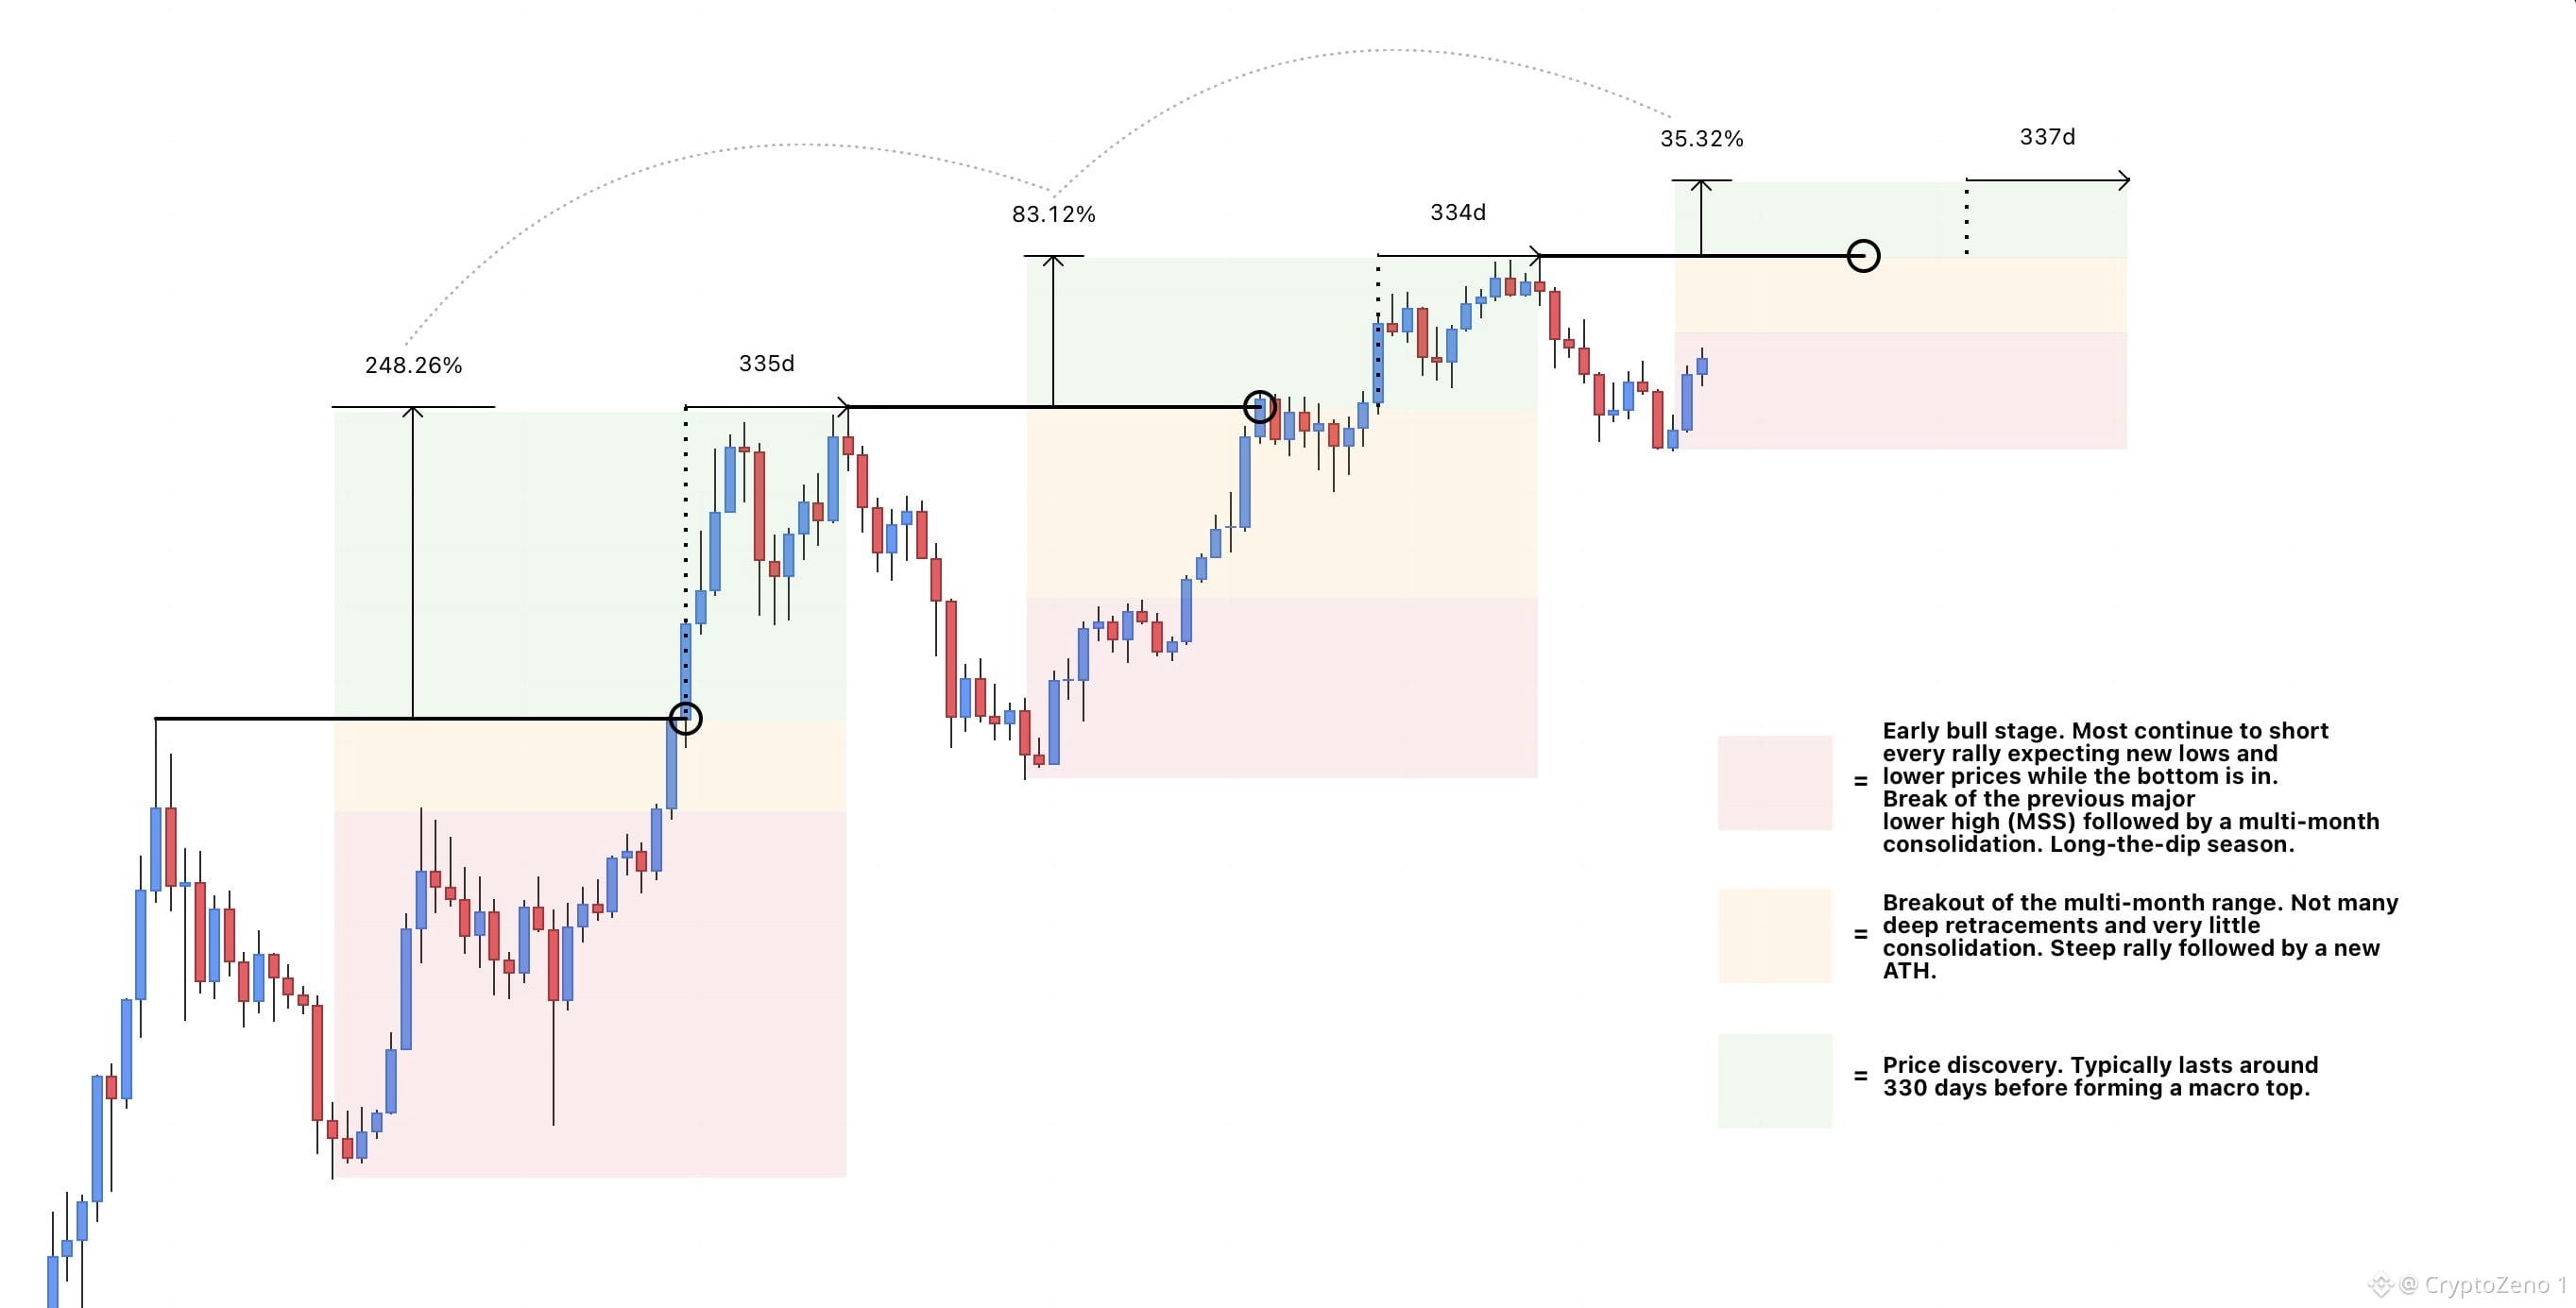
$BTC It'll be obvious in hindsight...
These stages are all the same, just evolving with each cycle.
Long the dips and enjoy the rally.🎲 #BTC Price Analysis# #Macro Insights#
$BTC It'll be obvious in hindsight...
These stages are all the same, just evolving with each cycle.
Long the dips and enjoy the rally.🎲 #BTC Price Analysis# #Macro Insights#
These stages are all the same, just evolving with each cycle.
Long the dips and enjoy the rally.🎲 #BTC Price Analysis# #Macro Insights#
63
·
--
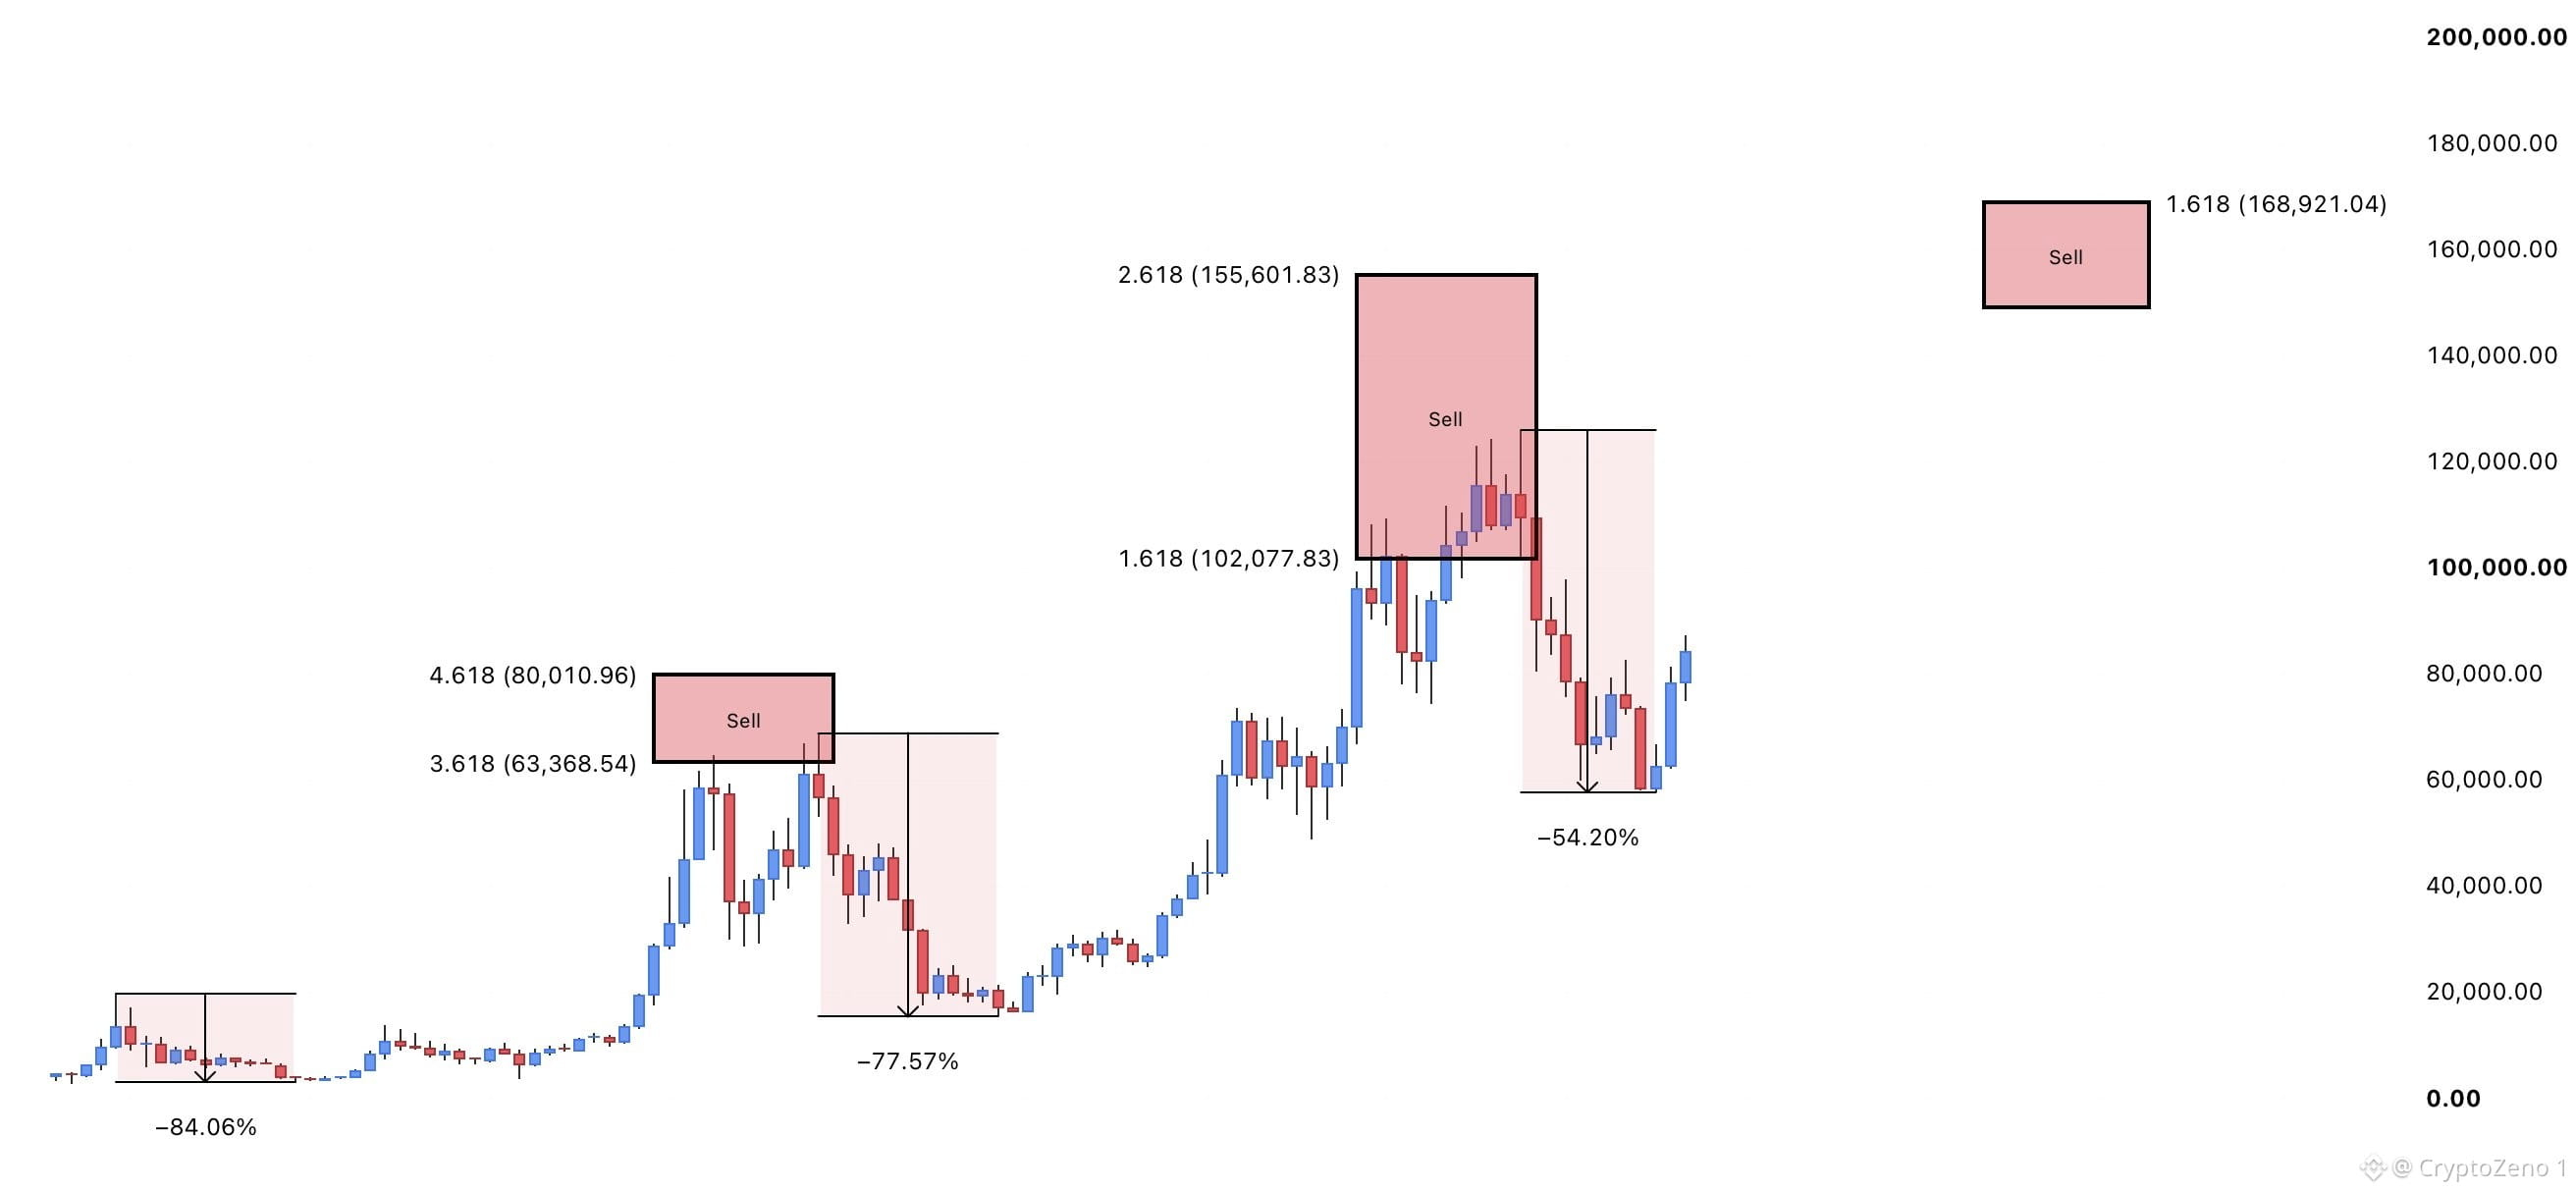
$BTC كل قمة سعرية (ATH) كانت أعمق بشكل أقل من السابقة، وقد تشكلت منطقة أفضل للبيع بشكل ثابت بين امتدادين مختلفين من امتدادات فيبوناتشي .618.
بلغ سقف السوق الصاعد السابق بين امتدادات 2.618 و1.618، لكن كان أقرب بكثير إلى 1.618.
قد يسلك هذا الدورة مسارًا مشابهًا.
لماذا؟
يتمثل الاختلاف الرئيسي بين هذه الدورة والدورات السابقة في أن قاع السوق الهابط كان أعمق بنسبة ~20–30% أقل.
هذا يعني أن هناك حاجة إلى صعود أقل بكثير للوصول إلى امتداد 1.618.
إذا استمر السعر في اتباع النمط نفسه، فمن المتوقع أن يكون امتداد 1.618 أقرب بكثير إلى القمة الكبرى (macro top) النهائية.
يتماشى ذلك أيضًا مع نظرية تناقص العوائد عبر كل دورة، مما يضيف عامل تلاقي آخر (confluence) إلى منطقة $160K.
هناك أتوقع أن تتشكل القمة الكبرى التالية. #BTC Price Analysis# #Macro Insights#
$BTC كل قمة سعرية (ATH) كانت أعمق بشكل أقل من السابقة، وقد تشكلت منطقة أفضل للبيع بشكل ثابت بين امتدادين مختلفين من امتدادات فيبوناتشي .618.
بلغ سقف السوق الصاعد السابق بين امتدادات 2.618 و1.618، لكن كان أقرب بكثير إلى 1.618.
قد يسلك هذا الدورة مسارًا مشابهًا.
لماذا؟
يتمثل الاختلاف الرئيسي بين هذه الدورة والدورات السابقة في أن قاع السوق الهابط كان أعمق بنسبة ~20–30% أقل.
هذا يعني أن هناك حاجة إلى صعود أقل بكثير للوصول إلى امتداد 1.618.
إذا استمر السعر في اتباع النمط نفسه، فمن المتوقع أن يكون امتداد 1.618 أقرب بكثير إلى القمة الكبرى (macro top) النهائية.
يتماشى ذلك أيضًا مع نظرية تناقص العوائد عبر كل دورة، مما يضيف عامل تلاقي آخر (confluence) إلى منطقة $160K.
هناك أتوقع أن تتشكل القمة الكبرى التالية. #BTC Price Analysis# #Macro Insights#
بلغ سقف السوق الصاعد السابق بين امتدادات 2.618 و1.618، لكن كان أقرب بكثير إلى 1.618.
قد يسلك هذا الدورة مسارًا مشابهًا.
لماذا؟
يتمثل الاختلاف الرئيسي بين هذه الدورة والدورات السابقة في أن قاع السوق الهابط كان أعمق بنسبة ~20–30% أقل.
هذا يعني أن هناك حاجة إلى صعود أقل بكثير للوصول إلى امتداد 1.618.
إذا استمر السعر في اتباع النمط نفسه، فمن المتوقع أن يكون امتداد 1.618 أقرب بكثير إلى القمة الكبرى (macro top) النهائية.
يتماشى ذلك أيضًا مع نظرية تناقص العوائد عبر كل دورة، مما يضيف عامل تلاقي آخر (confluence) إلى منطقة $160K.
هناك أتوقع أن تتشكل القمة الكبرى التالية. #BTC Price Analysis# #Macro Insights#
43
·
--
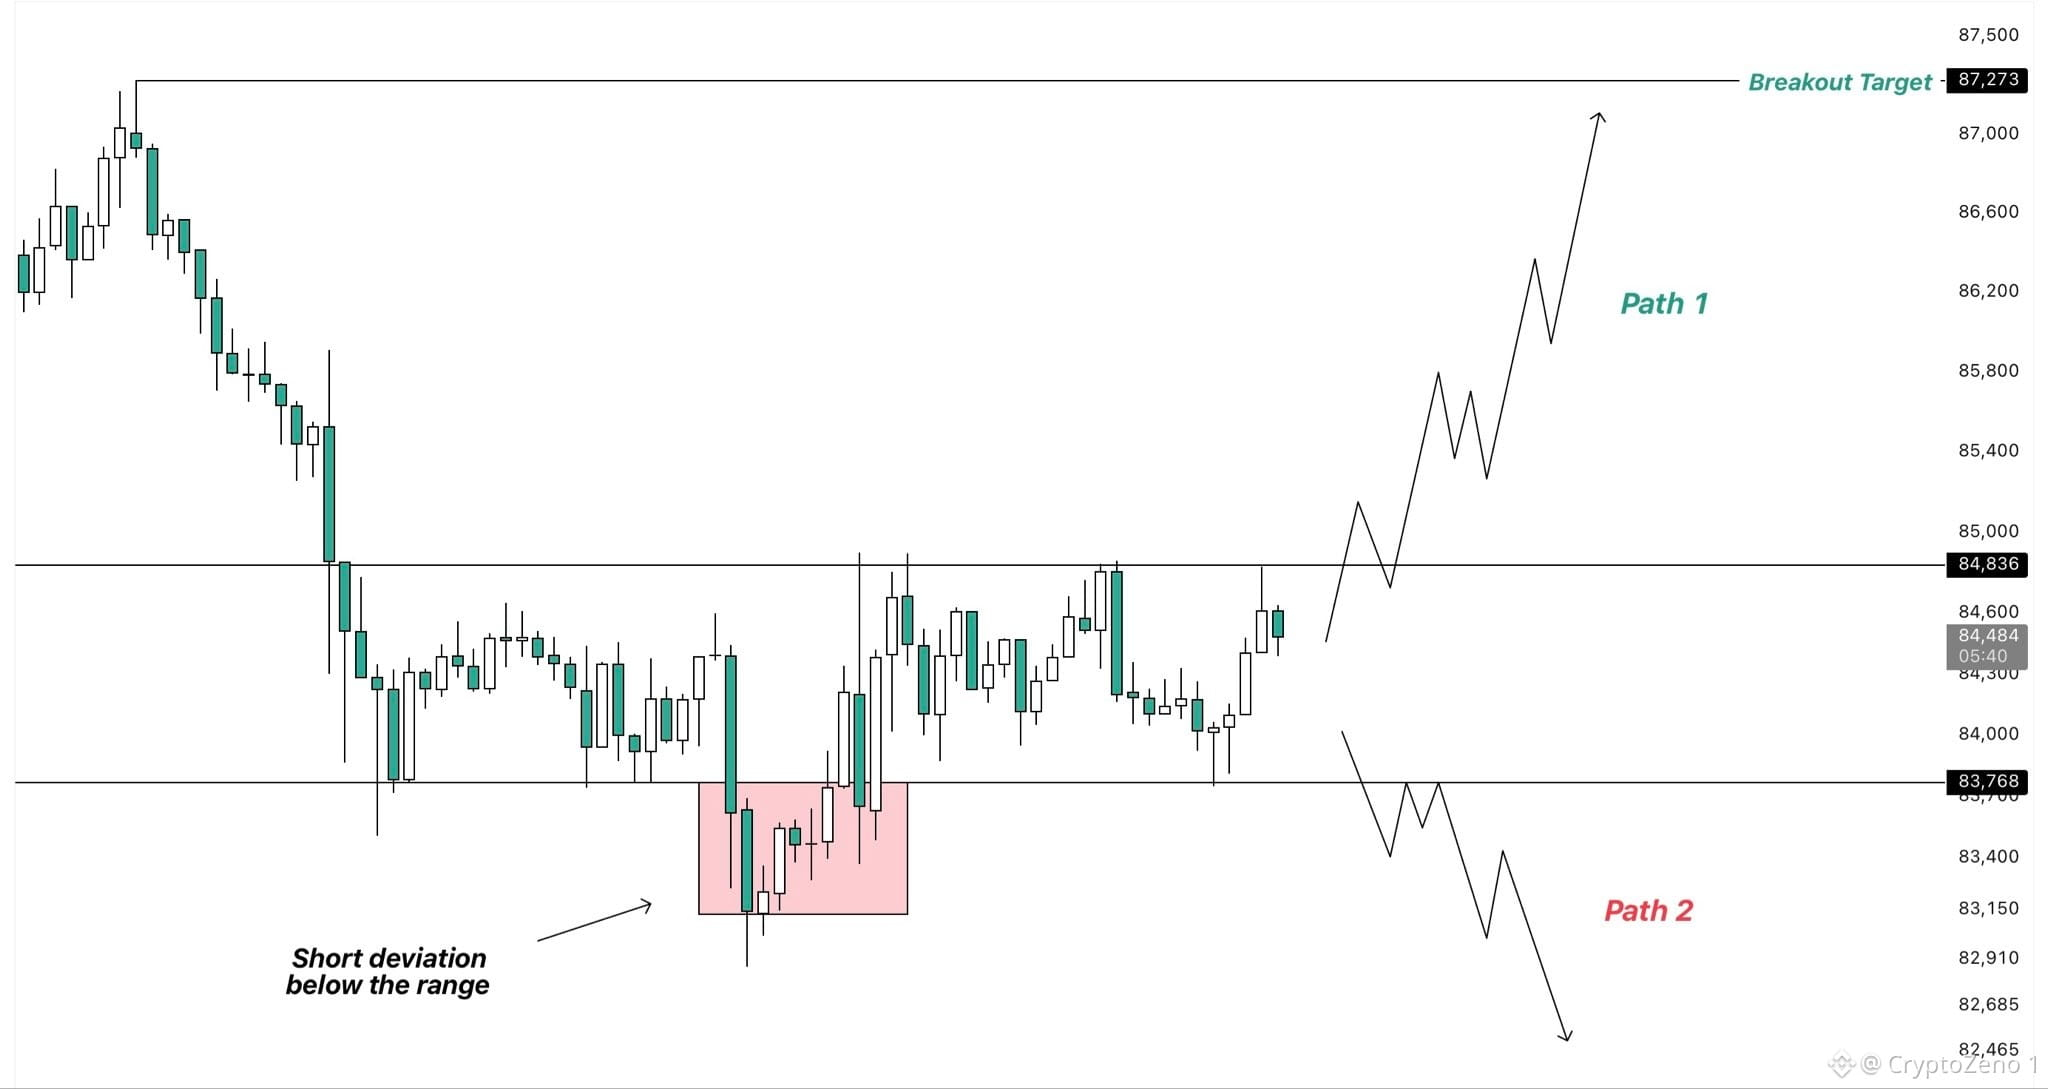
$BTC يتقلص حاليًا داخل نطاق LTF الضيق جدًا.
الآن إمّا نرى المزيد من التماسك اليوم، والذي غالبًا ما يستمر حتى خلال عطلة نهاية الأسبوع،
أو أن السعر يخترق صعودًا/هبوطًا ونشاهد حركة حاسمة أخرى في أحد الاتجاهين.
كلما استمر تماسك BTC لفترة أطول، زادت احتمالية أن يكون الاختراق النهائي أكثر حسمًا. لذلك إذا كان ذلك هو الحال، فقد نرى حركة حادة أخرى تتجه إلى الأسبوع المقبل.
اختراق القمم من المرجح أن يعيدنا باتجاه القمة المحلية عند حوالي $87K وأن يزيد فرص المزيد من الصعود.
من ناحية أخرى، فإن الانخفاض سيُهبط بالسعر لإعادة اختبار القمة السابقة على إطار زمني HTF، أو ربما حتى التمدد إلى نطاق $80k–$82k.
الانخفاض هو السيناريو الذي أنا مهتم به حاليًا أكثر، لأنه سيفعّل سيناريوي الأول للشراء/الـlong.
إذا اخترق BTC للأعلى بدلًا من ذلك، فسأظل متحيّدًا ببساطة وأنتظر الفرصة الجيدة التالية التي ستظهر. #BTC Price Analysis# #Macro Insights#
$BTC يتقلص حاليًا داخل نطاق LTF الضيق جدًا.
الآن إمّا نرى المزيد من التماسك اليوم، والذي غالبًا ما يستمر حتى خلال عطلة نهاية الأسبوع،
أو أن السعر يخترق صعودًا/هبوطًا ونشاهد حركة حاسمة أخرى في أحد الاتجاهين.
كلما استمر تماسك BTC لفترة أطول، زادت احتمالية أن يكون الاختراق النهائي أكثر حسمًا. لذلك إذا كان ذلك هو الحال، فقد نرى حركة حادة أخرى تتجه إلى الأسبوع المقبل.
اختراق القمم من المرجح أن يعيدنا باتجاه القمة المحلية عند حوالي $87K وأن يزيد فرص المزيد من الصعود.
من ناحية أخرى، فإن الانخفاض سيُهبط بالسعر لإعادة اختبار القمة السابقة على إطار زمني HTF، أو ربما حتى التمدد إلى نطاق $80k–$82k.
الانخفاض هو السيناريو الذي أنا مهتم به حاليًا أكثر، لأنه سيفعّل سيناريوي الأول للشراء/الـlong.
إذا اخترق BTC للأعلى بدلًا من ذلك، فسأظل متحيّدًا ببساطة وأنتظر الفرصة الجيدة التالية التي ستظهر. #BTC Price Analysis# #Macro Insights#
الآن إمّا نرى المزيد من التماسك اليوم، والذي غالبًا ما يستمر حتى خلال عطلة نهاية الأسبوع،
أو أن السعر يخترق صعودًا/هبوطًا ونشاهد حركة حاسمة أخرى في أحد الاتجاهين.
كلما استمر تماسك BTC لفترة أطول، زادت احتمالية أن يكون الاختراق النهائي أكثر حسمًا. لذلك إذا كان ذلك هو الحال، فقد نرى حركة حادة أخرى تتجه إلى الأسبوع المقبل.
اختراق القمم من المرجح أن يعيدنا باتجاه القمة المحلية عند حوالي $87K وأن يزيد فرص المزيد من الصعود.
من ناحية أخرى، فإن الانخفاض سيُهبط بالسعر لإعادة اختبار القمة السابقة على إطار زمني HTF، أو ربما حتى التمدد إلى نطاق $80k–$82k.
الانخفاض هو السيناريو الذي أنا مهتم به حاليًا أكثر، لأنه سيفعّل سيناريوي الأول للشراء/الـlong.
إذا اخترق BTC للأعلى بدلًا من ذلك، فسأظل متحيّدًا ببساطة وأنتظر الفرصة الجيدة التالية التي ستظهر. #BTC Price Analysis# #Macro Insights#
57
·
--
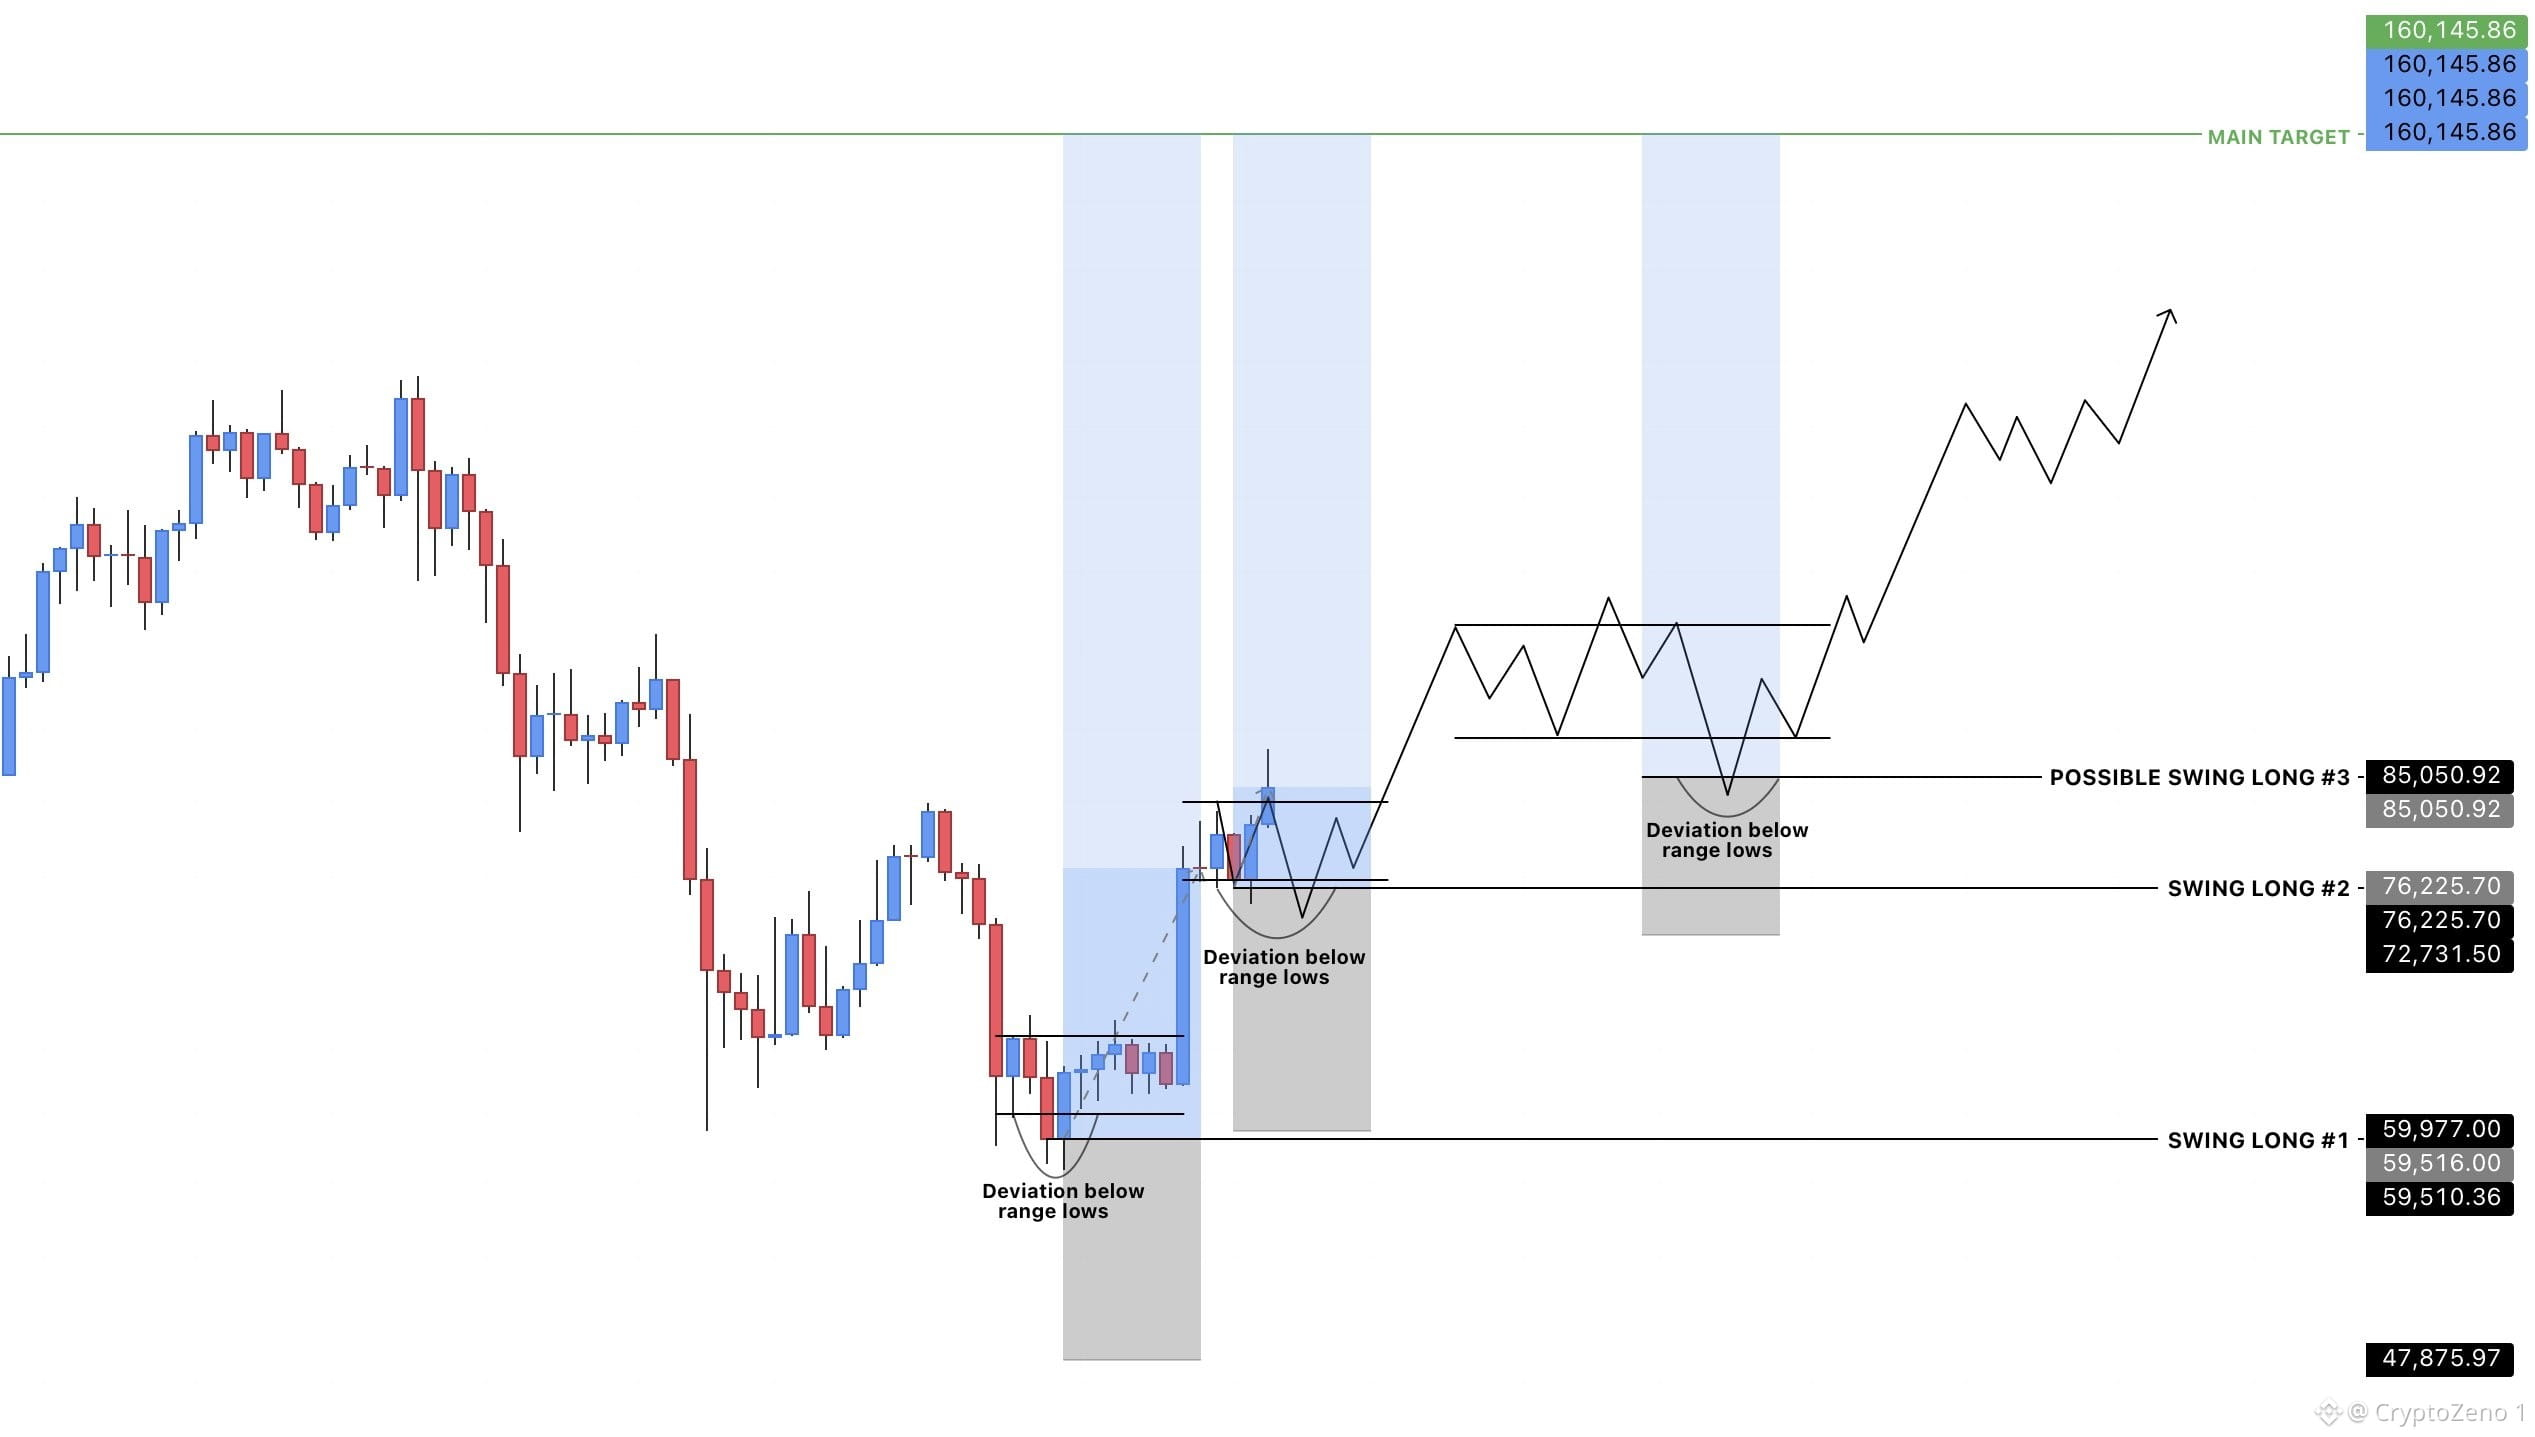
$BTC الأمر بسيط مثل التداول مع الاتجاه...
الآن، كل ما عليك هو الانتظار لمعرفة ماذا سيفعل السعر قبل الدخول في صفقة Swing Long أخرى، بهدف التقاط الموجة التالية باتجاه قمة ATH جديدة.
من المتوقع أن تأتي الفرصة الرئيسية التالية بعد أن يُشكّل السعر نطاقًا يمتد لعدة أشهر ثم يهبط تحت أدنى حدود هذا النطاق.
ما زالت أمامنا سنتان قبل أن يتشكل القمة على المستوى الكلي (macro top). وقت كافٍ لتحقيق الأرباح من صفقات الـ swing long، لكن الدخول في المناطق الرئيسية هو ما يضاعف تلك الأرباح.
بعد التحركات الكبيرة، يحتاج السعر دائمًا إلى وقت ليستقر ويتحول إلى نطاق. يمكن أن تستمر هذه النطاقات من بضعة أسابيع إلى عدة أشهر.
غالبًا ما تأتي أفضل نقاط الدخول عندما ينحرف السعر نزولًا تحت أدنى حدود النطاق.
تداول مع الاتجاه. انتظر الإعداد.🎲 #BTC Price Analysis# #Macro Insights#
$BTC الأمر بسيط مثل التداول مع الاتجاه...
الآن، كل ما عليك هو الانتظار لمعرفة ماذا سيفعل السعر قبل الدخول في صفقة Swing Long أخرى، بهدف التقاط الموجة التالية باتجاه قمة ATH جديدة.
من المتوقع أن تأتي الفرصة الرئيسية التالية بعد أن يُشكّل السعر نطاقًا يمتد لعدة أشهر ثم يهبط تحت أدنى حدود هذا النطاق.
ما زالت أمامنا سنتان قبل أن يتشكل القمة على المستوى الكلي (macro top). وقت كافٍ لتحقيق الأرباح من صفقات الـ swing long، لكن الدخول في المناطق الرئيسية هو ما يضاعف تلك الأرباح.
بعد التحركات الكبيرة، يحتاج السعر دائمًا إلى وقت ليستقر ويتحول إلى نطاق. يمكن أن تستمر هذه النطاقات من بضعة أسابيع إلى عدة أشهر.
غالبًا ما تأتي أفضل نقاط الدخول عندما ينحرف السعر نزولًا تحت أدنى حدود النطاق.
تداول مع الاتجاه. انتظر الإعداد.🎲 #BTC Price Analysis# #Macro Insights#
الآن، كل ما عليك هو الانتظار لمعرفة ماذا سيفعل السعر قبل الدخول في صفقة Swing Long أخرى، بهدف التقاط الموجة التالية باتجاه قمة ATH جديدة.
من المتوقع أن تأتي الفرصة الرئيسية التالية بعد أن يُشكّل السعر نطاقًا يمتد لعدة أشهر ثم يهبط تحت أدنى حدود هذا النطاق.
ما زالت أمامنا سنتان قبل أن يتشكل القمة على المستوى الكلي (macro top). وقت كافٍ لتحقيق الأرباح من صفقات الـ swing long، لكن الدخول في المناطق الرئيسية هو ما يضاعف تلك الأرباح.
بعد التحركات الكبيرة، يحتاج السعر دائمًا إلى وقت ليستقر ويتحول إلى نطاق. يمكن أن تستمر هذه النطاقات من بضعة أسابيع إلى عدة أشهر.
غالبًا ما تأتي أفضل نقاط الدخول عندما ينحرف السعر نزولًا تحت أدنى حدود النطاق.
تداول مع الاتجاه. انتظر الإعداد.🎲 #BTC Price Analysis# #Macro Insights#
56
·
--
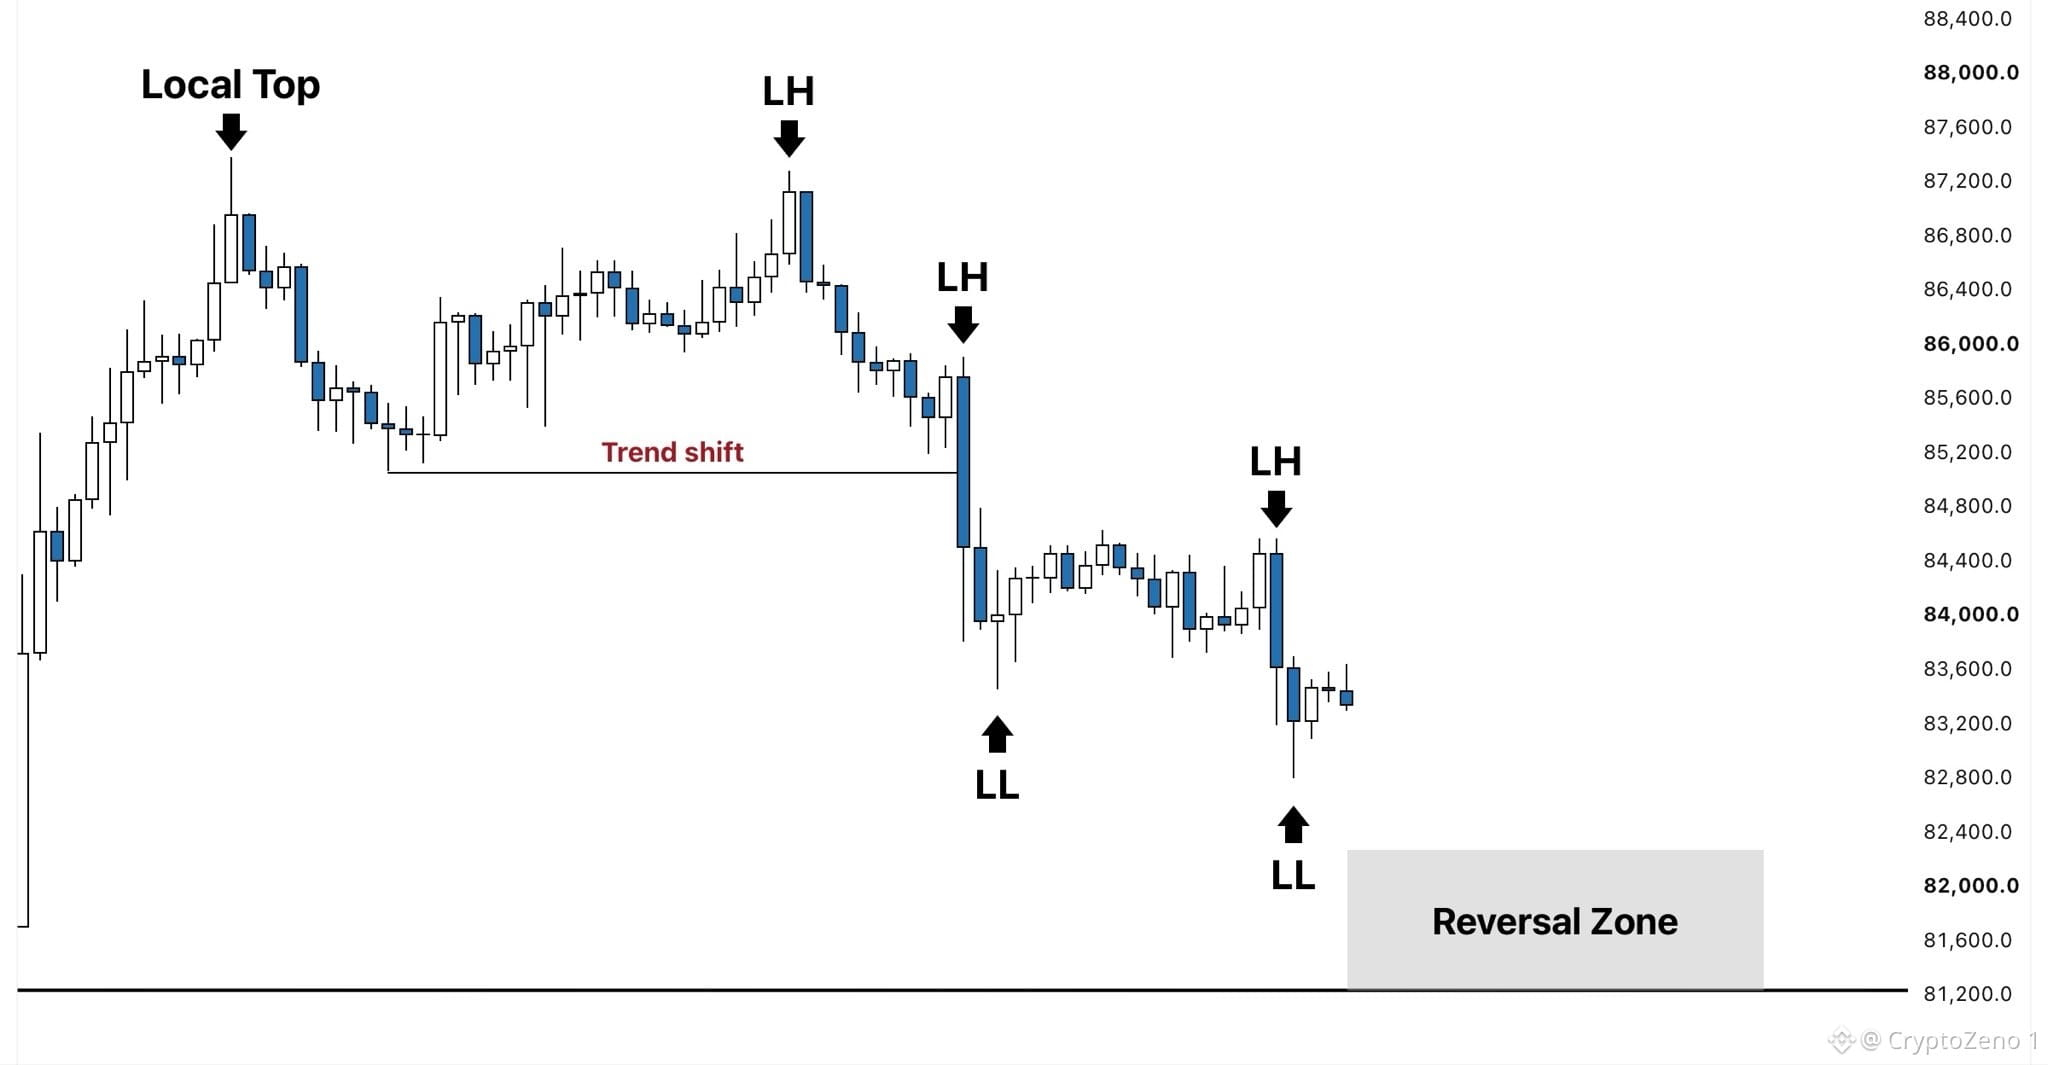
$BTC على الأطر الزمنية المتوسطة، وصلنا إلى القمة ثم انتقلنا من اتجاه صاعد إلى اتجاه هابط.
لقد كسرنا البنية وبدأنا بطباعة قمم وقيعان أدنى.
الآن السعر يقترب من المنطقة التي أتوقع فيها أن يتوقف هذا الاتجاه الهابط ويستمر الاتجاه الصاعد على الإطار الزمني الأعلى.
تلك المنطقة تقع حول 82 ألف.
بمجرد وصولنا إليها، سأبحث عن نمط انعكاس على الأطر الزمنية الأصغر للدخول في صفقة شراء طويلة (Swing Long). #BTC Price Analysis# #Macro Insights# #BNBChain#
$BTC على الأطر الزمنية المتوسطة، وصلنا إلى القمة ثم انتقلنا من اتجاه صاعد إلى اتجاه هابط.
لقد كسرنا البنية وبدأنا بطباعة قمم وقيعان أدنى.
الآن السعر يقترب من المنطقة التي أتوقع فيها أن يتوقف هذا الاتجاه الهابط ويستمر الاتجاه الصاعد على الإطار الزمني الأعلى.
تلك المنطقة تقع حول 82 ألف.
بمجرد وصولنا إليها، سأبحث عن نمط انعكاس على الأطر الزمنية الأصغر للدخول في صفقة شراء طويلة (Swing Long). #BTC Price Analysis# #Macro Insights# #BNBChain#
لقد كسرنا البنية وبدأنا بطباعة قمم وقيعان أدنى.
الآن السعر يقترب من المنطقة التي أتوقع فيها أن يتوقف هذا الاتجاه الهابط ويستمر الاتجاه الصاعد على الإطار الزمني الأعلى.
تلك المنطقة تقع حول 82 ألف.
بمجرد وصولنا إليها، سأبحث عن نمط انعكاس على الأطر الزمنية الأصغر للدخول في صفقة شراء طويلة (Swing Long). #BTC Price Analysis# #Macro Insights# #BNBChain#
86
·
--
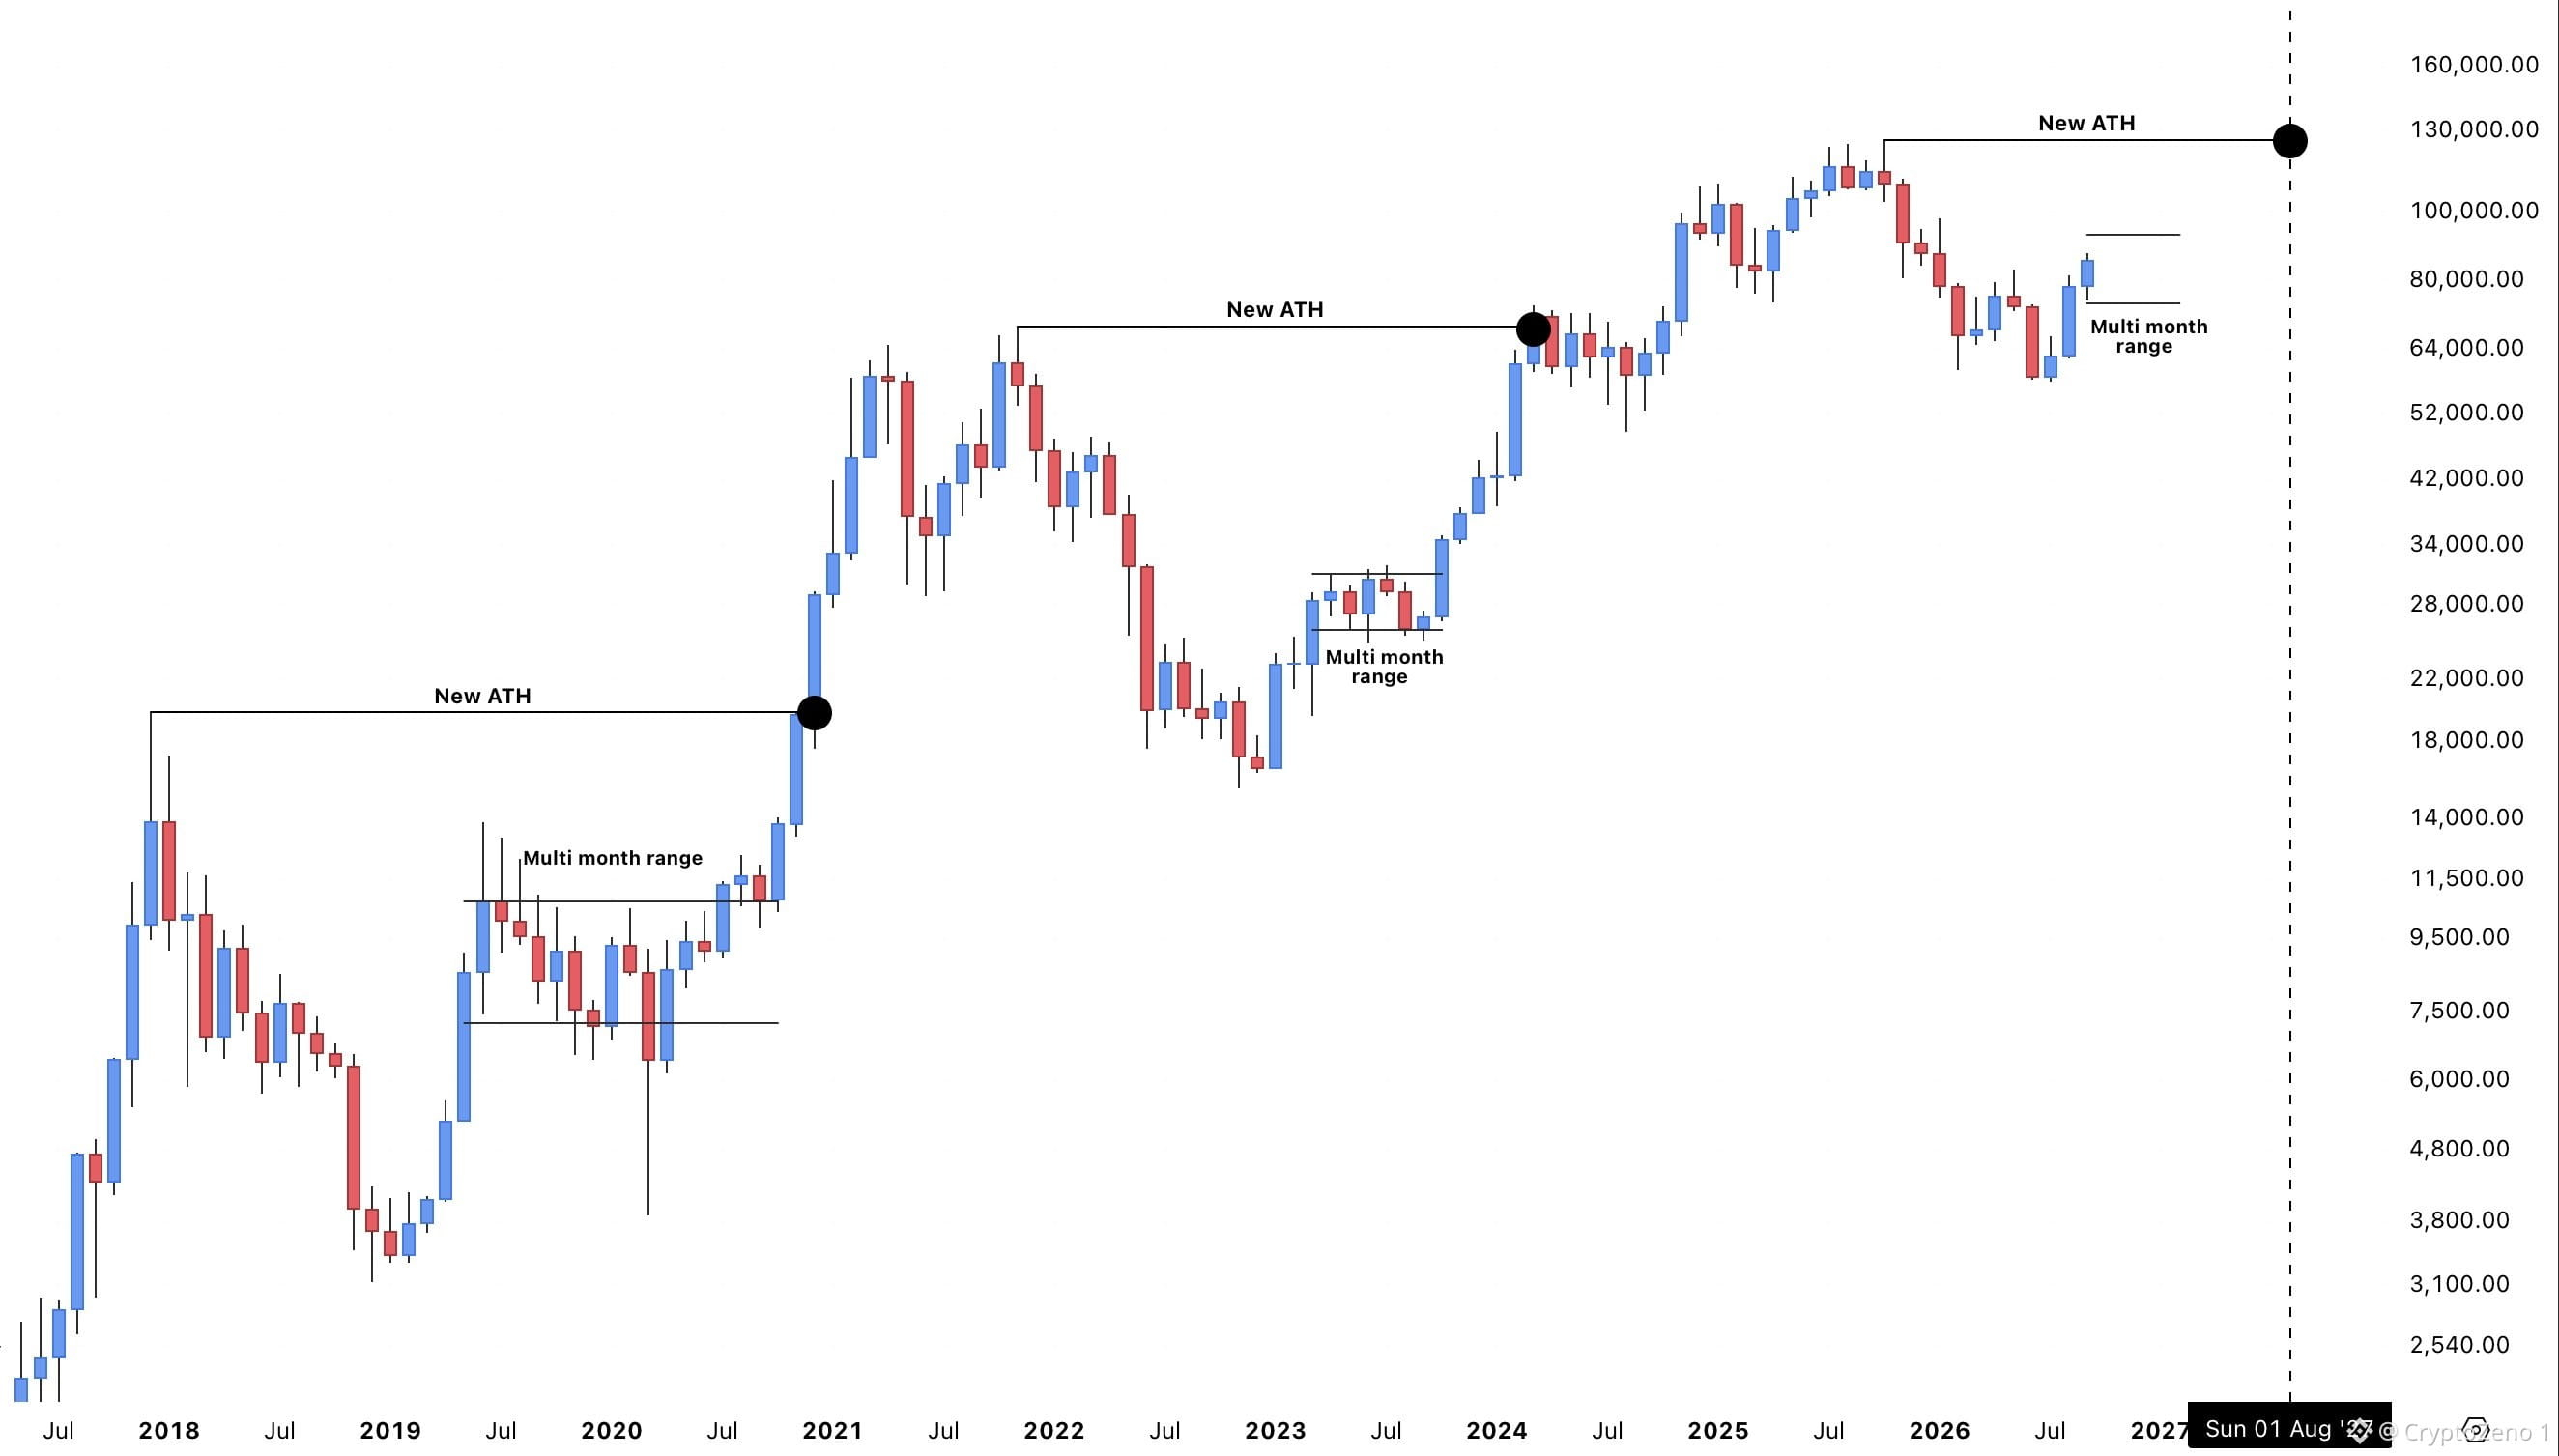
$BTC تذبذب قبل تحقيق قمة سعرية جديدة (ATH)...
إذا تكرر النمط، فمن المرجح أن يتحرك السعر في نطاق خلال عدة أشهر قبل الخطوة الرئيسية التالية للأعلى.
قد يؤدي ذلك إلى تسجيل ATH جديدة حوالي أغسطس 2027. #تحليل_سعر_بيتكوين# #رؤى_اقتصادية_كلية#
$BTC تذبذب قبل تحقيق قمة سعرية جديدة (ATH)...
إذا تكرر النمط، فمن المرجح أن يتحرك السعر في نطاق خلال عدة أشهر قبل الخطوة الرئيسية التالية للأعلى.
قد يؤدي ذلك إلى تسجيل ATH جديدة حوالي أغسطس 2027. #تحليل_سعر_بيتكوين# #رؤى_اقتصادية_كلية#
إذا تكرر النمط، فمن المرجح أن يتحرك السعر في نطاق خلال عدة أشهر قبل الخطوة الرئيسية التالية للأعلى.
قد يؤدي ذلك إلى تسجيل ATH جديدة حوالي أغسطس 2027. #تحليل_سعر_بيتكوين# #رؤى_اقتصادية_كلية#
40
·
--
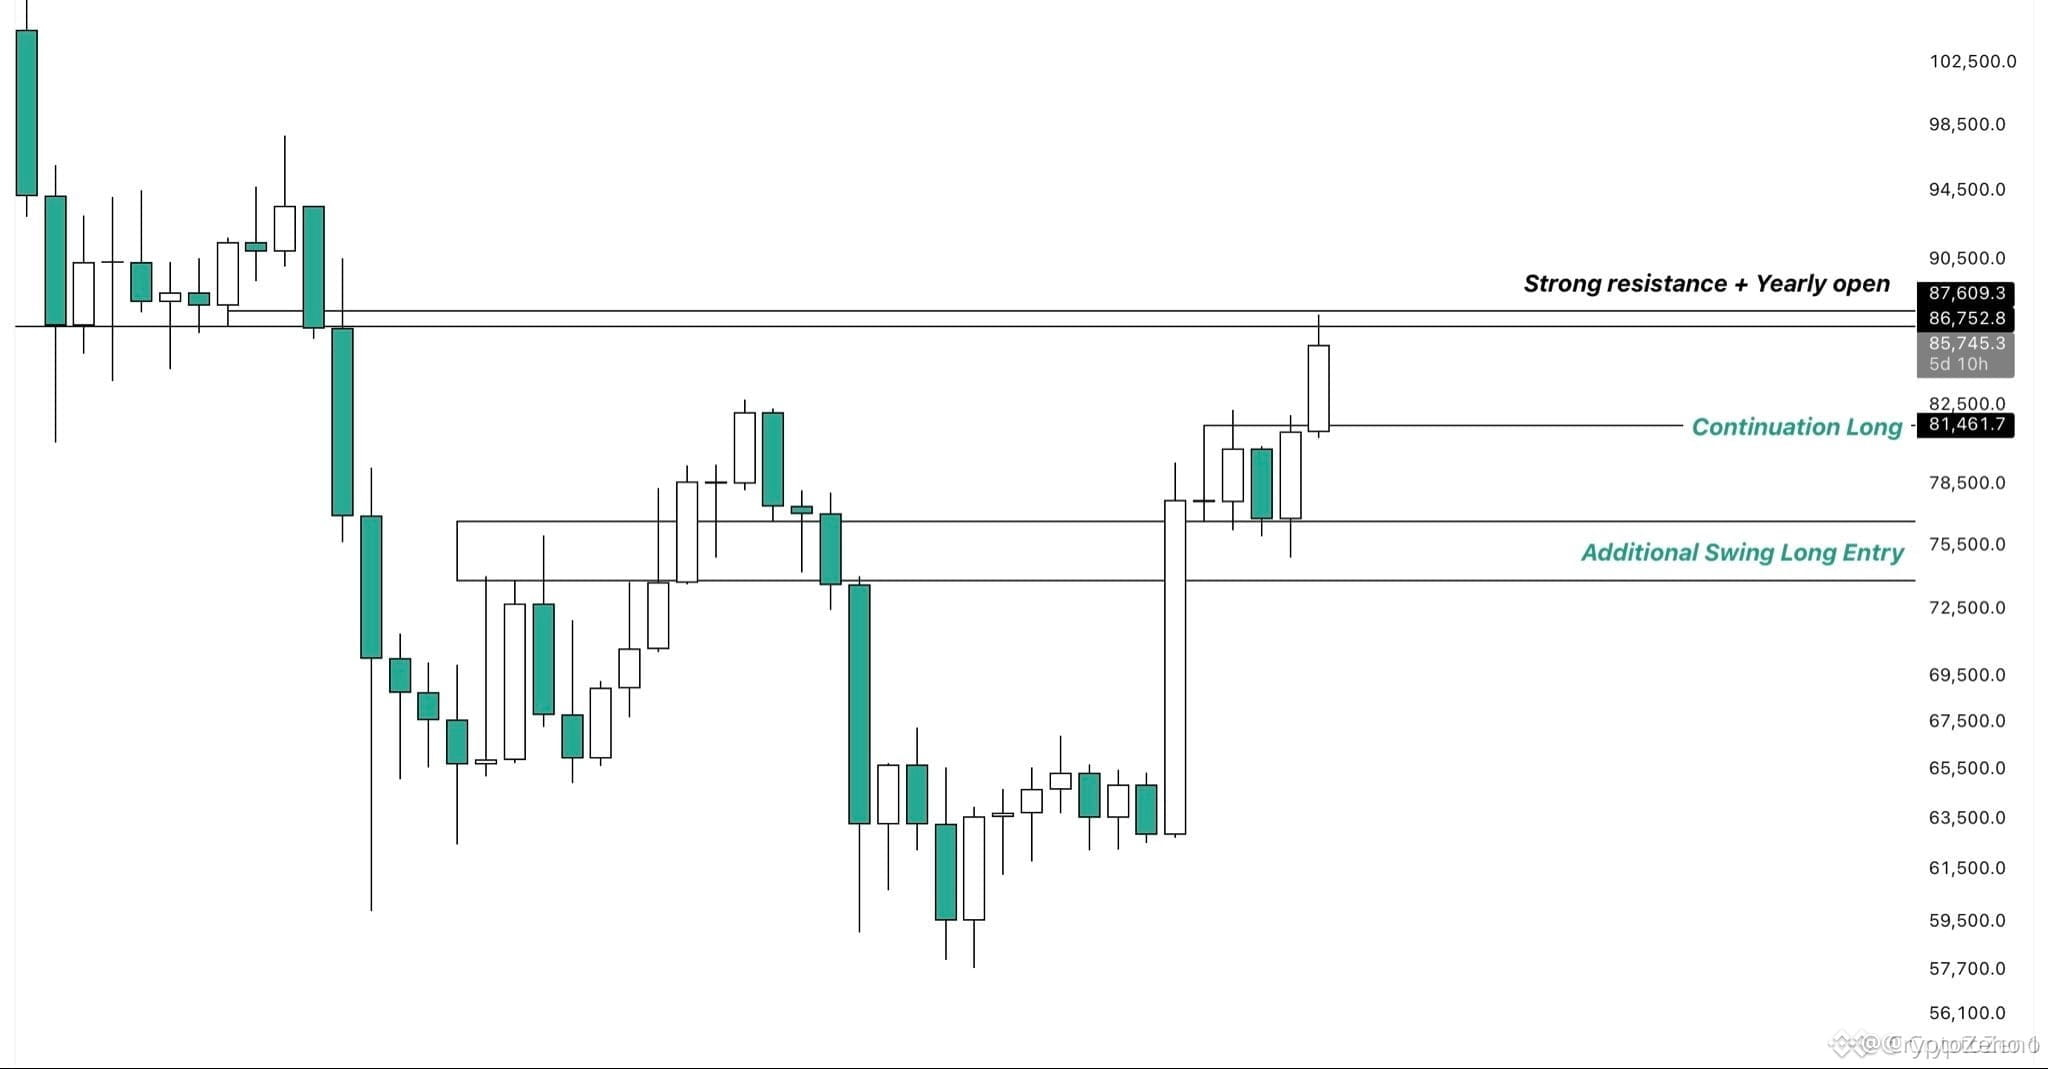
$BTC يُعد إغلاق هذا الأسبوع أمرًا حاسمًا للغاية.
يقوم البيتكوين حاليًا باختبار منطقة مقاومة رئيسية على إطار زمني أعلى (HTF)، مع وجود الافتتاح السنوي فوقها مباشرة، ما يزيد من تقوية هذا النطاق.
إذا تمكن المشترون من اختراق هذا المستوى ورأينا إغلاقًا أسبوعيًا قويًا يتبعه قبول فوق هذه المنطقة، فأتوقع استمرارًا باتجاه القمة الرئيسية المتأرجحة قرب $97K.
من ناحية أخرى، إذا تمكّن البيتكوين من التداول عبر هذا المستوى بشكلٍ عابر لكنه فشل في الثبات وأغلق مرة أخرى دونه، فسأعتبر ذلك علامة على الضعف وميلاً لتصحيح على المدى القصير.
توجد منطقتان أراقبهما في حال حدوث ذلك.
الأولى هي قمم النطاق الأخيرة، حيث سأبحث عن استمرارٍ صعودي (Long) كما ذكرت في منشوري السابق.
إذا فشل هذا المستوى في الصمود وعاد البيتكوين إلى داخل النطاق القديم، فستكون المنطقه التالية ذات اهتمام لدي حول $73K–$76K، حيث سأفكر في زيادة تعرضي لصفقات الـSwing Long. #BTC Price Analysis# #Macro Insights#
$BTC يُعد إغلاق هذا الأسبوع أمرًا حاسمًا للغاية.
يقوم البيتكوين حاليًا باختبار منطقة مقاومة رئيسية على إطار زمني أعلى (HTF)، مع وجود الافتتاح السنوي فوقها مباشرة، ما يزيد من تقوية هذا النطاق.
إذا تمكن المشترون من اختراق هذا المستوى ورأينا إغلاقًا أسبوعيًا قويًا يتبعه قبول فوق هذه المنطقة، فأتوقع استمرارًا باتجاه القمة الرئيسية المتأرجحة قرب $97K.
من ناحية أخرى، إذا تمكّن البيتكوين من التداول عبر هذا المستوى بشكلٍ عابر لكنه فشل في الثبات وأغلق مرة أخرى دونه، فسأعتبر ذلك علامة على الضعف وميلاً لتصحيح على المدى القصير.
توجد منطقتان أراقبهما في حال حدوث ذلك.
الأولى هي قمم النطاق الأخيرة، حيث سأبحث عن استمرارٍ صعودي (Long) كما ذكرت في منشوري السابق.
إذا فشل هذا المستوى في الصمود وعاد البيتكوين إلى داخل النطاق القديم، فستكون المنطقه التالية ذات اهتمام لدي حول $73K–$76K، حيث سأفكر في زيادة تعرضي لصفقات الـSwing Long. #BTC Price Analysis# #Macro Insights#
يقوم البيتكوين حاليًا باختبار منطقة مقاومة رئيسية على إطار زمني أعلى (HTF)، مع وجود الافتتاح السنوي فوقها مباشرة، ما يزيد من تقوية هذا النطاق.
إذا تمكن المشترون من اختراق هذا المستوى ورأينا إغلاقًا أسبوعيًا قويًا يتبعه قبول فوق هذه المنطقة، فأتوقع استمرارًا باتجاه القمة الرئيسية المتأرجحة قرب $97K.
من ناحية أخرى، إذا تمكّن البيتكوين من التداول عبر هذا المستوى بشكلٍ عابر لكنه فشل في الثبات وأغلق مرة أخرى دونه، فسأعتبر ذلك علامة على الضعف وميلاً لتصحيح على المدى القصير.
توجد منطقتان أراقبهما في حال حدوث ذلك.
الأولى هي قمم النطاق الأخيرة، حيث سأبحث عن استمرارٍ صعودي (Long) كما ذكرت في منشوري السابق.
إذا فشل هذا المستوى في الصمود وعاد البيتكوين إلى داخل النطاق القديم، فستكون المنطقه التالية ذات اهتمام لدي حول $73K–$76K، حيث سأفكر في زيادة تعرضي لصفقات الـSwing Long. #BTC Price Analysis# #Macro Insights#
53
·
--
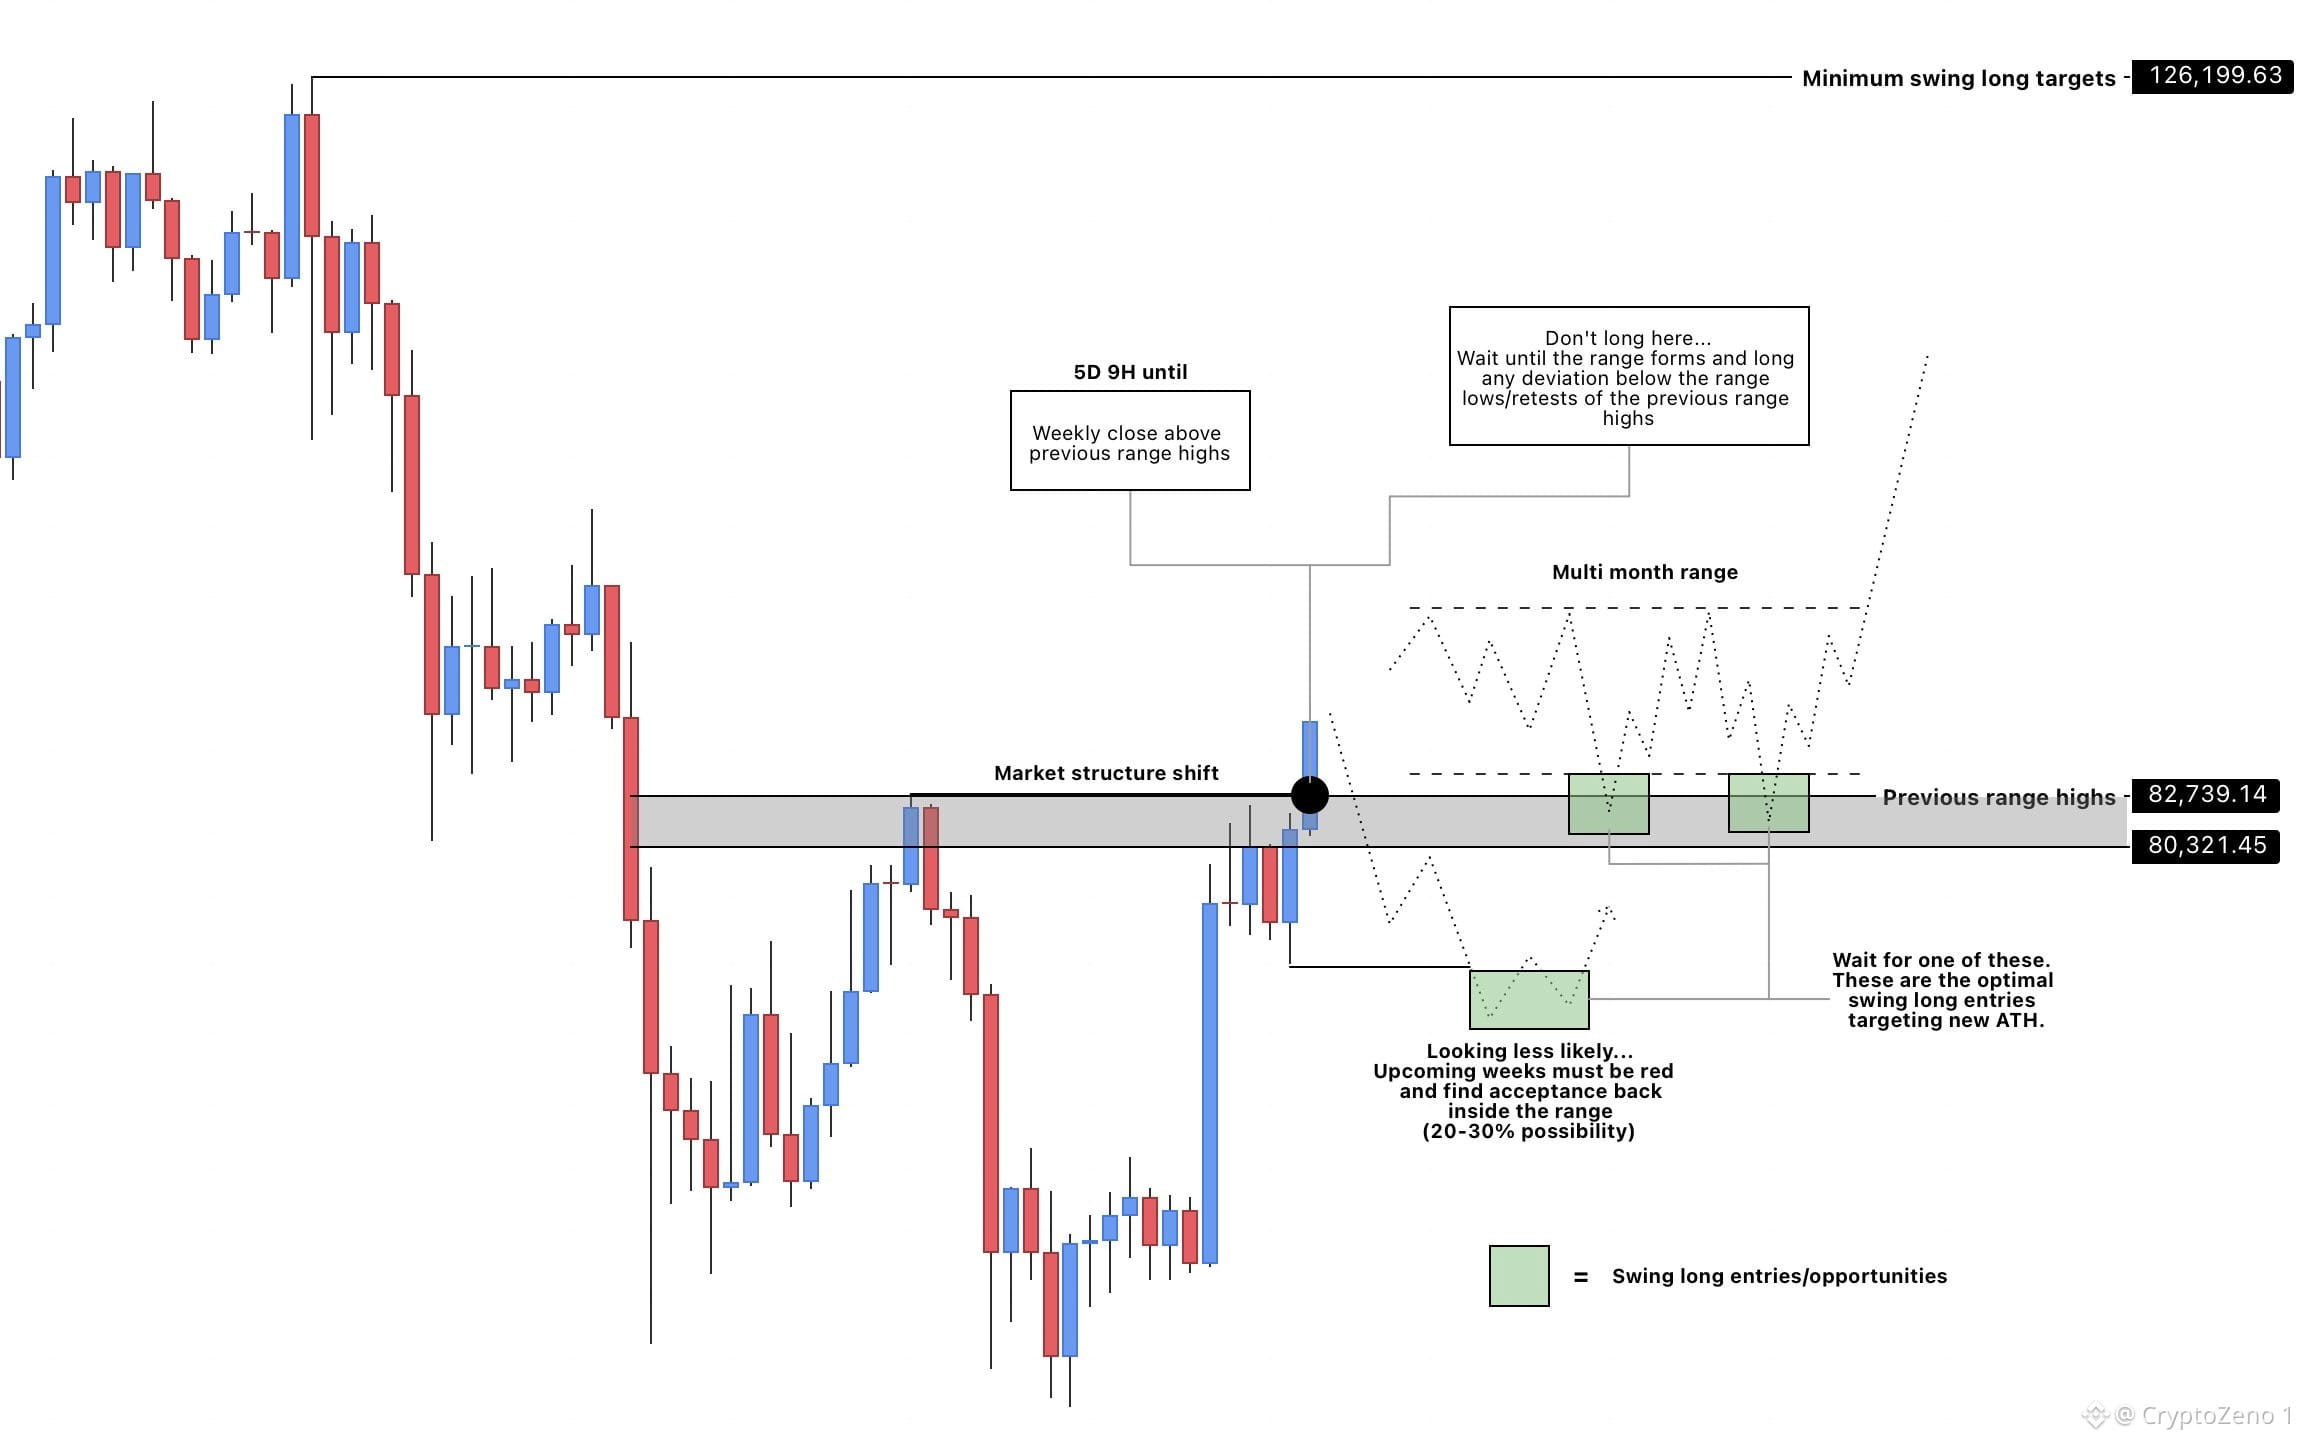
$BTC لا تفتح صفقة شراء هنا...
1. هذا مجرد انحراف، والسعر يعيد تتبع الحركة بالكامل خلال الأسابيع القليلة القادمة قبل أن يكتسح القيعان السابقة عند 74 ألف. تصبح هذه السيناريو أقل احتمالًا بكثير إذا بدأت الشموع الأسبوعية بالإغلاق فوق القمم السابقة للنطاق.
2. يتكوّن سعر نطاق جديد ويتماسك عند مستويات 80 ألف، مكوّنًا نطاقًا متعدد الأشهر قبل خطوة أخرى للأعلى.
السيناريو 2 بات بالفعل أكثر احتمالًا، وستستمر هذه الاحتمالية في الزيادة إذا أغلقت المزيد من الشموع الأسبوعية فوق القمم السابقة للنطاق.
على أي حال، فتح صفقات شراء هنا لا يبدو منطقيًا. من الأفضل الانتظار لصفقات الدخول المثالية في المناطق الخضراء.
أما سبب أنني أبحث فقط عن صفقات شراء، فقد ذكرت ذلك عدة مرات. لقد تغيّر الاتجاه، والبيع الآن أصبح عكس الاتجاه. #BTC تحليل السعر# #رؤى الاقتصاد الكلي# #موسم العملات البديلة#
$BTC لا تفتح صفقة شراء هنا...
1. هذا مجرد انحراف، والسعر يعيد تتبع الحركة بالكامل خلال الأسابيع القليلة القادمة قبل أن يكتسح القيعان السابقة عند 74 ألف. تصبح هذه السيناريو أقل احتمالًا بكثير إذا بدأت الشموع الأسبوعية بالإغلاق فوق القمم السابقة للنطاق.
2. يتكوّن سعر نطاق جديد ويتماسك عند مستويات 80 ألف، مكوّنًا نطاقًا متعدد الأشهر قبل خطوة أخرى للأعلى.
السيناريو 2 بات بالفعل أكثر احتمالًا، وستستمر هذه الاحتمالية في الزيادة إذا أغلقت المزيد من الشموع الأسبوعية فوق القمم السابقة للنطاق.
على أي حال، فتح صفقات شراء هنا لا يبدو منطقيًا. من الأفضل الانتظار لصفقات الدخول المثالية في المناطق الخضراء.
أما سبب أنني أبحث فقط عن صفقات شراء، فقد ذكرت ذلك عدة مرات. لقد تغيّر الاتجاه، والبيع الآن أصبح عكس الاتجاه. #BTC تحليل السعر# #رؤى الاقتصاد الكلي# #موسم العملات البديلة#
1. هذا مجرد انحراف، والسعر يعيد تتبع الحركة بالكامل خلال الأسابيع القليلة القادمة قبل أن يكتسح القيعان السابقة عند 74 ألف. تصبح هذه السيناريو أقل احتمالًا بكثير إذا بدأت الشموع الأسبوعية بالإغلاق فوق القمم السابقة للنطاق.
2. يتكوّن سعر نطاق جديد ويتماسك عند مستويات 80 ألف، مكوّنًا نطاقًا متعدد الأشهر قبل خطوة أخرى للأعلى.
السيناريو 2 بات بالفعل أكثر احتمالًا، وستستمر هذه الاحتمالية في الزيادة إذا أغلقت المزيد من الشموع الأسبوعية فوق القمم السابقة للنطاق.
على أي حال، فتح صفقات شراء هنا لا يبدو منطقيًا. من الأفضل الانتظار لصفقات الدخول المثالية في المناطق الخضراء.
أما سبب أنني أبحث فقط عن صفقات شراء، فقد ذكرت ذلك عدة مرات. لقد تغيّر الاتجاه، والبيع الآن أصبح عكس الاتجاه. #BTC تحليل السعر# #رؤى الاقتصاد الكلي# #موسم العملات البديلة#
94
·
--
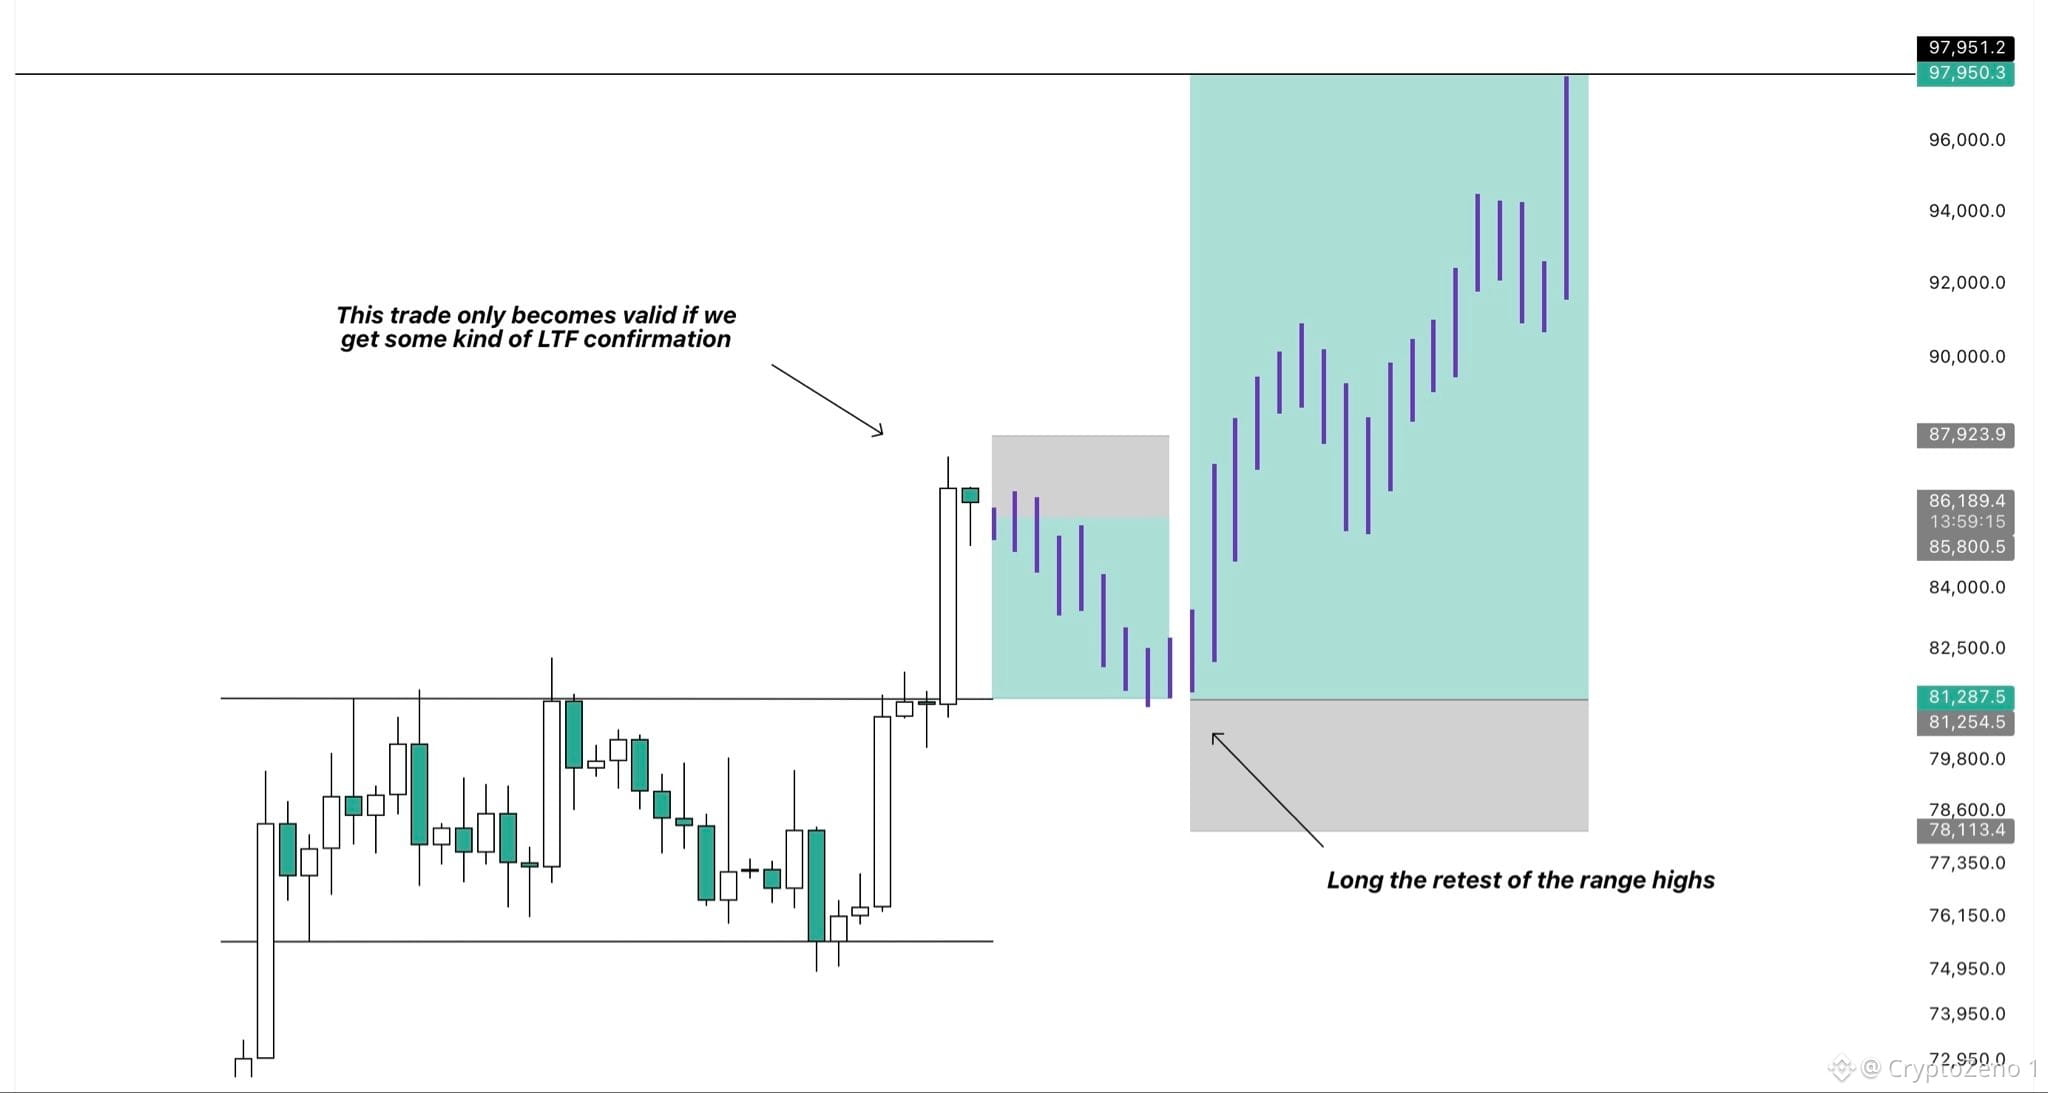
$BTC البقاء على نفس المستوى هو ما يبدو منطقيًا بالنسبة لي حاليًا.
صفقات السبوت تتجهز. الدخول الطويل على المراكز يتجهز. لذا، لماذا ألاحق أي صفقات هنا؟
ومع ذلك، توجد حالتان من هنا أود فيهما الدخول في صفقة أخرى.
الأولى ستكون رفضًا من منطقة مقاومة على الأطر الزمنية الأعلى (HTF) نحن الآن نعيد اختبارها، يليه حدوث تحول في البنية السعريّة بشكل هابط على الأطر الزمنية الأقل. في تلك الحالة، سأنظر إلى الدخول في صفقة بيع قصيرة بهدف منطقة $81.2K، حيث سيقوم السعر بإعادة اختبار الاختراق الأخير من قمم النطاق.
أما الثانية، وهي بالنسبة لي الأكثر إثارة للاهتمام حاليًا، فستكون شراءً بعد إعادة اختبار ناجحة لتلك القمم.
لقد اخترق السعر النطاق إلى الأعلى بزخم كبير، وجاء إغلاق اليوم أمس ضمنًا أعلى بكثير من $81.2K.
وبما أن هذه الحركة تم دعمها بقوة أيضًا من خلال مشتريات السبوت، فهذا يبدو بالنسبة لي أقرب إلى
اختراق حقيقي أكثر من كونه مجرد اصطياد سيولة أو فخًا.
إذا عاد السعر إلى تلك المنطقة وبدأ يُظهر قوة مرة أخرى، فسأبحث عن الدخول في صفقة شراء أخرى بهدف القمة الرئيسية للتذبذب قرب $97K.
وحتى تظهر إحدى هاتين الإعدادين، لا أرى سببًا لفرض صفقة. #BTC Price Analysis# #Macro Insights#
$BTC البقاء على نفس المستوى هو ما يبدو منطقيًا بالنسبة لي حاليًا.
صفقات السبوت تتجهز. الدخول الطويل على المراكز يتجهز. لذا، لماذا ألاحق أي صفقات هنا؟
ومع ذلك، توجد حالتان من هنا أود فيهما الدخول في صفقة أخرى.
الأولى ستكون رفضًا من منطقة مقاومة على الأطر الزمنية الأعلى (HTF) نحن الآن نعيد اختبارها، يليه حدوث تحول في البنية السعريّة بشكل هابط على الأطر الزمنية الأقل. في تلك الحالة، سأنظر إلى الدخول في صفقة بيع قصيرة بهدف منطقة $81.2K، حيث سيقوم السعر بإعادة اختبار الاختراق الأخير من قمم النطاق.
أما الثانية، وهي بالنسبة لي الأكثر إثارة للاهتمام حاليًا، فستكون شراءً بعد إعادة اختبار ناجحة لتلك القمم.
لقد اخترق السعر النطاق إلى الأعلى بزخم كبير، وجاء إغلاق اليوم أمس ضمنًا أعلى بكثير من $81.2K.
وبما أن هذه الحركة تم دعمها بقوة أيضًا من خلال مشتريات السبوت، فهذا يبدو بالنسبة لي أقرب إلى
اختراق حقيقي أكثر من كونه مجرد اصطياد سيولة أو فخًا.
إذا عاد السعر إلى تلك المنطقة وبدأ يُظهر قوة مرة أخرى، فسأبحث عن الدخول في صفقة شراء أخرى بهدف القمة الرئيسية للتذبذب قرب $97K.
وحتى تظهر إحدى هاتين الإعدادين، لا أرى سببًا لفرض صفقة. #BTC Price Analysis# #Macro Insights#
صفقات السبوت تتجهز. الدخول الطويل على المراكز يتجهز. لذا، لماذا ألاحق أي صفقات هنا؟
ومع ذلك، توجد حالتان من هنا أود فيهما الدخول في صفقة أخرى.
الأولى ستكون رفضًا من منطقة مقاومة على الأطر الزمنية الأعلى (HTF) نحن الآن نعيد اختبارها، يليه حدوث تحول في البنية السعريّة بشكل هابط على الأطر الزمنية الأقل. في تلك الحالة، سأنظر إلى الدخول في صفقة بيع قصيرة بهدف منطقة $81.2K، حيث سيقوم السعر بإعادة اختبار الاختراق الأخير من قمم النطاق.
أما الثانية، وهي بالنسبة لي الأكثر إثارة للاهتمام حاليًا، فستكون شراءً بعد إعادة اختبار ناجحة لتلك القمم.
لقد اخترق السعر النطاق إلى الأعلى بزخم كبير، وجاء إغلاق اليوم أمس ضمنًا أعلى بكثير من $81.2K.
وبما أن هذه الحركة تم دعمها بقوة أيضًا من خلال مشتريات السبوت، فهذا يبدو بالنسبة لي أقرب إلى
اختراق حقيقي أكثر من كونه مجرد اصطياد سيولة أو فخًا.
إذا عاد السعر إلى تلك المنطقة وبدأ يُظهر قوة مرة أخرى، فسأبحث عن الدخول في صفقة شراء أخرى بهدف القمة الرئيسية للتذبذب قرب $97K.
وحتى تظهر إحدى هاتين الإعدادين، لا أرى سببًا لفرض صفقة. #BTC Price Analysis# #Macro Insights#
40
·
--
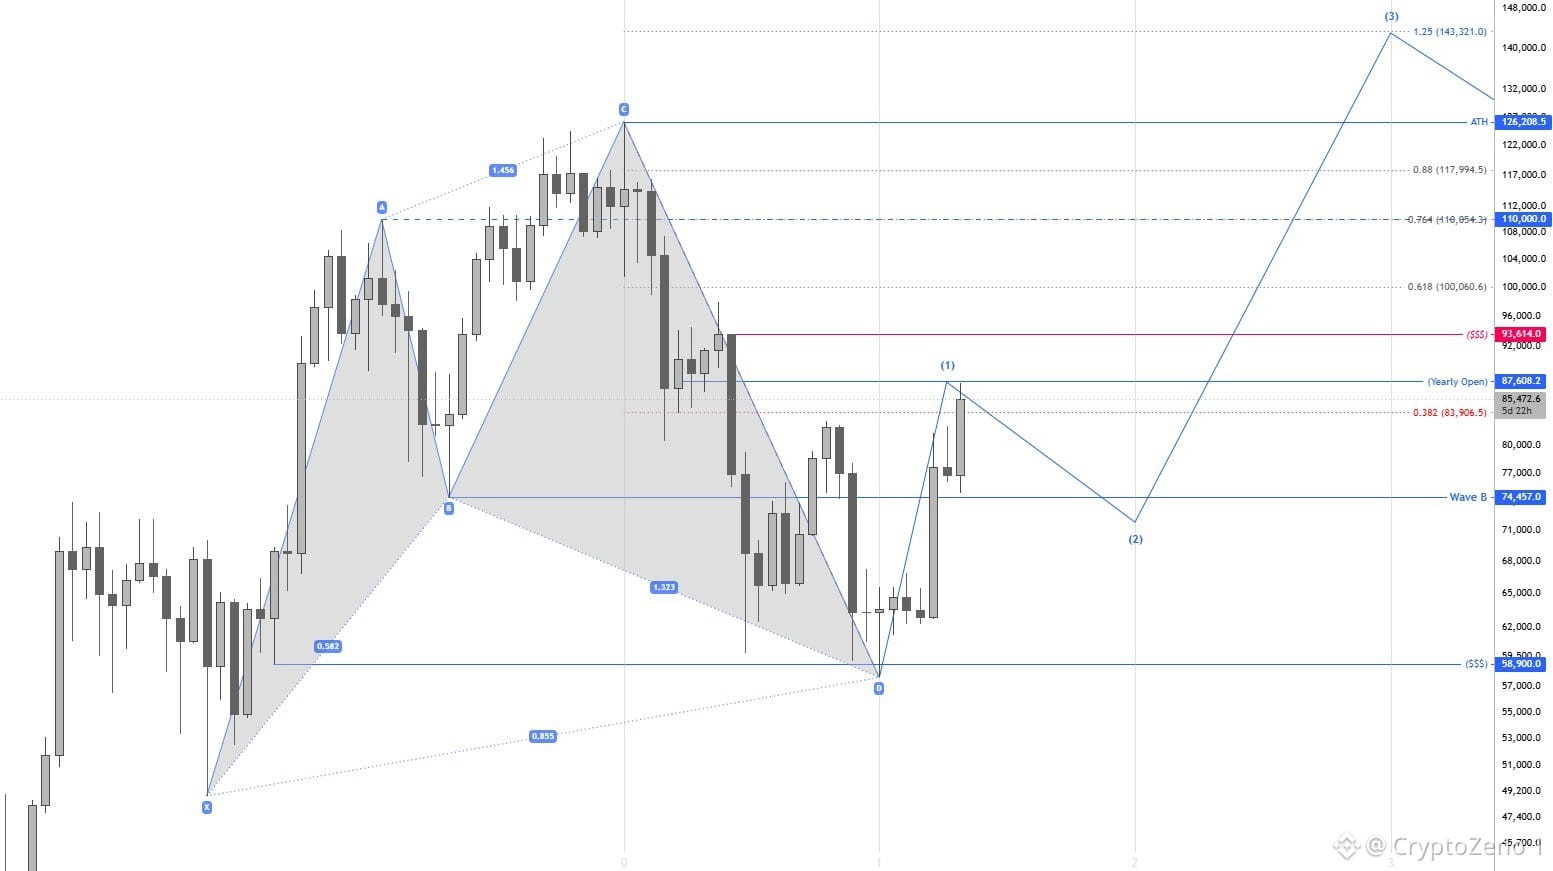
$BTC حان الوقت لإيلاء الاهتمام.
نحن نرفض من منطقة 87.6 ألف، وهي كانت نقطة الاهتمام (POI) لدينا لإكمال موجة HTF 1.
ما زلت أعتقد أن هناك مجالًا لدفع أعلى إلى 93.6 ألف، خاصةً إذا تمكّنا من الحفاظ على نطاق 84.6 ألف-82.8 ألف عند إعادة الزيارة.
أتوقع حدوث تراجع صغير قبل الاستمرار باتجاه الصعود في الوقت الحالي. #BTC Price Analysis# #Macro Insights#
$BTC حان الوقت لإيلاء الاهتمام.
نحن نرفض من منطقة 87.6 ألف، وهي كانت نقطة الاهتمام (POI) لدينا لإكمال موجة HTF 1.
ما زلت أعتقد أن هناك مجالًا لدفع أعلى إلى 93.6 ألف، خاصةً إذا تمكّنا من الحفاظ على نطاق 84.6 ألف-82.8 ألف عند إعادة الزيارة.
أتوقع حدوث تراجع صغير قبل الاستمرار باتجاه الصعود في الوقت الحالي. #BTC Price Analysis# #Macro Insights#
نحن نرفض من منطقة 87.6 ألف، وهي كانت نقطة الاهتمام (POI) لدينا لإكمال موجة HTF 1.
ما زلت أعتقد أن هناك مجالًا لدفع أعلى إلى 93.6 ألف، خاصةً إذا تمكّنا من الحفاظ على نطاق 84.6 ألف-82.8 ألف عند إعادة الزيارة.
أتوقع حدوث تراجع صغير قبل الاستمرار باتجاه الصعود في الوقت الحالي. #BTC Price Analysis# #Macro Insights#
76
·
--
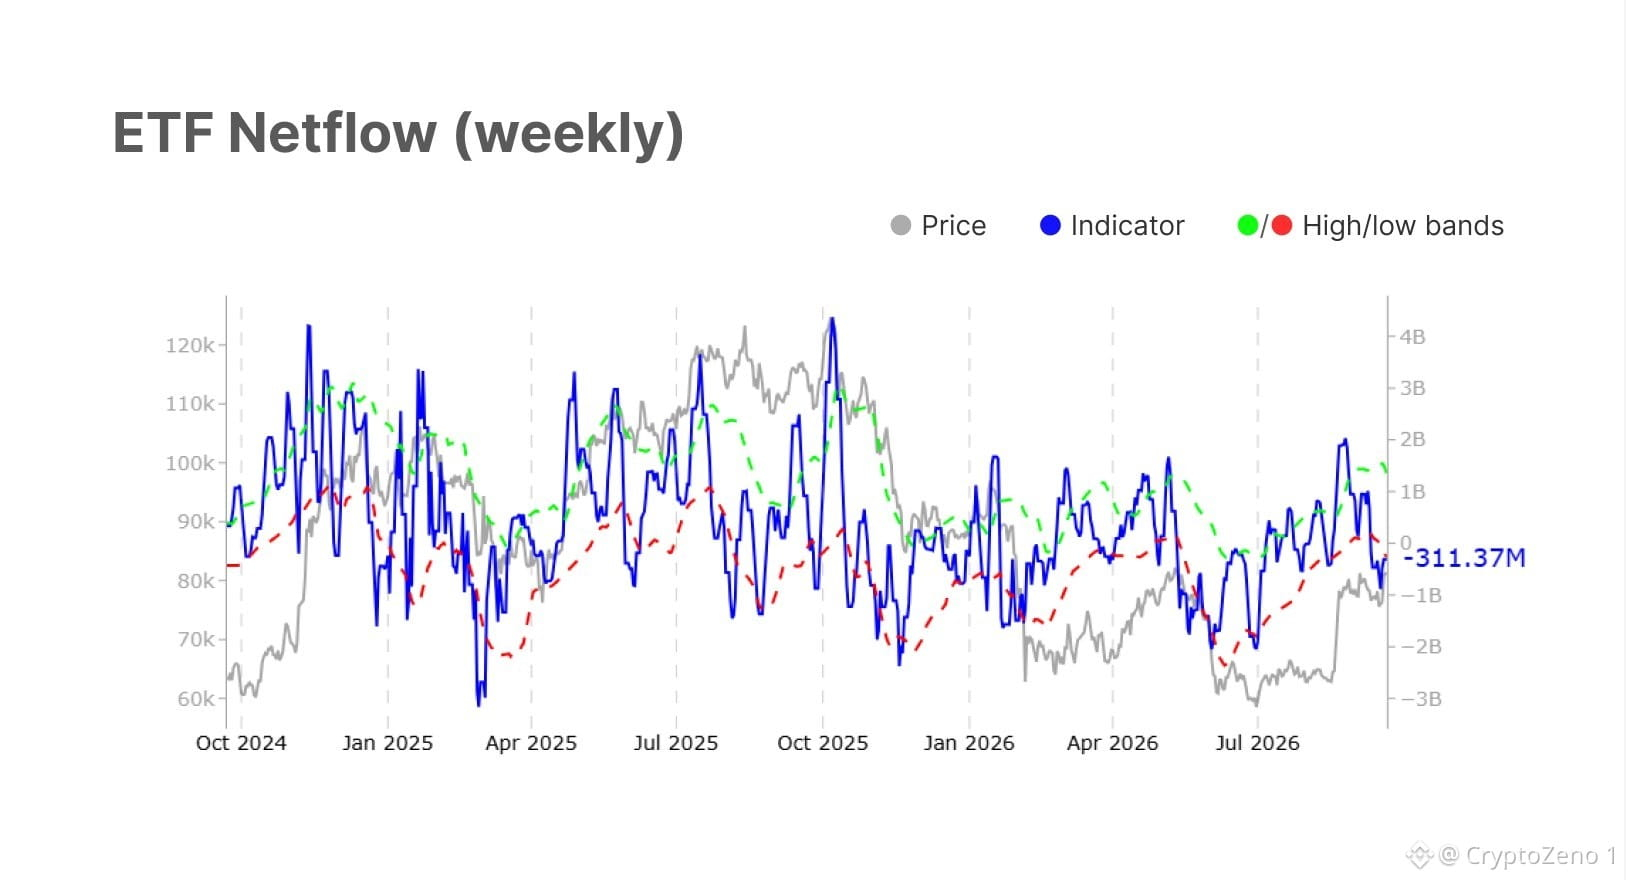
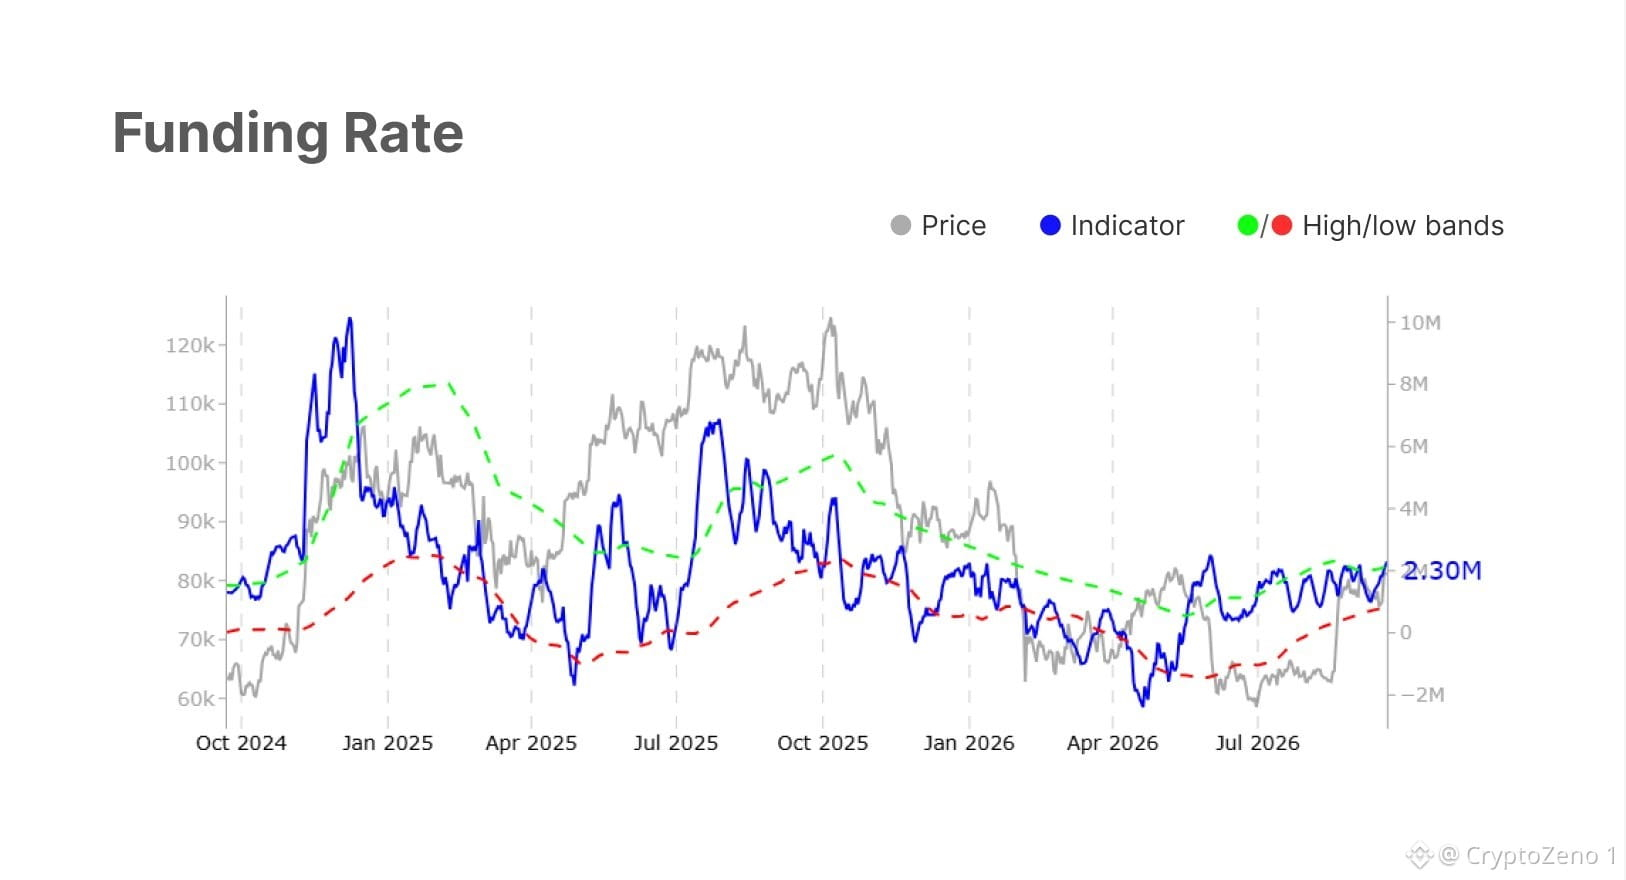
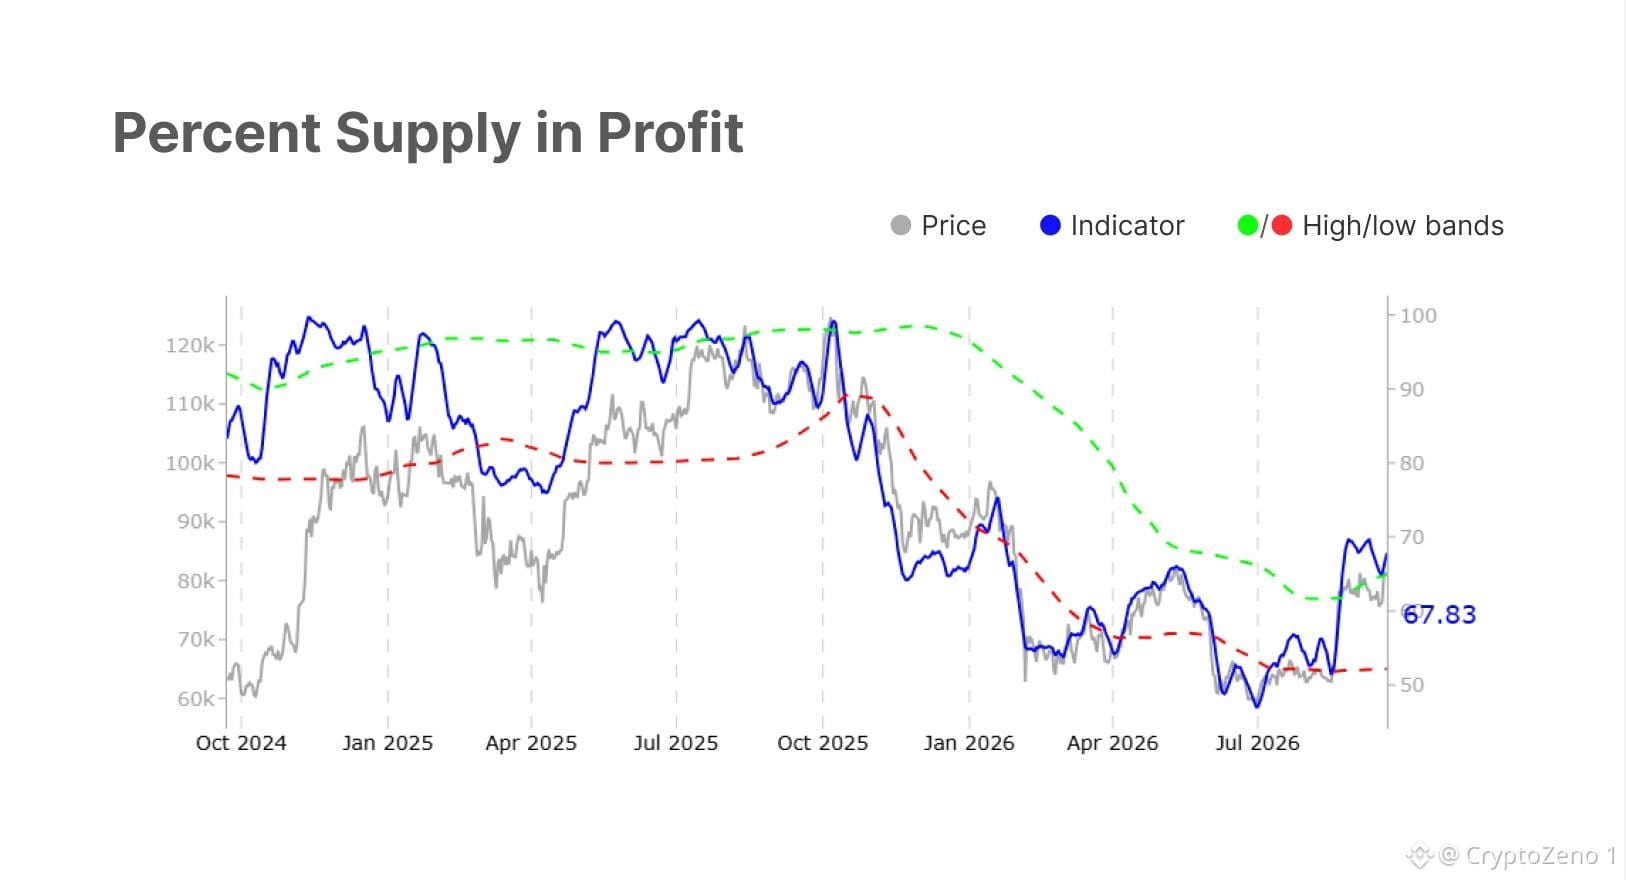
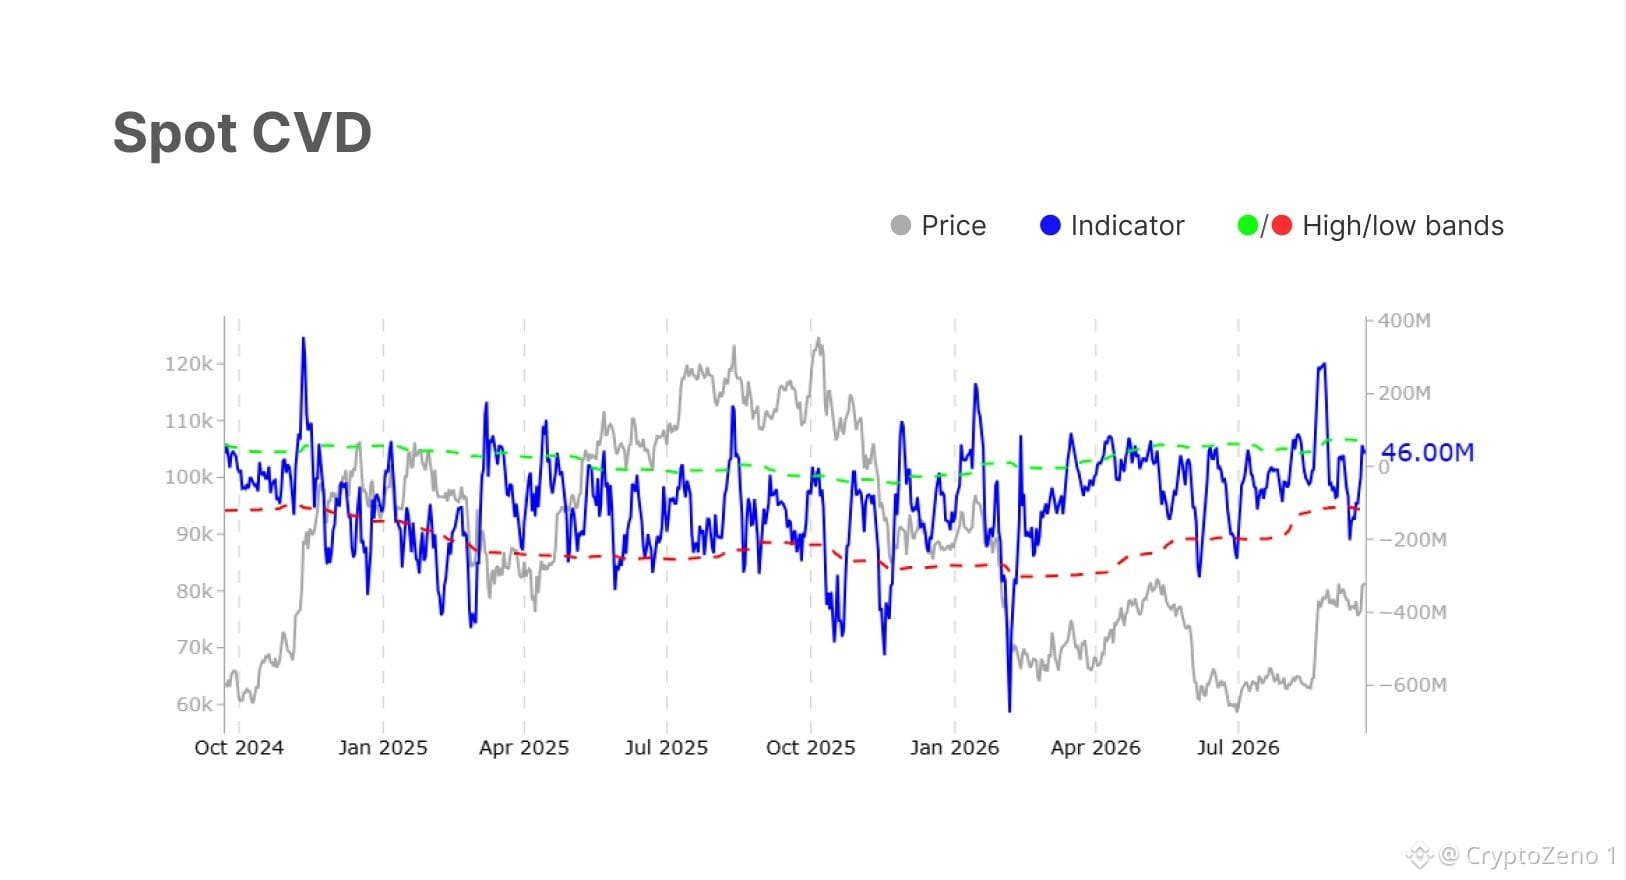
$BTC يصل إلى 86 ألف دولار، بارتفاع أكثر من 10% عن إغلاق يوم الأحد الماضي.
يتصدر المشترون في السوق الفورية والعقود الدائمة، بينما ترتفع الرافعة المالية وجني الأرباح تدريجيًا مع ارتفاع السعر.
تدفقات صناديق الاستثمار المتداولة (ETF) هي الإشارة الوحيدة التي لا تزال تشير في الاتجاه الآخر. #تحليل_سعر_BTC# #رؤى_ماكرو#
$BTC يصل إلى 86 ألف دولار، بارتفاع أكثر من 10% عن إغلاق يوم الأحد الماضي.
يتصدر المشترون في السوق الفورية والعقود الدائمة، بينما ترتفع الرافعة المالية وجني الأرباح تدريجيًا مع ارتفاع السعر.
تدفقات صناديق الاستثمار المتداولة (ETF) هي الإشارة الوحيدة التي لا تزال تشير في الاتجاه الآخر. #تحليل_سعر_BTC# #رؤى_ماكرو#
يتصدر المشترون في السوق الفورية والعقود الدائمة، بينما ترتفع الرافعة المالية وجني الأرباح تدريجيًا مع ارتفاع السعر.
تدفقات صناديق الاستثمار المتداولة (ETF) هي الإشارة الوحيدة التي لا تزال تشير في الاتجاه الآخر. #تحليل_سعر_BTC# #رؤى_ماكرو#
46
سجّل الدخول لاستكشاف المزيد من المُحتوى
انضم إلى مُستخدمي العملات الرقمية حول العالم على Binance Square
⚡️ احصل على أحدث المعلومات المفيدة عن العملات الرقمية.
💬 موثوقة من قبل أكبر منصّة لتداول العملات الرقمية في العالم.
👍 اكتشف الرؤى الحقيقية من صنّاع المُحتوى الموثوقين.
البريد الإلكتروني / رقم الهاتف
المواضيع الرائجة
BitcoinClears$85200
6 مشاهدات
23 يقومون بالنقاش
#BitcoinClears$85200 بتكوين يتجاوز مستوى مقاومة رئيسيًا: BTC يصل إلى 85,200$ مع زخم قوي في السوق 📊
لقد تجاوزت بيتكوين رسميًا عتبة 85,200$، ما يمثل محطة فنية مهمة. إليك تفصيلًا لما تعنيه هذه الحركة بالنسبة للسوق الأوسع للعملات الرقمية.
📰 الأخبار الأساسية
• تمكنت بيتكوين (BTC) من تجاوز مستوى مقاومة 85,200$ بنجاح، إلى جانب أحجام تداول ملحوظة.
• تأتي هذه الخطوة بعد فترة من تماسك/توحّد السوق، ما يشير إلى عودة ضغط الشراء واستمرار الاهتمام من المشاركين في السوق.
🌍 تأثير السوق
• 🏛️هيمنة السوق غالبًا ما تعزز الخطوة الحاسمة من بيتكوين هيمنتها على السوق، وقد تؤثر مؤقتًا في سيولة العملات البديلة (altcoins) مع انتقال رأس المال داخل النظام البيئي.
• 📈 المعنويات والمؤشرات الفنية عادةً ما يؤدي تجاوز مستويات نفسية وفنية كبيرة إلى تحويل معنويات السوق إلى نظرة أكثر إيجابية، وفتح الباب أمام اكتشاف المزيد من الأسعار إذا ظل حجم التداول ثابتًا.
• 📊 نشاط المشتقات من المفترض أن يتوقع المتداولون زيادة النشاط في أسواق العقود الآجلة والخيارات، حيث يعيد المشاركون ضبط استراتيجيات إدارة المخاطر والتحوط بناءً على مستوى السعر الجديد.
💬 انضم إلى النقاش
ما هو توقعك بشأن المستوى الفني الرئيسي التالي لبيتكوين، أم تتوقع فترة تماسك عند هذه الارتفاعات؟ شارك تحليلك في التعليقات أدناه! 👇
#Bitcoin #BTC #CryptoMarket #MarketAnalysis #BinanceSquare
هذا المحتوى لأغراض تعليمية فقط. ليس نصيحة مالية (NFA). قم دائمًا بإجراء بحثك الخاص (DYOR).
$ARK $MOVR $GLMR
珍妮丝 kgf
·1 إعجاب
·14 مشاهدات
AltcoinSeasonIndexHoldsAbove60For5Days
1,182 مشاهدات
209 يقومون بالنقاش
BitcoinSlipsBelow$84000
1,002 مشاهدات
60 يقومون بالنقاش