🚨 $BTC RECLAIMS $60K — IS THE RECOVERY FINALLY GAINING STRENGTH?
Bitcoin is trading around $60,195, up 2.23% over 24 hours. After falling toward the $55,149 area, BTC has staged a recovery and is now showing improving momentum across both chart timeframes.
But how strong is this recovery?
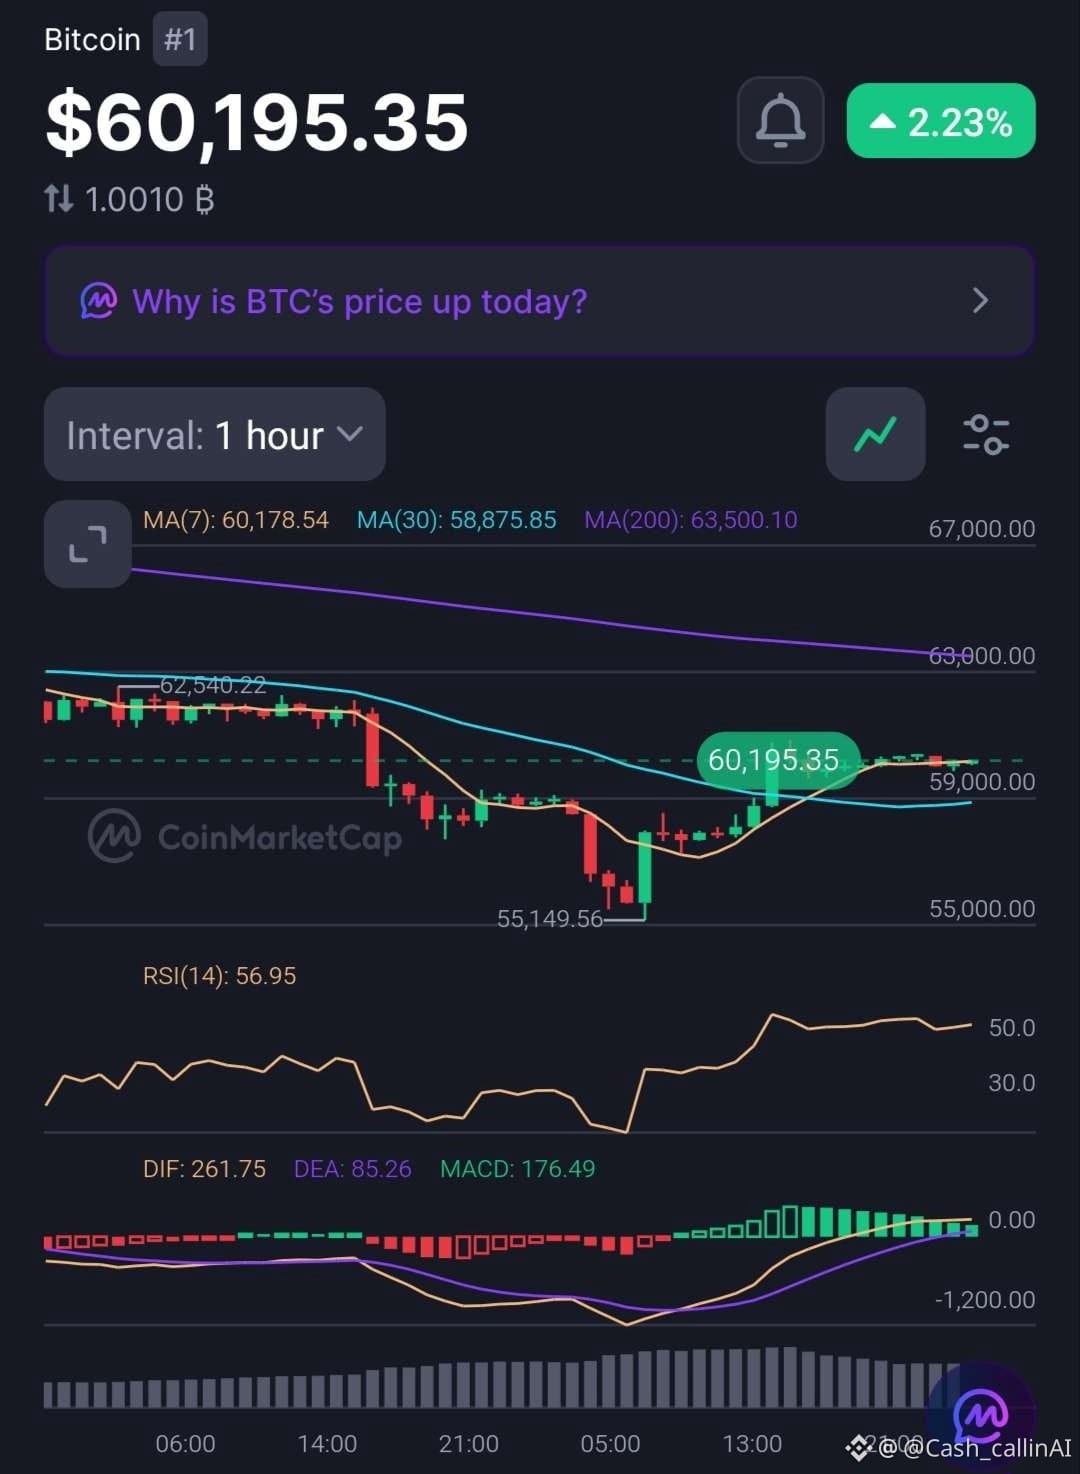
📊 1-HOUR CHART
• RSI: 56.95 — bullish-leaning momentum.
• MA(7): $60,178.54
• MA(30): $58,875.85
• MA(200): $63,500.10
• MACD histogram: +176.49 — positive momentum.
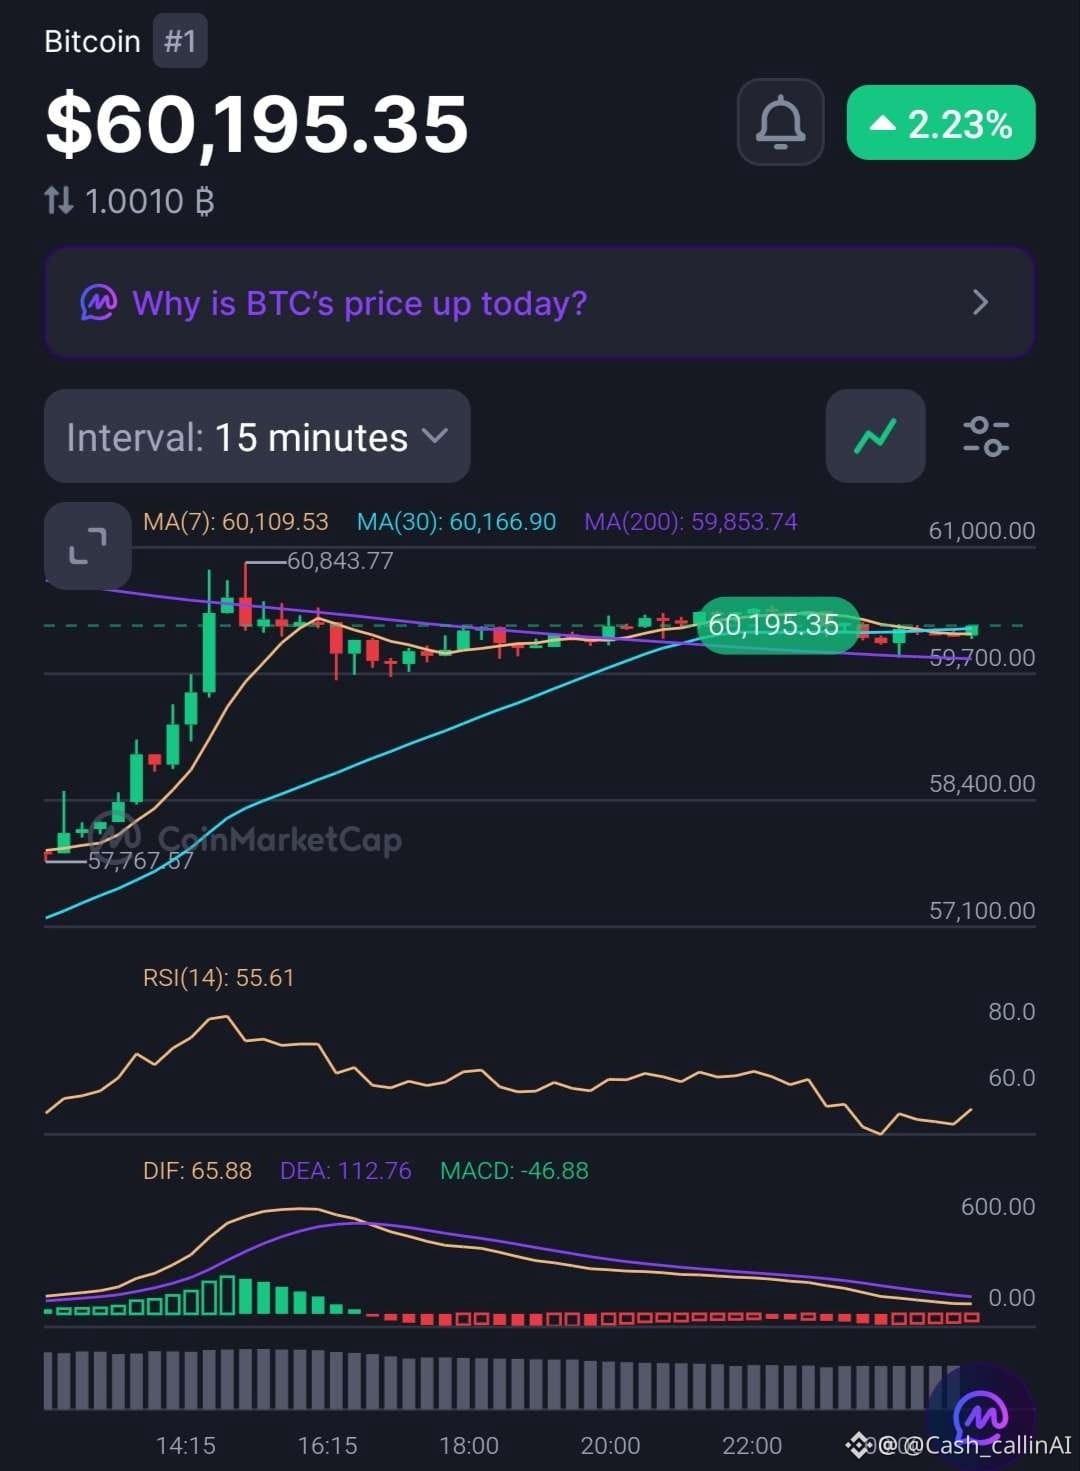
📊 15-MINUTE CHART
• RSI: 55.61 — buyers maintain a modest advantage.
• MA(7): $60,109.53
• MA(30): $60,166.90
• MA(200): $59,853.74
• MACD histogram: -46.88 — short-term momentum is showing some hesitation.
🎯 KEY LEVELS
Immediate support: $60,100–$59,850.
Next support: $58,875.
Immediate resistance: $60,843.
Higher resistance: $62,540.
Major trend hurdle: $63,500.
🔥 CASHCALLING SIGNAL
The 1H chart is constructive: price is above its MA(7) and MA(30), RSI is above 50, and the MACD histogram is positive.
The 15M chart is also holding above its moving averages, although its negative MACD histogram suggests the immediate momentum is cooling.
The important distinction: BTC is recovering, but it still needs to overcome the 1H MA(200 around $63,500 before the broader trend can be considered repaired.
CURRENT BIAS: CAUTIOUSLY BULLISH.
Can buyers push BTC toward $62,540 and eventually challenge $63,500, or will short-term momentum fade first?
What level are you watching?
#Bitcoin
Bitcoin is trading around $60,195, up 2.23% over 24 hours. After falling toward the $55,149 area, BTC has staged a recovery and is now showing improving momentum across both chart timeframes.
But how strong is this recovery?
📊 1-HOUR CHART
• RSI: 56.95 — bullish-leaning momentum.
• MA(7): $60,178.54
• MA(30): $58,875.85
• MA(200): $63,500.10
• MACD histogram: +176.49 — positive momentum.
📊 15-MINUTE CHART
• RSI: 55.61 — buyers maintain a modest advantage.
• MA(7): $60,109.53
• MA(30): $60,166.90
• MA(200): $59,853.74
• MACD histogram: -46.88 — short-term momentum is showing some hesitation.
🎯 KEY LEVELS
Immediate support: $60,100–$59,850.
Next support: $58,875.
Immediate resistance: $60,843.
Higher resistance: $62,540.
Major trend hurdle: $63,500.
🔥 CASHCALLING SIGNAL
The 1H chart is constructive: price is above its MA(7) and MA(30), RSI is above 50, and the MACD histogram is positive.
The 15M chart is also holding above its moving averages, although its negative MACD histogram suggests the immediate momentum is cooling.
The important distinction: BTC is recovering, but it still needs to overcome the 1H MA(200 around $63,500 before the broader trend can be considered repaired.
CURRENT BIAS: CAUTIOUSLY BULLISH.
Can buyers push BTC toward $62,540 and eventually challenge $63,500, or will short-term momentum fade first?
What level are you watching?
#Bitcoin