

Daily outlook 🙂 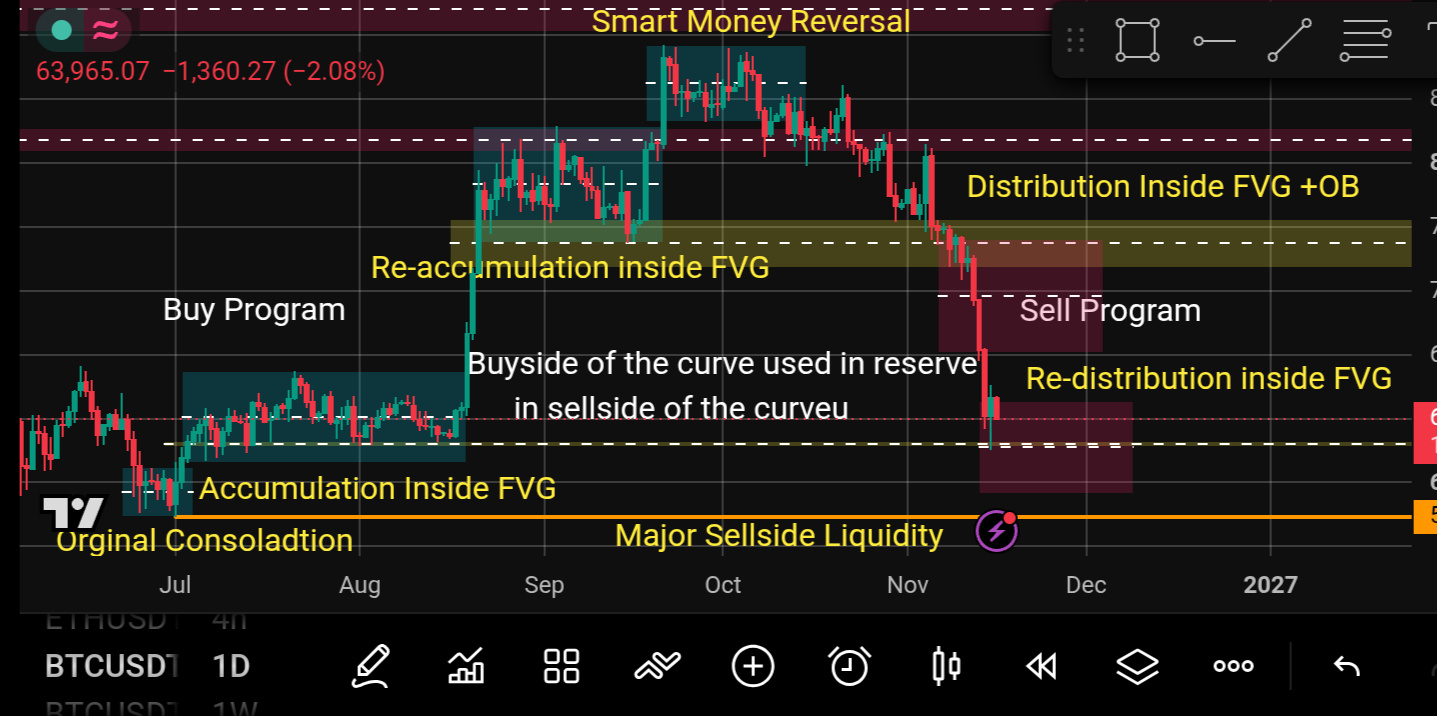
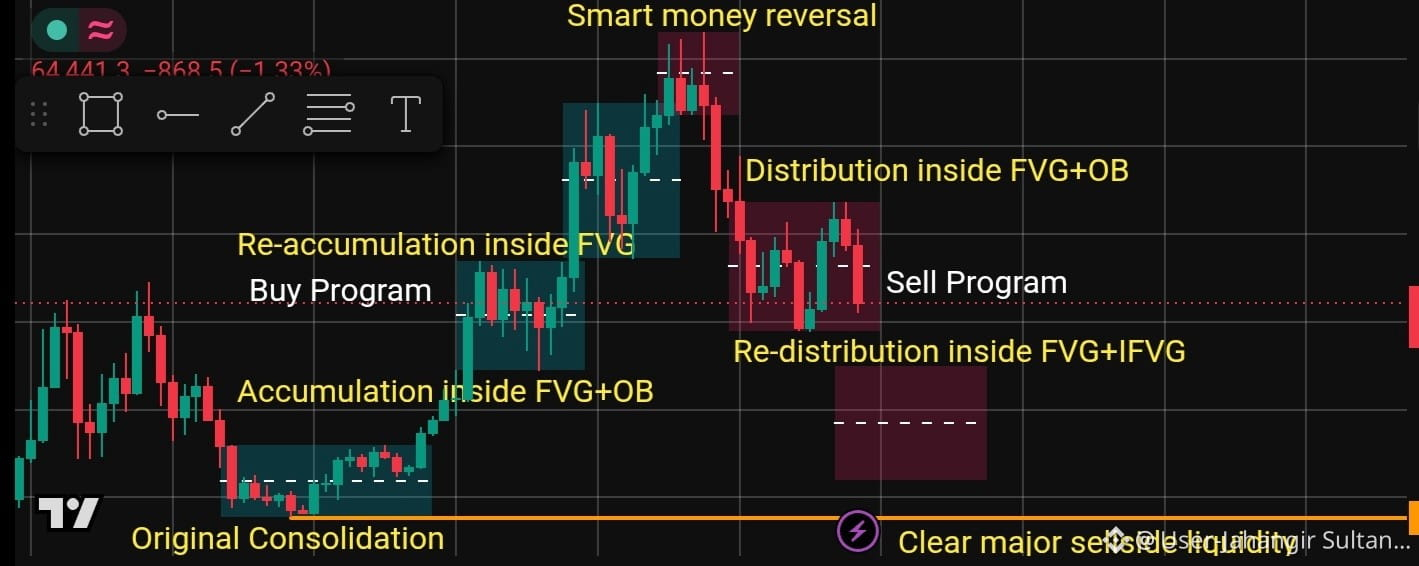
Assalamu Alaikum, you shouldn't panic, first of all you should read my article carefully.Well, here I want to present you with an excellent analysis of the daily chart, weekly chart and monthly chart, and you have to read it carefully and then give your opinion in the comments.First of all, you should keep in mind that the market runs on two things: liquidity and the market maker buy model and the market maker sell model.This is the daily chart that I have shared with you. Read it once for the buy program, then read the sell program. You will understand how the market runs.When the market went from 57,000 to 87,000, the market would consolidate and then what it did was it would give a breakout and in this way the buy side delivery was done and the market's buy program was completed.After this, what did the market maker do? Smart Money Reversal? The market consolidated in this Smart Money Reversal box and then broke down to the downside, and the market completed its model by delivering the sell side, which would be completed at $57,000.If you see any doubt in the daily chart, please give your opinion in the comments. I will respect your opinion and I will respond to you accordingly.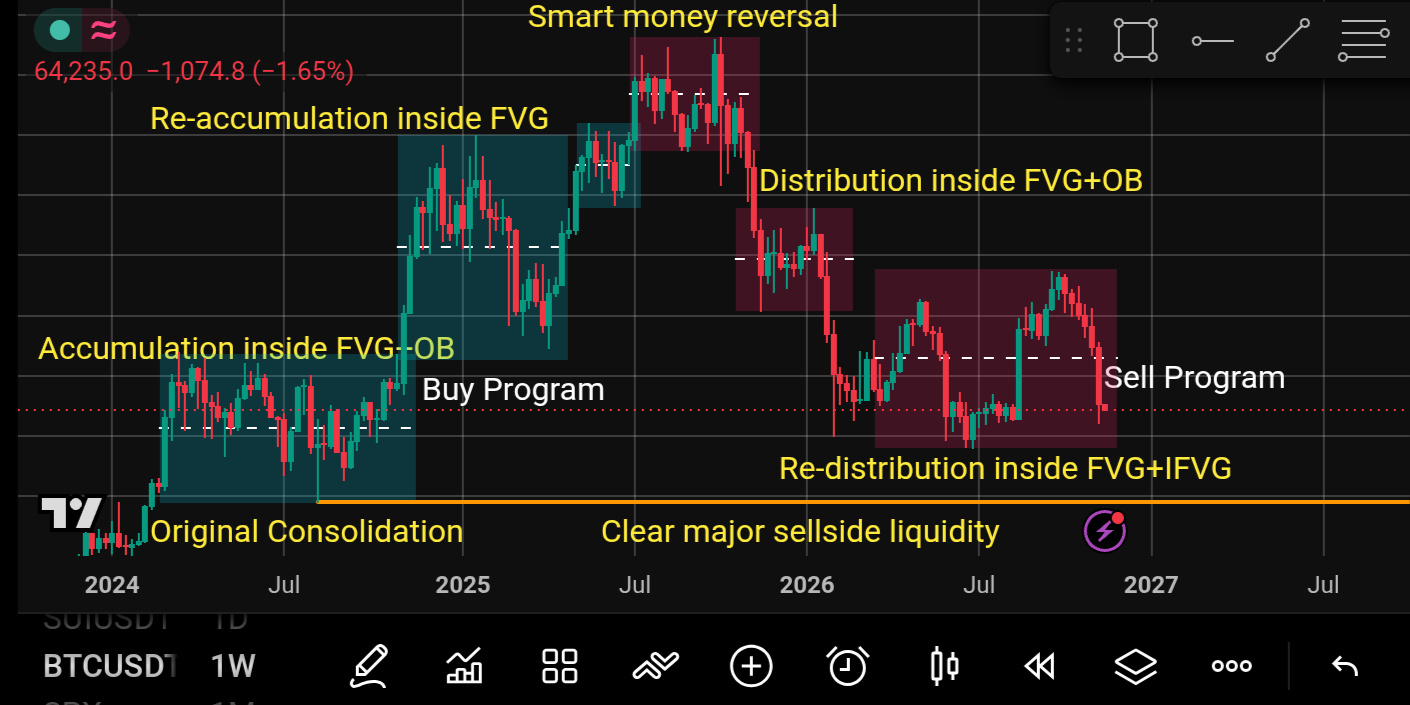
Weekly outlook 🙂 🤝 After that, study the weekly chart in the same way as I have explained to you on the daily chart. If you see any doubt in the weekly chart, then I am here to answer it. Do you see anything similar or not?I have tried to explain to you repeatedly that these are not my guesses, I am sharing my model and this is not some empty talk, I am telling you that these things will happen in the future.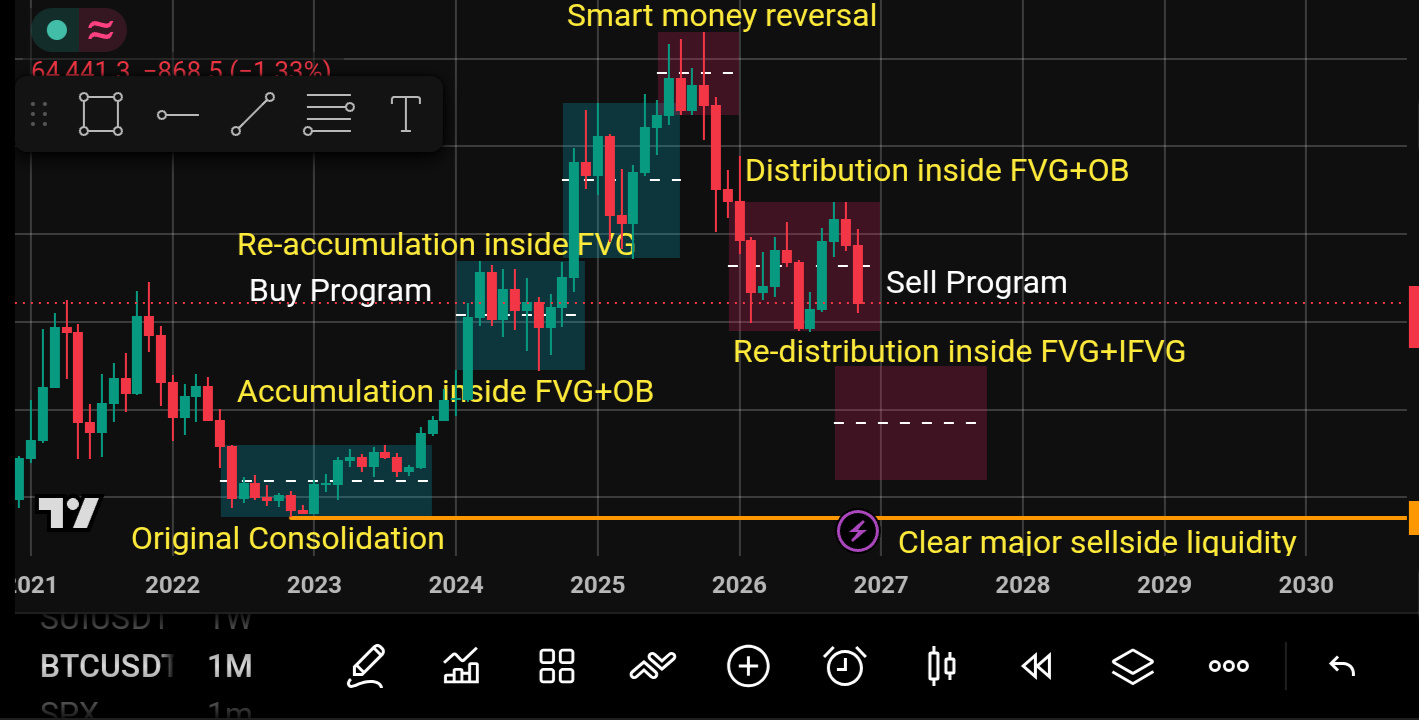
Monthly Outlook 😕In the same way, you have to combine the monthly chart with the daily chart and you have to work hard with your mind and you just have to find the flaw in it. Do you see any flaw in it or not?Please take my words seriously and try to understand. I don't want to create fear or panic in you, nor am I talking nonsense. I know that I have been trading for four years and no one can give as much time to the charts as I have.Some people say that those who spend too much time on charts are the ones who get fired, but I don't want to prove myself right now, but I know that people will abuse me here and call me stupid in the comments, but I will prove it to you with time and you will believe me like I have been convincing you in my previous post.I am telling you again that you should take a good look at the monthly chart that I have shared with you. These charts alone will explain everything to you. If you read this chart well, you will understand everything about what the market is trying to do.And it is important to remember that the market maker will not go down while delivering the sell-side model, the market will follow its order flow. It will go up, then down, then up, then down. In this way, it can take one to one and a half years to complete its model, according to the monthly chart.You must give your opinion in the comments and I will respect your opinion and respond accordingly.#bitcoin #Binance #BitcoinDunyamiz #BTC☀ #BTC走势分析