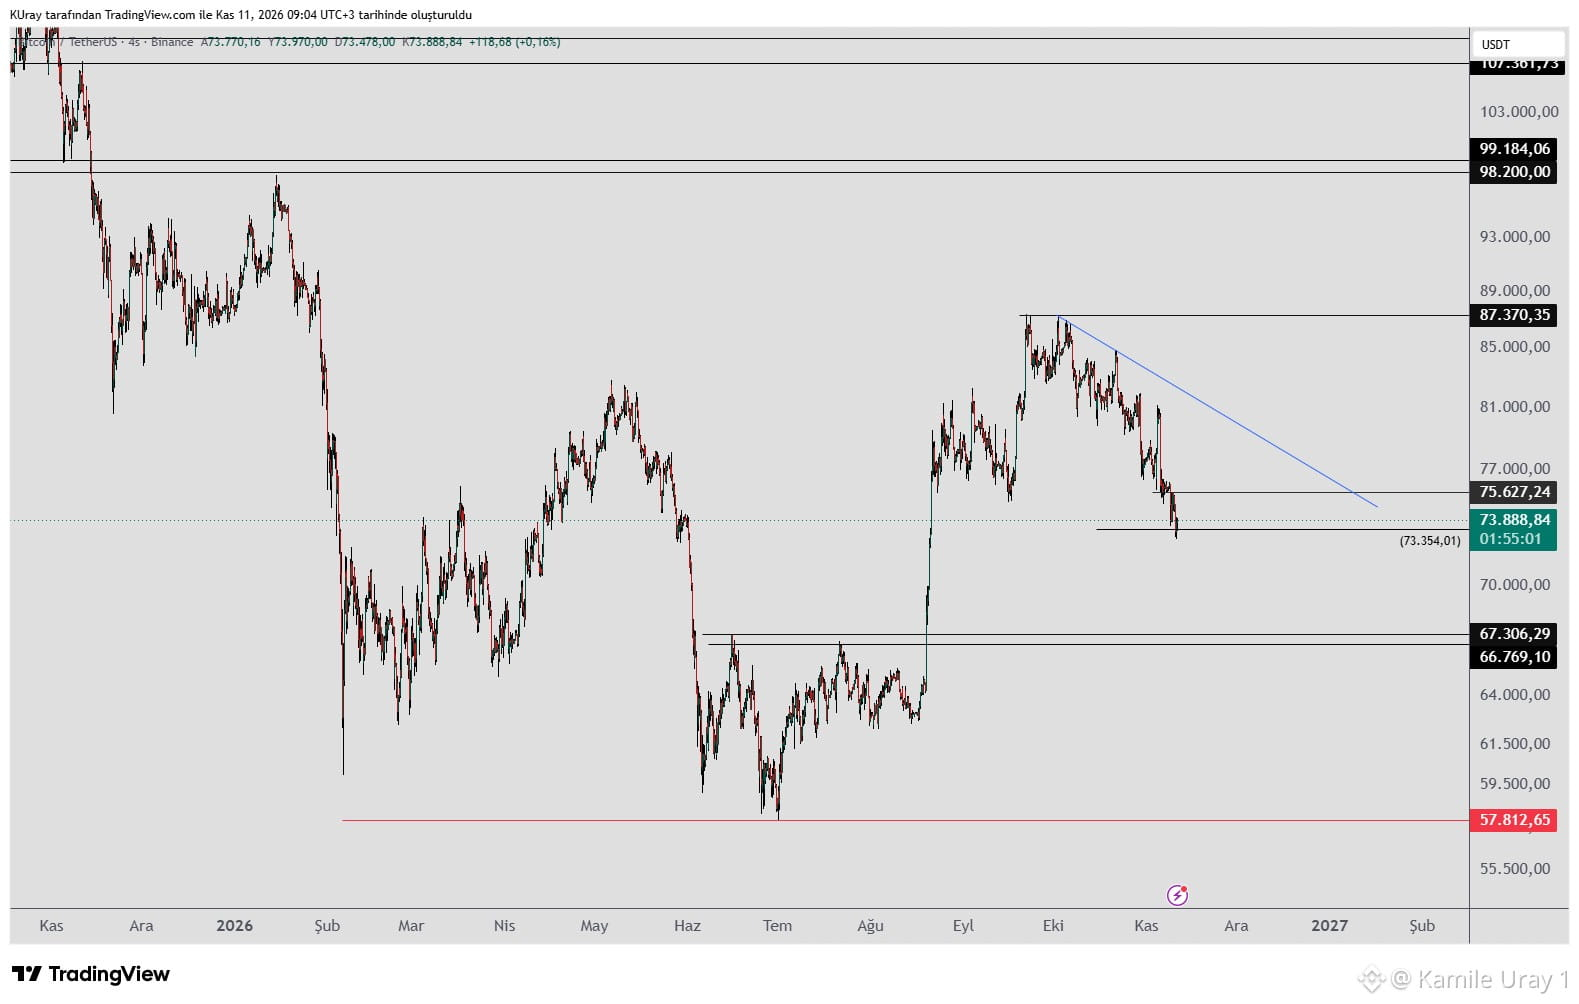
#BTC We are monitoring the trend line I’ve drawn in blue.
As long as the price fails to break above this blue downward-sloping line and close there, the bearish outlook remains.
A close above 81,281 would signify a break of this downward trend.
Looking at the most recent downward wave, the last local high formed at 75,627. If the price cannot break above this, the decline will likely continue; conversely, holding above 75,627 could allow for further upside. However, a bearish "Libra" pattern could potentially form around the 82,000 level (we will keep an eye on this as a possibility).
If the price remains below the trend line, there is a risk that the decline could extend toward the 66,000–67,000 range.
Key support levels to watch during any pullbacks are 73,354, 67,306, and 66,769. If we see signs of buyers stepping in at these support levels, a renewed upward move could follow.
As long as the price fails to break above this blue downward-sloping line and close there, the bearish outlook remains.
A close above 81,281 would signify a break of this downward trend.
Looking at the most recent downward wave, the last local high formed at 75,627. If the price cannot break above this, the decline will likely continue; conversely, holding above 75,627 could allow for further upside. However, a bearish "Libra" pattern could potentially form around the 82,000 level (we will keep an eye on this as a possibility).
If the price remains below the trend line, there is a risk that the decline could extend toward the 66,000–67,000 range.
Key support levels to watch during any pullbacks are 73,354, 67,306, and 66,769. If we see signs of buyers stepping in at these support levels, a renewed upward move could follow.