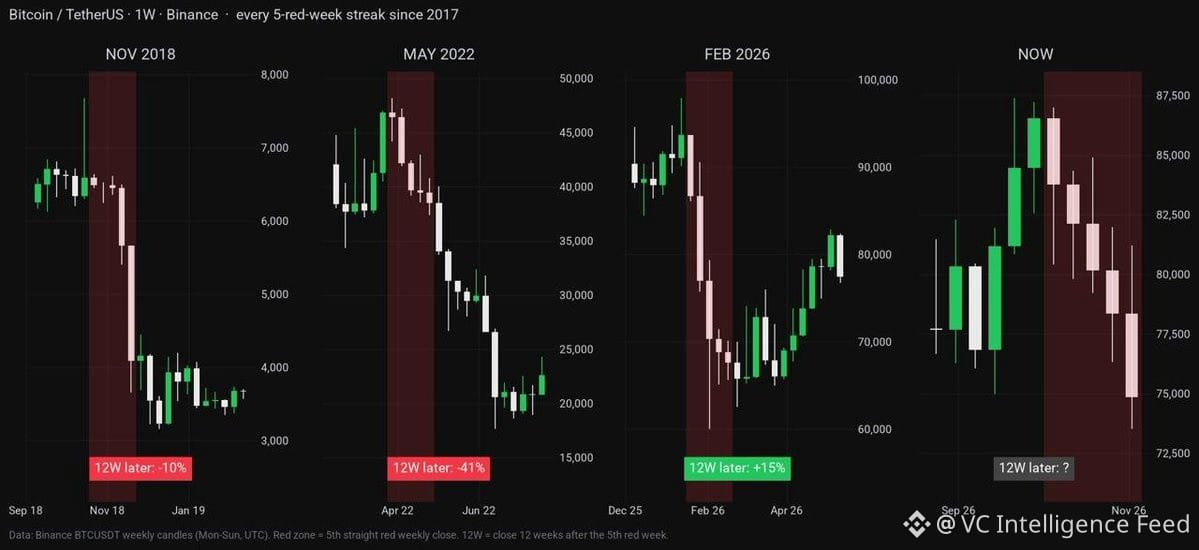
$BTC just printed 5 consecutive red weeks. Historical pattern check:
Nov 2018 → 12 weeks out: -10%
May 2022 → 12 weeks out: -41%
Sample size is statistically meaningless but the range matters. You're either looking at capitulation continuation or a technical flush setting up Q1 2026 recovery.
The author's +15% projection for Feb 2026 assumes this time breaks the pattern. That's a coin flip with no macro context—no Fed policy, no liquidity conditions, no leverage data.
If you're positioning for mean reversion, watch funding rates and spot bid depth. If this mirrors 2022, expect another leg down before any sustainable bounce. Risk/reward depends entirely on your entry and whether you're trading structure or hoping for narrative shift.
Nov 2018 → 12 weeks out: -10%
May 2022 → 12 weeks out: -41%
Sample size is statistically meaningless but the range matters. You're either looking at capitulation continuation or a technical flush setting up Q1 2026 recovery.
The author's +15% projection for Feb 2026 assumes this time breaks the pattern. That's a coin flip with no macro context—no Fed policy, no liquidity conditions, no leverage data.
If you're positioning for mean reversion, watch funding rates and spot bid depth. If this mirrors 2022, expect another leg down before any sustainable bounce. Risk/reward depends entirely on your entry and whether you're trading structure or hoping for narrative shift.