
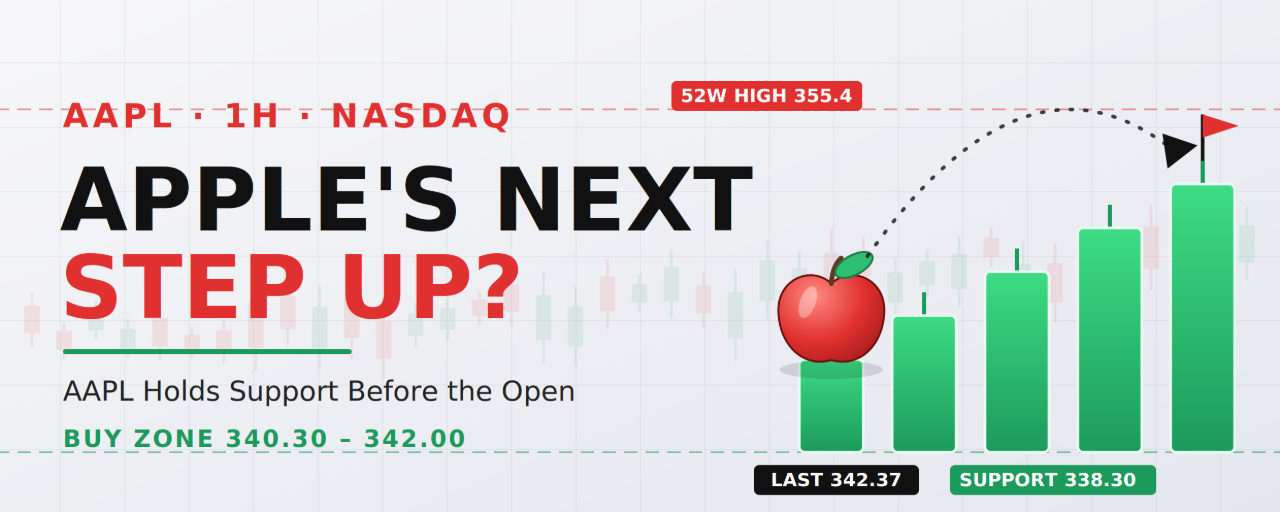


Chart: Apple Inc. (AAPL), 1H, NASDAQ. Last price 342.35, which matches Friday’s (Nov 6) close of 342.37. Chart captured Nov 8, 21:19 UTC, with US markets closed.
Short answer: the long setup is valid, but only on a pullback into support. AAPL is sitting right on a cluster of levels, and Tuesday’s inflation report could move the whole market.
What happened this week
AAPL had a violent week, much of it tied to the broad market. It fell to a low near 325.33 on November 3, then jumped about 5% on November 4 as big tech rallied after the midterms, closing at a record 349.51. On November 5 it hit a new 52-week high at 355.38 but reversed to close at 344.17 as the wider tech selloff hit. On Friday it traded between 338.30 and 345.79 and closed at 342.37.
Volume fell on Friday’s pullback, which is a mildly healthy sign. Several sources keep the daily structure bullish. Bernstein raised its price target from 370 to 380 on November 4. On the cautious side, Daiwa warned Apple could lose momentum next year, and the weak broader market is a headwind.
What the chart shows
Big V-shaped swing: price dropped to a Higher Low near 325.5, then rocketed to the 355 high, with a long gap-up leaving a green FVG between about 332 and 350.
Retracement levels: measured from the 355.03 high down to the 325.5 low, they sit at about 343.76 (38.2%), 340.27 (50%) and 336.80 (61.8%). Price at 342.35 is between the first two.
Support stack: 341.27 (the white line), the 20-day moving average near 341.97, the 338.56 green line (Friday’s low area), a volume-based support near 336.13, then 332.00 and 321.49.
Resistance: 343.8 (the 38.2% level and a daily midpoint near 343.1), 345.79 (Friday’s high), about 347.2 (a daily pivot), 349.51 (record close) and 355.0–355.4 (the 52-week high).
Long trade plan for the open
Setup A: support buy (preferred)
Entry zone: 340.30–342.00, the 50% retracement, the white line and the 20-day average
Stop loss: 337.80, below Friday’s low and the 338.56 line
TP1: 345.80, Friday’s high
TP2: 349.50, the record close
TP3: 355.00, the 52-week high
Setup B: deeper pullback
Entry zone: 336.10–338.50, the 61.8% level and volume support
Stop loss: 331.50, below the 332.00 line
TP1: 343.80
TP2: 349.50
TP3: 355.00
Setup C: momentum breakout
Entry: a 1H candle close above 346.00, ideally on rising volume
Stop loss: 342.80
Targets: 349.50, then 355.00, then 360.00 if the 52-week high breaks
Measured from 341.20 to the 337.80 stop, Setup A pays about 1.4R at TP1, 2.4R at TP2 and 4.1R at TP3. Setup B, from 337.30, pays about 1.2R, 2.2R and 3.2R. Setup C pays about 1R, 2.6R and 4R. After TP1, consider moving the stop to breakeven.
Timing and risk for the open
Don’t chase a gap. If AAPL opens well above the entry zones, wait for a pullback. If it opens below 338.30, skip the trade and let it prove support first.
CPI is the main risk. October CPI is due Tuesday, November 10, at 8:30 a.m. ET. A hot print would raise Fed hike odds, and a weak market could pull AAPL through support. A cool print could lift tech.
Ex-dividend on November 12. The $0.27 dividend will lower the price by about that much on the ex-date. It isn’t a signal, only an adjustment.
Market backdrop is shaky. The S&P 500 just had its worst week since April 2025, so keep position sizes modest.
What invalidates the idea
A 1H close below 336.10 means the volume support and 61.8% level failed.
A daily close below 332.00 would put the 321.49 level in play and wipe out the bullish structure.
A fast rejection at 343.8–345.8 followed by a lower high would suggest the bounce is weak.
Live cross-check
The chart matches live data. Multiple sources report AAPL closed Friday at 342.37, with a day range of 338.30–345.79 and after-hours trading near 342.8. I could not find a Monday quote, so check the pre-market price and the CPI timing before you act.
If you want to trade this on Binance, look in the TradFi tab under Futures for a stock contract. I haven’t verified that an Apple contract is listed, so confirm that in your account.
Bottom line
Yes, a long setup is valid. The best entry is a pullback to 340.30–342.00, with a stop under 337.80 and targets at 345.80, 349.50 and 355.00. Keep size small until CPI is out, and don’t chase a gap.
⚠️ Disclaimer: This is not financial advice. This analysis is for educational and informational purposes only. Stock and financial markets are volatile, and you can lose your capital. Always do your own research, manage your risk, and never trade with money you can’t afford to lose.
@Binance Square Official #Apple #BinanceReopensWithdrawalsForHYPE&APT #SouthKoreaDraftLawTargets15To20%ShareholderCap #Binance #ChartSniper