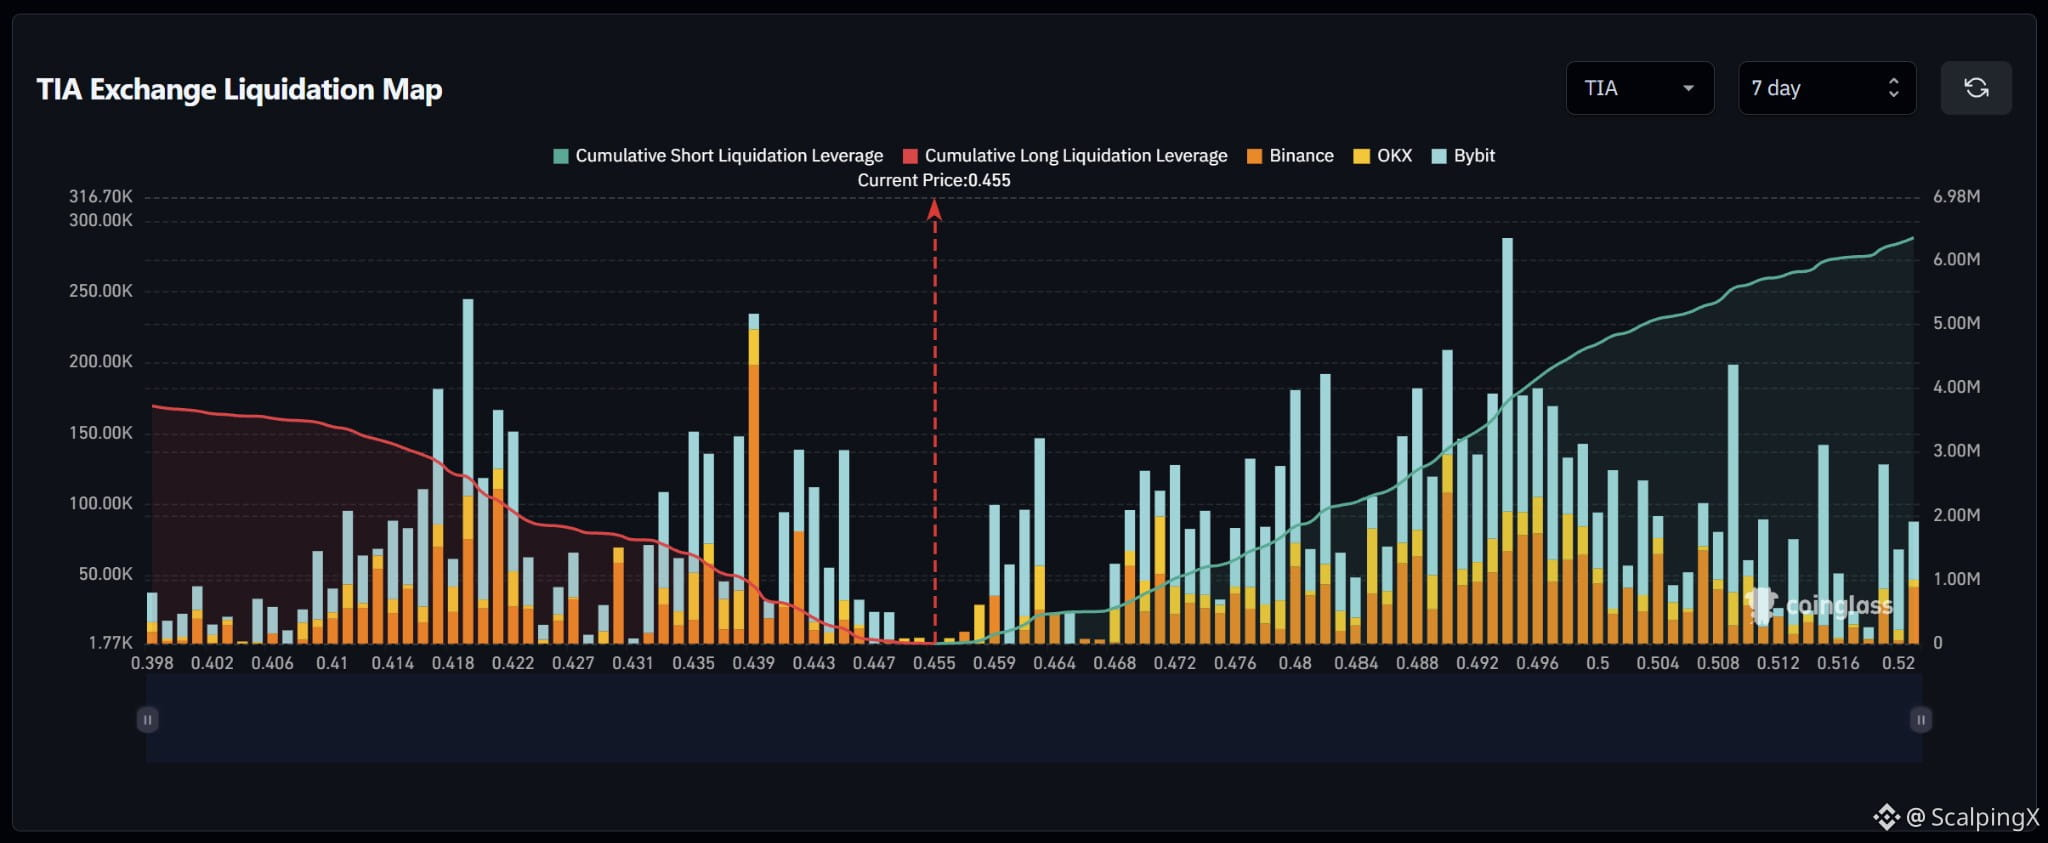
$TIA – Liquidation Map (7 days) – Index ~0.455
🧭 The preferred scenario is an upside short-liquidation sweep, starting at 0.459–0.463. Estimated cumulative short exposure is around $6.3M, versus roughly $3.7M on the long side within the displayed range.
🔺 If price clears and holds above 0.463, attention shifts to 0.469–0.474. Bars around 0.464–0.467 are quite small, making sustained momentum after the initial sweep worth watching.
🎯 Holding above 0.474 brings 0.477–0.483 into focus, followed by the denser cluster at 0.487–0.500. The largest upside bar sits near 0.494, where short liquidations could amplify volatility. Beyond 0.500, bars become more scattered, although a notable spike remains near 0.509.
⚖️ Losing 0.451 without reclaiming it weakens the upside scenario, shifting attention to 0.447–0.450, then 0.442–0.446 and 0.434–0.440. A sweep of 0.459–0.463 followed by a quick drop below 0.459 would increase the risk of a failed upside move.
#LiquidationMap
🧭 The preferred scenario is an upside short-liquidation sweep, starting at 0.459–0.463. Estimated cumulative short exposure is around $6.3M, versus roughly $3.7M on the long side within the displayed range.
🔺 If price clears and holds above 0.463, attention shifts to 0.469–0.474. Bars around 0.464–0.467 are quite small, making sustained momentum after the initial sweep worth watching.
🎯 Holding above 0.474 brings 0.477–0.483 into focus, followed by the denser cluster at 0.487–0.500. The largest upside bar sits near 0.494, where short liquidations could amplify volatility. Beyond 0.500, bars become more scattered, although a notable spike remains near 0.509.
⚖️ Losing 0.451 without reclaiming it weakens the upside scenario, shifting attention to 0.447–0.450, then 0.442–0.446 and 0.434–0.440. A sweep of 0.459–0.463 followed by a quick drop below 0.459 would increase the risk of a failed upside move.
#LiquidationMap