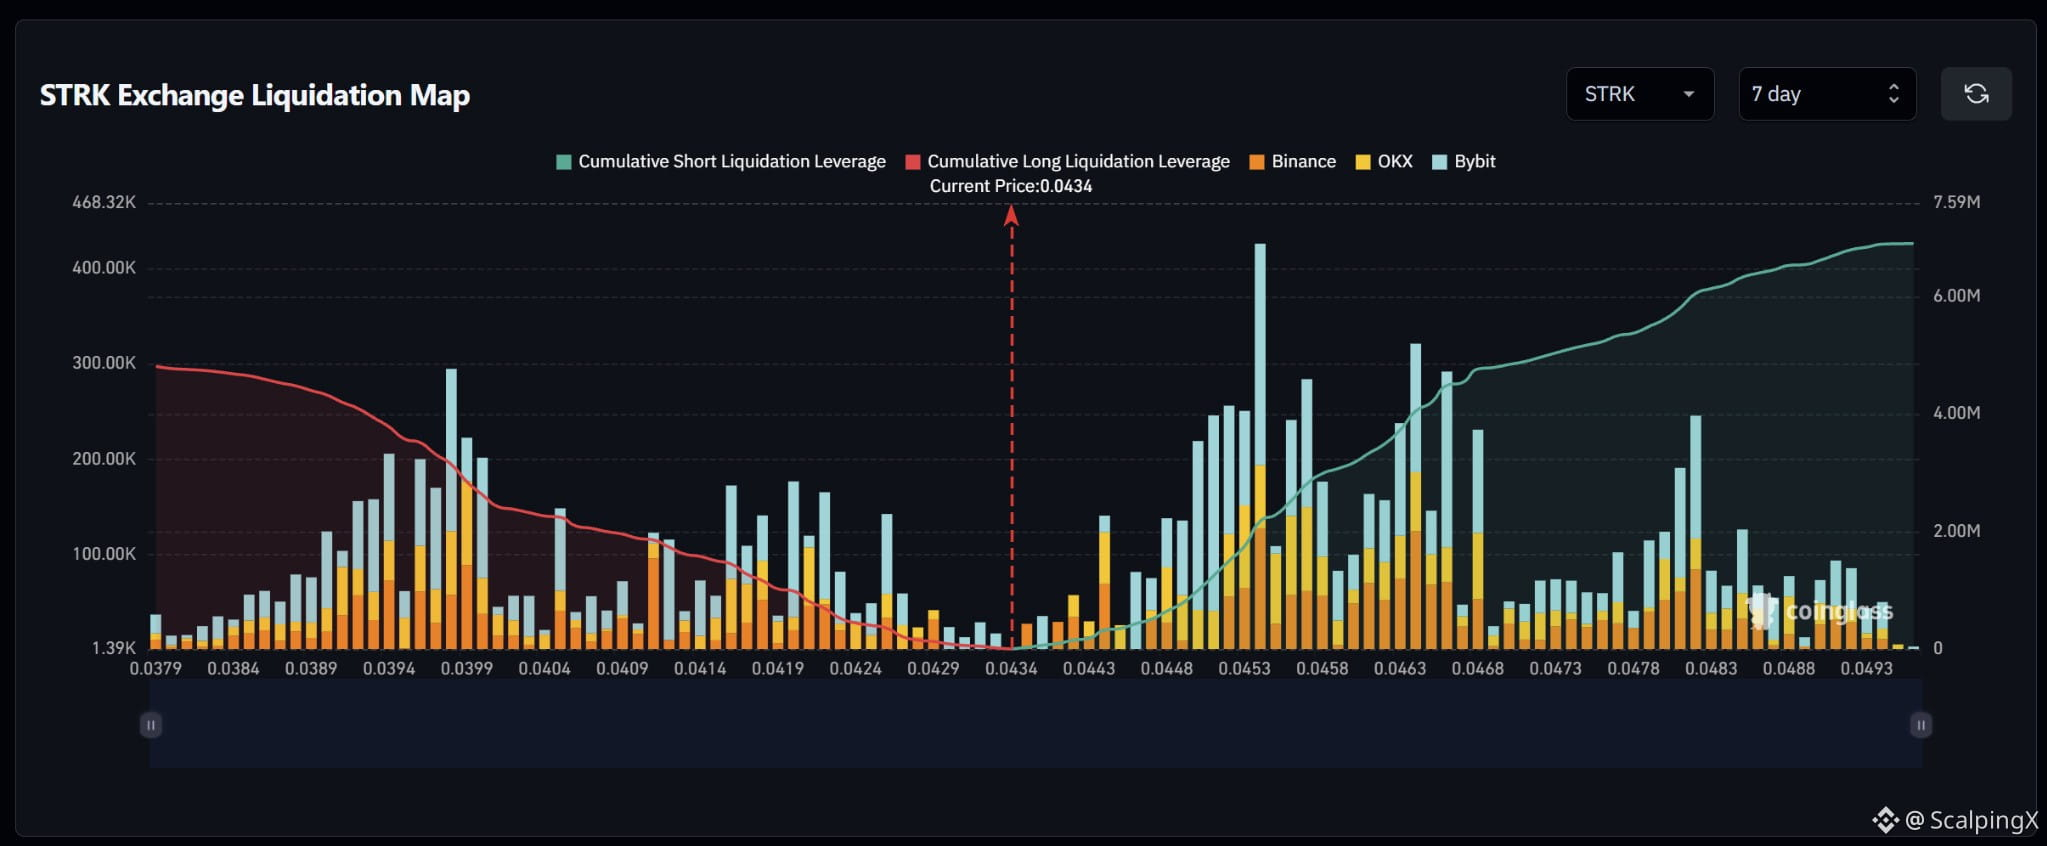
$STRK – Liquidation Map (7 days) – Index ~0.0434
🧭 The preferred scenario is an upside short sweep. Clusters become more prominent at 0.0443–0.0448, followed by the dense 0.0450–0.0458 band. Nearby long exposure below is relatively sparse; estimated cumulative short liquidation exposure is nearly $7 million across the displayed range, exceeding the long side.
🔺 A break and hold above 0.0440 shifts attention to 0.0443–0.0448. The reaction after the sweep will help assess whether price can reach 0.0450–0.0458, with the map’s largest bar near 0.0454.
🎯 Holding above 0.0458 brings clusters at 0.0462–0.0468 into focus next. Short liquidations there could amplify the advance. Farther up lies 0.0480–0.0483, separated by smaller bars at 0.0469–0.0478.
⚖️ Losing 0.0430 without a reclaim would weaken the upside scenario and shift attention to 0.0420–0.0426, then 0.0414–0.0418. A denser long cluster lies farther down at 0.0392–0.0400. Avoid chasing a sweep of 0.0450–0.0458 that quickly reverses below 0.0450.
#LiquidationMap
🧭 The preferred scenario is an upside short sweep. Clusters become more prominent at 0.0443–0.0448, followed by the dense 0.0450–0.0458 band. Nearby long exposure below is relatively sparse; estimated cumulative short liquidation exposure is nearly $7 million across the displayed range, exceeding the long side.
🔺 A break and hold above 0.0440 shifts attention to 0.0443–0.0448. The reaction after the sweep will help assess whether price can reach 0.0450–0.0458, with the map’s largest bar near 0.0454.
🎯 Holding above 0.0458 brings clusters at 0.0462–0.0468 into focus next. Short liquidations there could amplify the advance. Farther up lies 0.0480–0.0483, separated by smaller bars at 0.0469–0.0478.
⚖️ Losing 0.0430 without a reclaim would weaken the upside scenario and shift attention to 0.0420–0.0426, then 0.0414–0.0418. A denser long cluster lies farther down at 0.0392–0.0400. Avoid chasing a sweep of 0.0450–0.0458 that quickly reverses below 0.0450.
#LiquidationMap