


Impossible Cloud Network (ICNT) is attracting attention after a powerful price rally, but the latest correction has raised an important question: are buyers taking a break, or are sellers gaining control?
At the time of the provided screenshots, ICNT was trading around $0.2064, down approximately 10.07% over 24 hours, after reaching a high of $0.2532.
Let's examine all four timeframes.
15-Minute Chart: Buyers Attempt to Stabilize
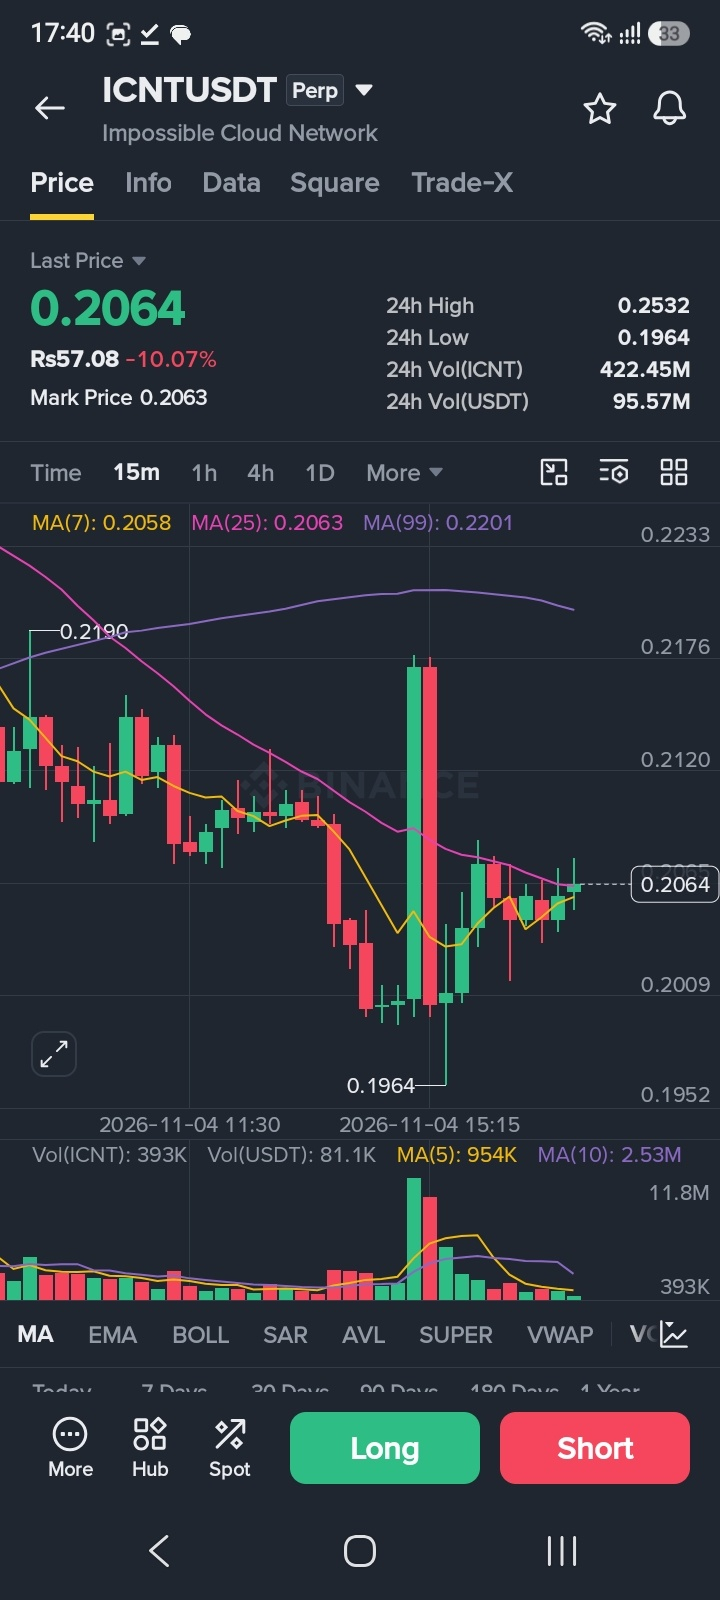
Moving averages:
MA7: $0.2058
MA25: $0.2063
MA99: $0.2201
The price is hovering around MA7 and MA25 but remains below MA99. This indicates a possible short-term stabilization attempt, although a stronger recovery signal is still missing.
1-Hour Chart: Recovery Faces Resistance
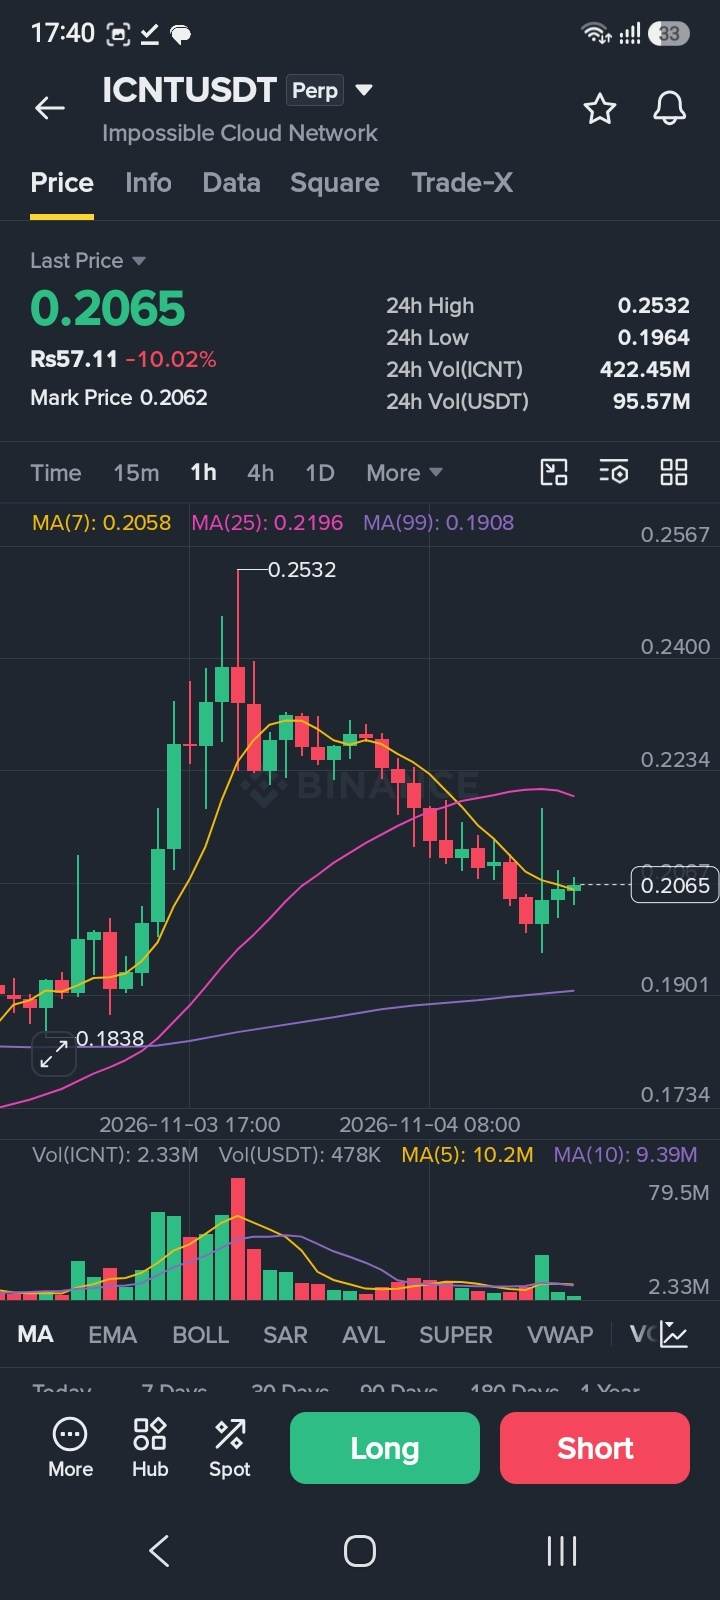
Moving averages:
MA7: $0.2058
MA25: $0.2196
MA99: $0.1908
ICNT is trading below MA25, showing that the short-term trend remains under pressure.
The $0.2196 area is an important level to reclaim. Until then, any upward move could face selling pressure.
4-Hour Chart: The Correction Needs Attention
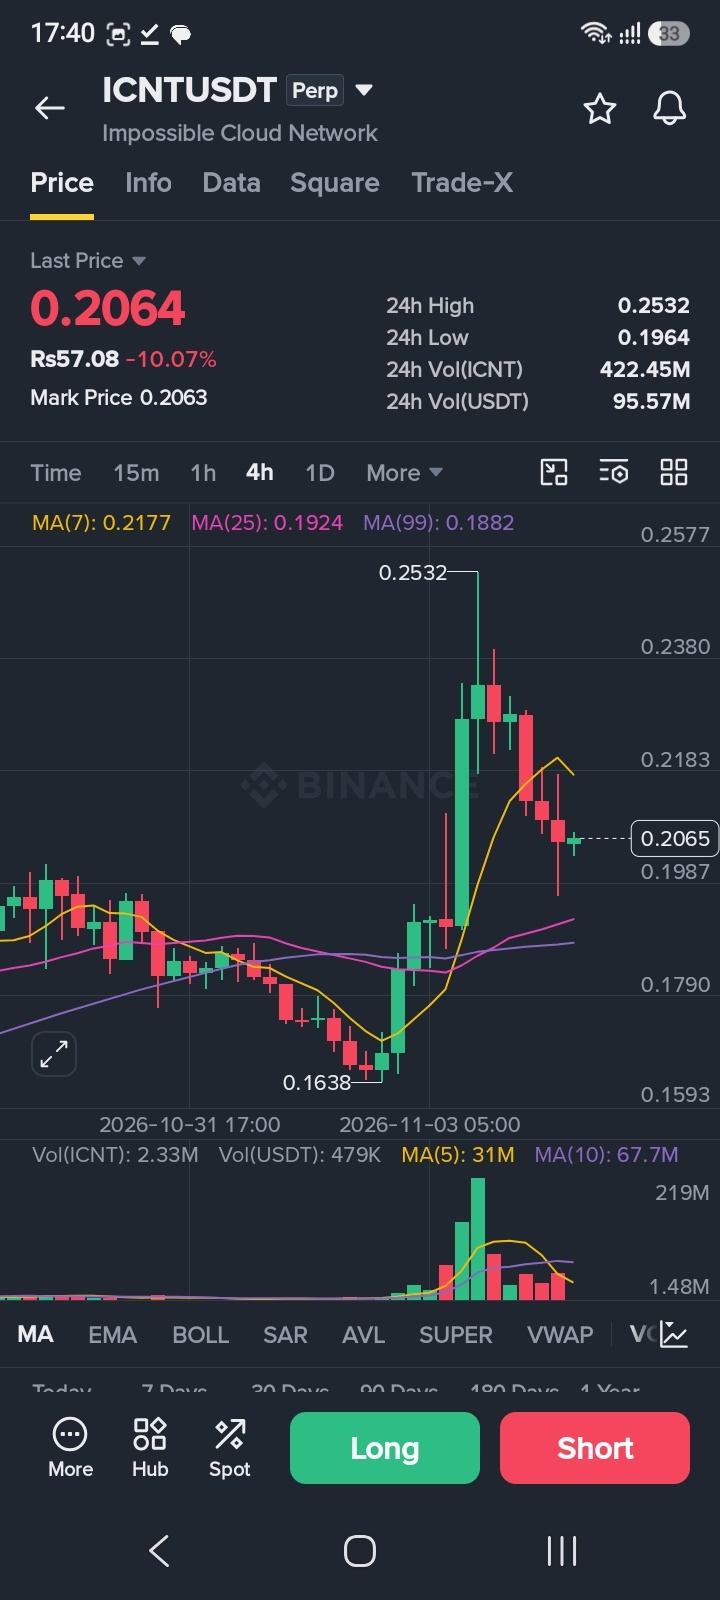
Moving averages:
MA7: $0.2177
MA25: $0.1924
MA99: $0.1882
The current price is below MA7 but above MA25 and MA99.
This suggests that the broader 4-hour structure has not completely broken down, although momentum has weakened significantly following the recent rally.
Daily Chart: The Bigger Picture
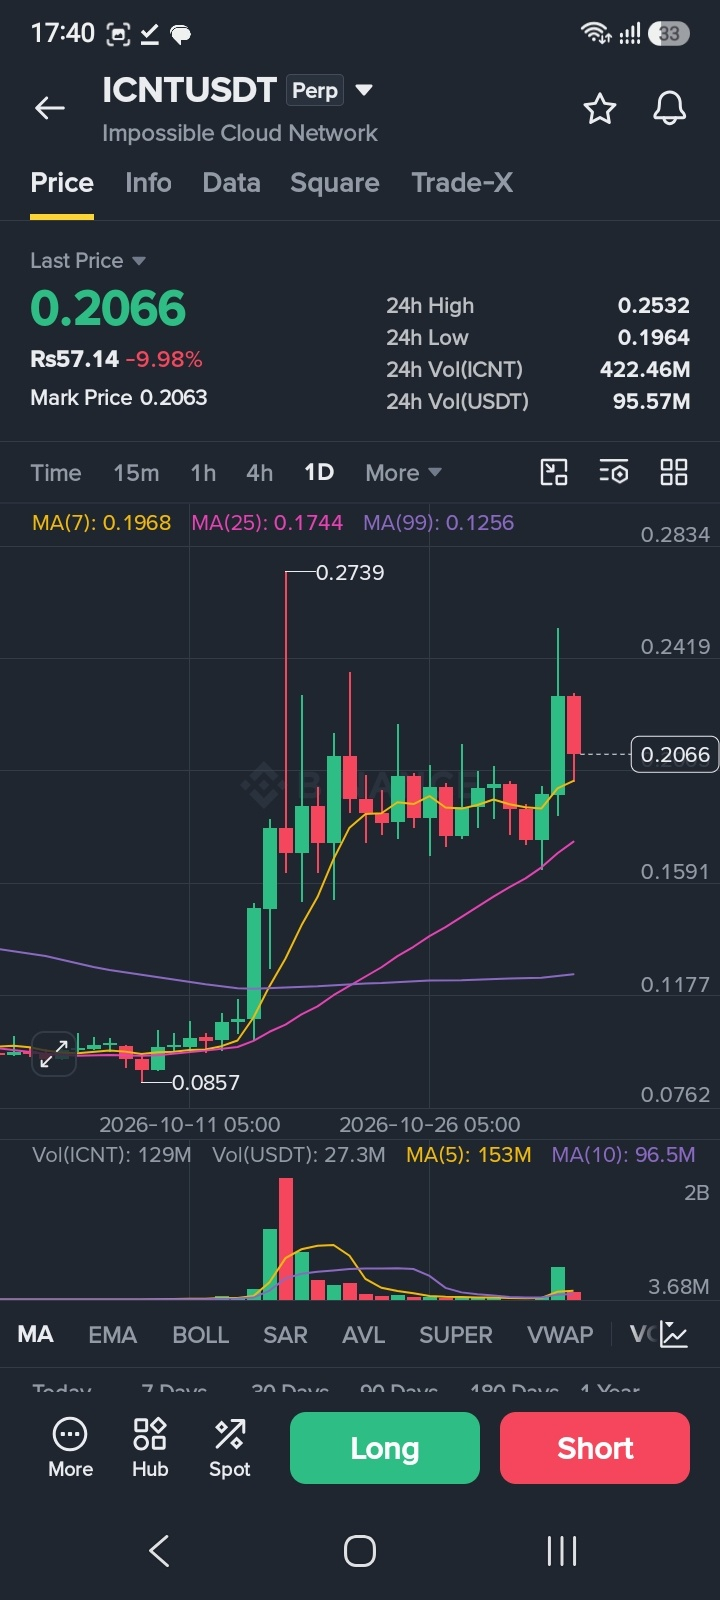
The daily moving averages show:
MA7: $0.2177
MA25: $0.1924
MA99: $0.1882
ICNT remains above its longer daily moving averages, which keeps the broader structure relatively constructive.
However, a recovery above the short-term moving average is needed before stronger bullish momentum can be considered.
Volume: An Important Warning
The screenshots show substantial trading activity, with approximately 422.45 million ICNT and $95.57 million in USDT traded over 24 hours.
The displayed volume averages also show that recent volume has been fluctuating significantly. A convincing recovery should ideally come with increasing buying volume, not just a price bounce.
Key Levels to Watch
Resistance
$0.2120
$0.2177–$0.2201
$0.2380
$0.2532
Support
$0.2000
$0.1964
$0.1908–$0.1882
A sustained move above $0.2200 with stronger volume could improve the bullish outlook.
On the downside, losing $0.1964 could expose the $0.1908–$0.1882 support area.
The Question Every ICNT Trader Should Be Asking
After reaching $0.2532, ICNT has pulled back sharply.
Is this correction creating another opportunity for buyers, or is the market warning traders to be more cautious?
Would you wait for a confirmed recovery above $0.22, or watch the $0.1964 support first?

Share your thoughts.
Disclaimer: This analysis is based on the supplied Binance chart screenshots and is for educational purposes only. It is not financial advice. Cryptocurrency trading involves significant risk.
#ICNT #ImpossibleCloudNetwork #BinancePick #CryptoAnalysis #TechnicalAnalysis #altcoins #farcamcrypto