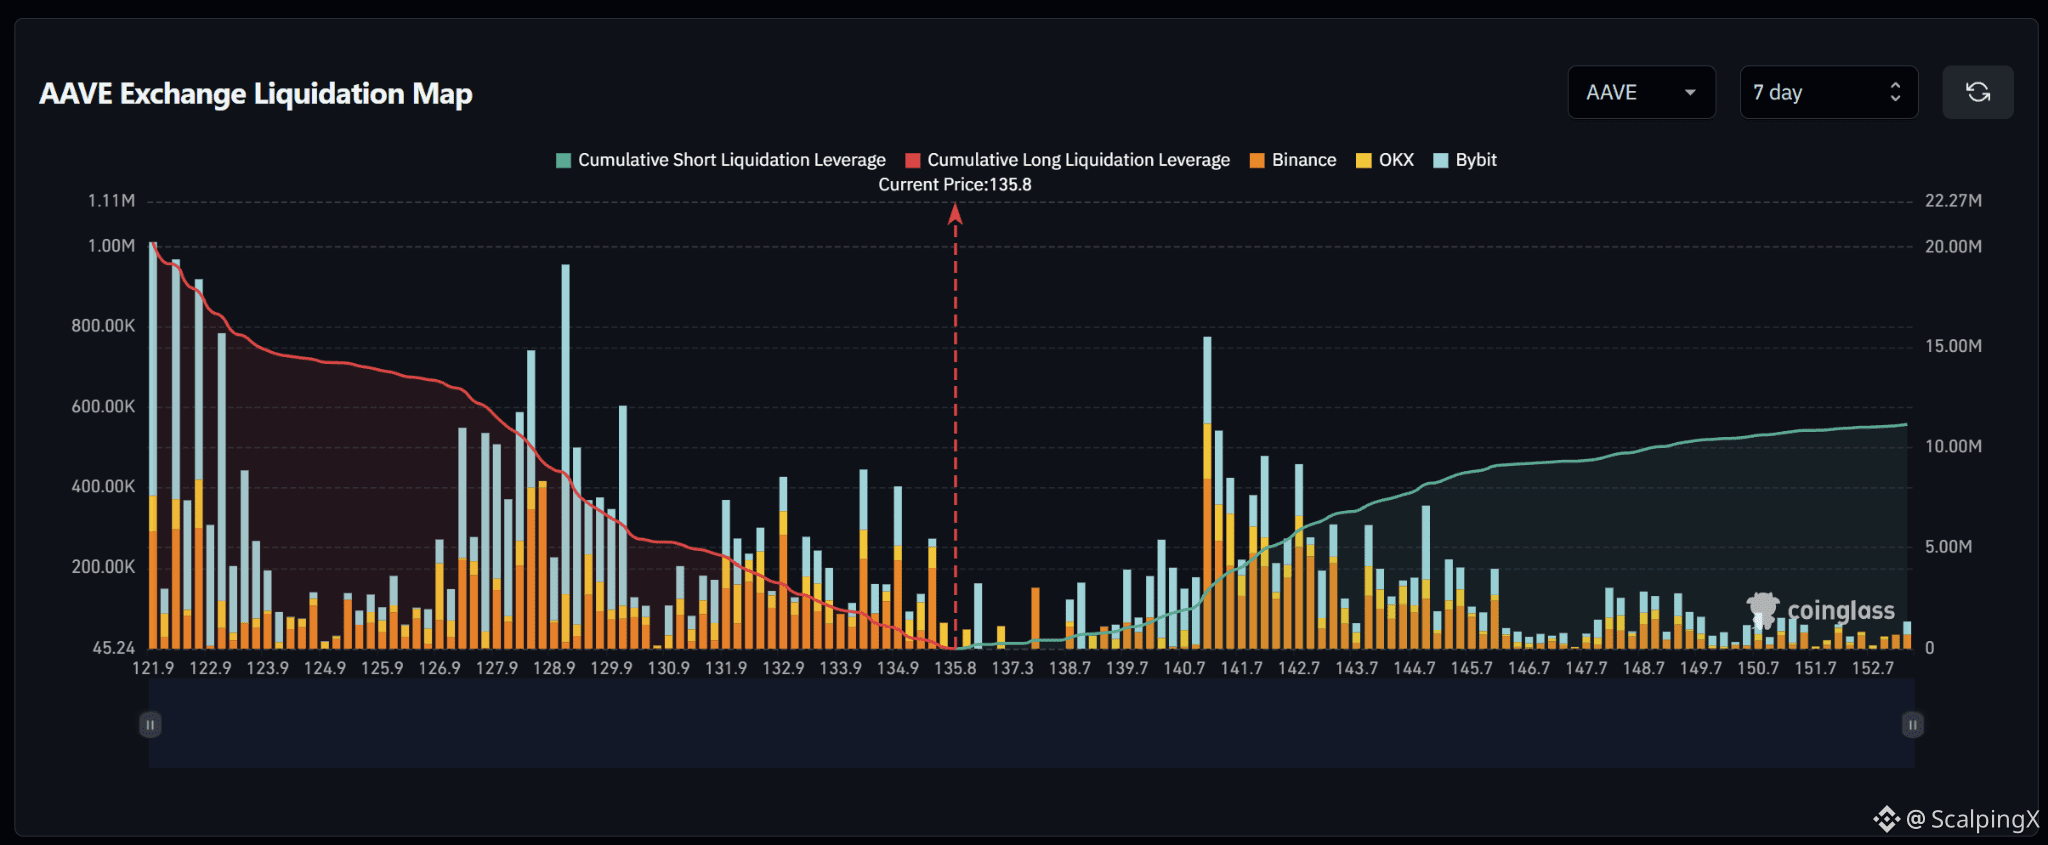
$AAVE – Liquidation Map (7 days) – Index ~135.8
🧭 The map favors a downside long sweep first. Estimated cumulative long liquidation exposure is roughly $20M, versus nearly $11M on the short side across the displayed range. Long clusters around 134–135.4 sit closer to price than the major short band at 140–143.
🔻 Losing 135.4 without a reclaim shifts attention to 134–135.0, particularly near 134.2 and 134.8. Long liquidations there could amplify the decline.
🎯 A further break below 134 brings 131.5–133 into focus. The 127–130 band remains a farther target if the decline persists. Conversely, a downside sweep followed by a quick reclaim of 135.4 would weaken the case for further declines.
⚖️ A break and hold above 137.3 shifts priority to short clusters at 138.5–140.5, then 141–142.8, particularly near 141.1. Density drops noticeably beyond 146; avoid chasing a major cluster sweep that quickly reverses.
#LiquidationMap
🧭 The map favors a downside long sweep first. Estimated cumulative long liquidation exposure is roughly $20M, versus nearly $11M on the short side across the displayed range. Long clusters around 134–135.4 sit closer to price than the major short band at 140–143.
🔻 Losing 135.4 without a reclaim shifts attention to 134–135.0, particularly near 134.2 and 134.8. Long liquidations there could amplify the decline.
🎯 A further break below 134 brings 131.5–133 into focus. The 127–130 band remains a farther target if the decline persists. Conversely, a downside sweep followed by a quick reclaim of 135.4 would weaken the case for further declines.
⚖️ A break and hold above 137.3 shifts priority to short clusters at 138.5–140.5, then 141–142.8, particularly near 141.1. Density drops noticeably beyond 146; avoid chasing a major cluster sweep that quickly reverses.
#LiquidationMap