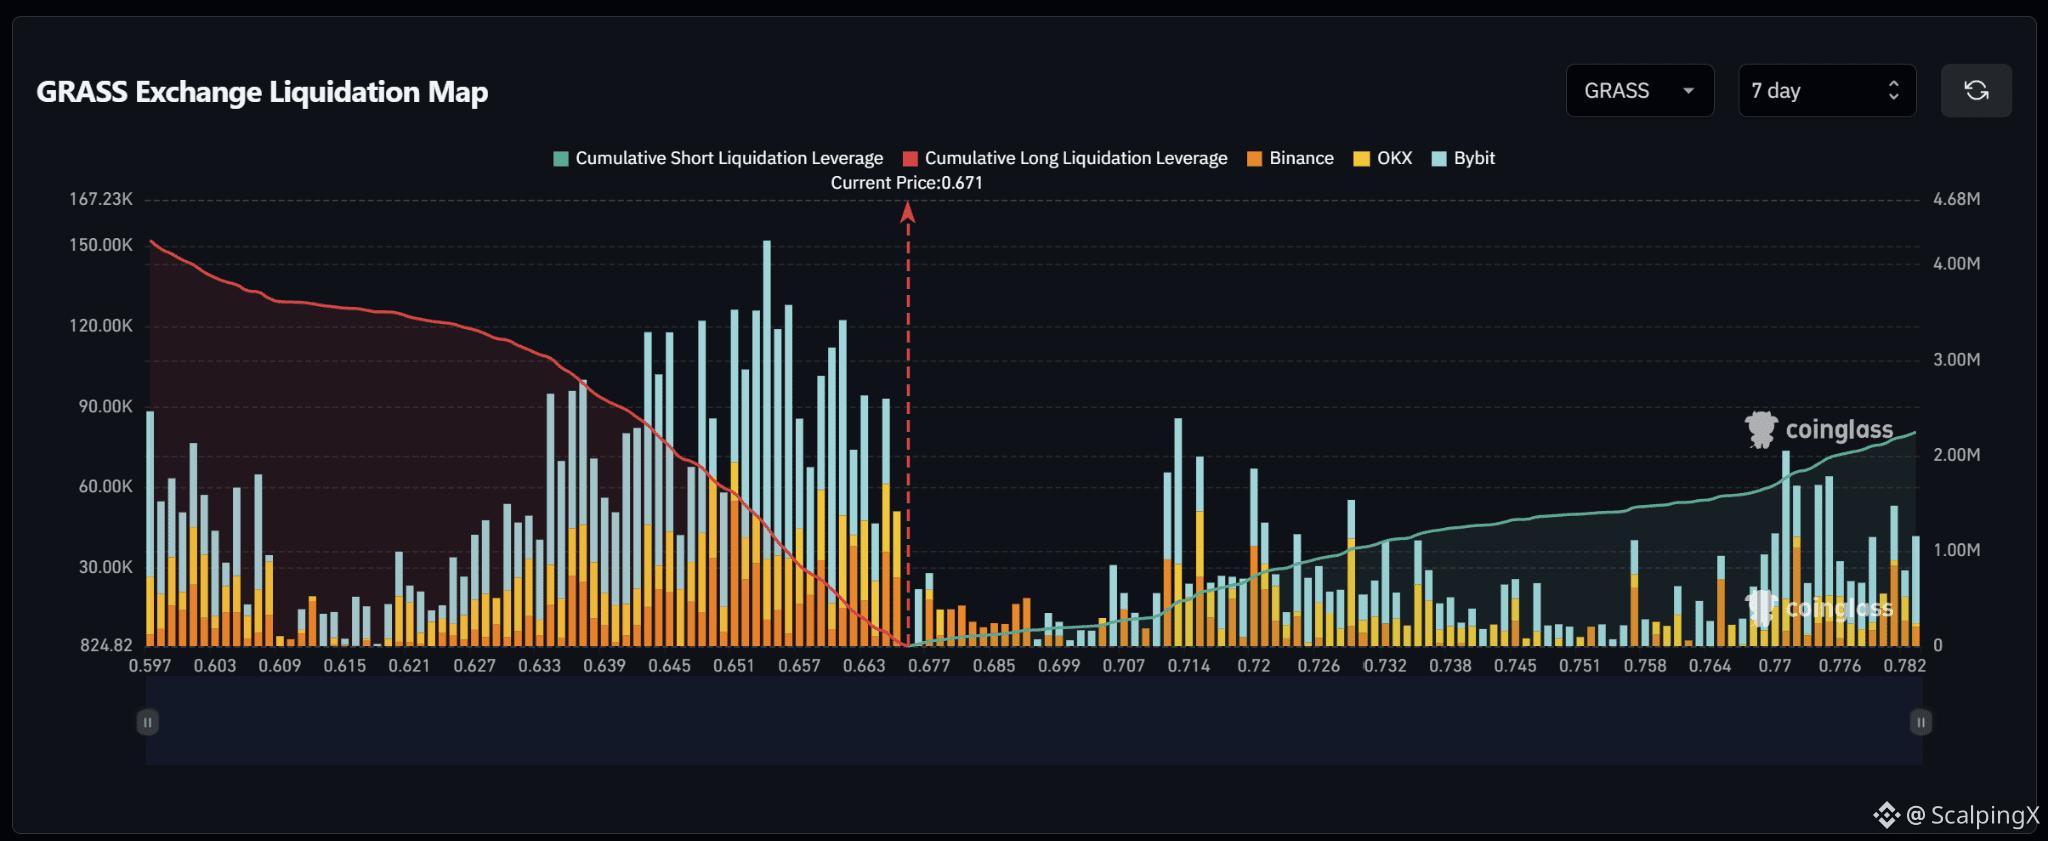
$GRASS – Liquidation Map (7 days) – Index ~0.671
🧭 GRASS favors a downside long sweep first. Estimated cumulative long liquidations reach roughly $4.3M, nearly twice short exposure across the displayed range. The dense long band at 0.645–0.665 sits close to price and outweighs nearby overhead clusters.
🔻 The first target is 0.660–0.665. Losing 0.660 without a reclaim shifts attention to 0.651–0.657, featuring the largest liquidation spike near 0.654. Long liquidations there could amplify the decline.
🎯 A break below 0.651 opens targets at 0.643–0.647, then 0.635–0.640. However, sweeping near 0.654 and reclaiming 0.657 would weaken further downside expectations; avoid chasing after the large cluster has been cleared.
⚖️ A break and hold above 0.685 weakens the downside-first scenario. Liquidation density is thin across 0.685–0.707, with the notable short cluster at 0.711–0.722 becoming the upside target if recovery holds.
#LiquidationMap