



Bubblemaps (BMT) has surged around 69% in 24 hours, reaching a high of $0.05144 in the supplied market snapshot. But can the rally continue, or is a pullback coming?
📊 Market Snapshot
Price: $0.03782
24H High: $0.05144
24H Low: $0.02196
24H Volume: $58.59M USDT
⏱️ 1H Chart Analysis
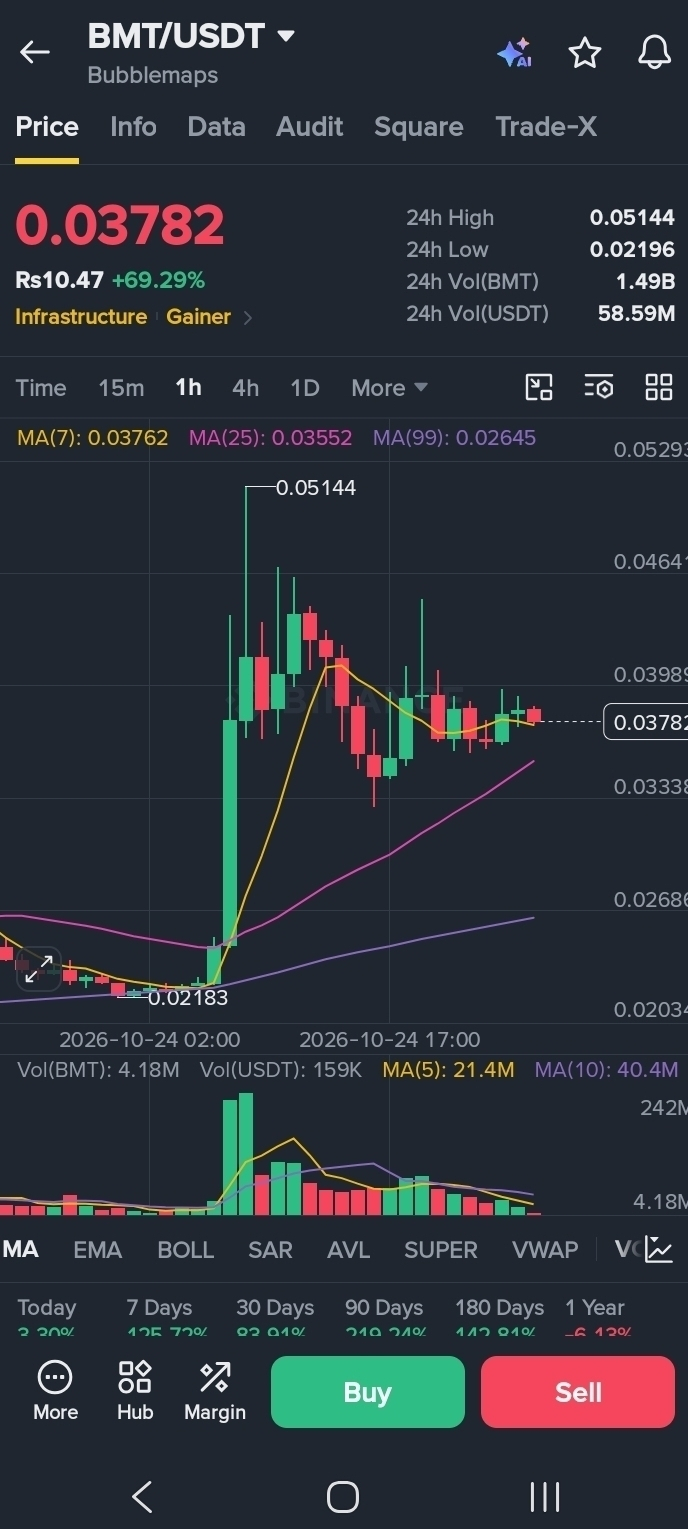
On the 1-hour chart, BMT is trading near $0.03782, above the MA(7) at $0.03762 and MA(25) at $0.03552. This suggests short-term momentum remains positive, but resistance is approaching.
Resistance: $0.03989
Support 1: $0.03552
Support 2: $0.03338
A convincing break above $0.03989 could open the way toward higher levels. A drop below $0.03552 may signal weakening momentum.
📅 1D Chart Analysis
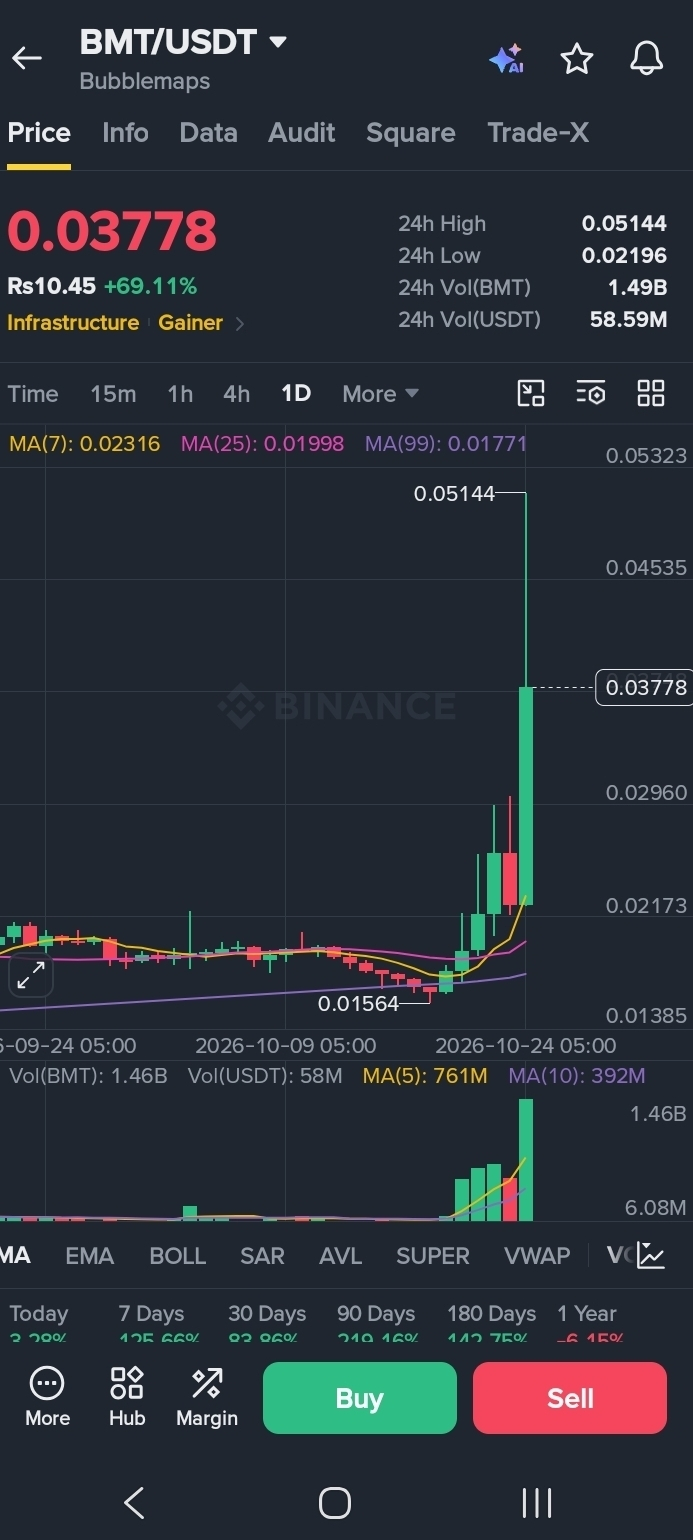
The daily chart shows a strong upward move, with price well above the daily moving averages: MA(7) at $0.02316, MA(25) at $0.01998, and MA(99) at $0.01771.
However, such a sharp rally can also attract profit-taking.
Resistance 1: $0.04535
Major resistance: $0.05144
Support: $0.02960
A sustained move toward $0.04535 and $0.05144 would support the bullish scenario. If selling pressure increases, a deeper correction remains possible.
🔥 What Happens Next?
Bullish scenario: BMT breaks $0.03989 and holds above it, potentially targeting $0.04535 and $0.05144.
Bearish scenario: BMT loses $0.03552, putting $0.03338 and potentially $0.02960 into focus.
💬 Your prediction: Can BMT hit $0.05144 again, or is a correction coming first?
Disclaimer: This analysis is based on the supplied chart screenshots and is for educational purposes only. Crypto is volatile; these levels are not guaranteed and this is not financial advice.