


Arbitrum (ARB) is showing strong short-term momentum after gaining approximately 12.03% in 24 hours, with price around $0.1983 in the chart snapshot. Buyers are active, but the $0.2027 resistance level is now an important area to watch.
🔎 1H Chart Analysis
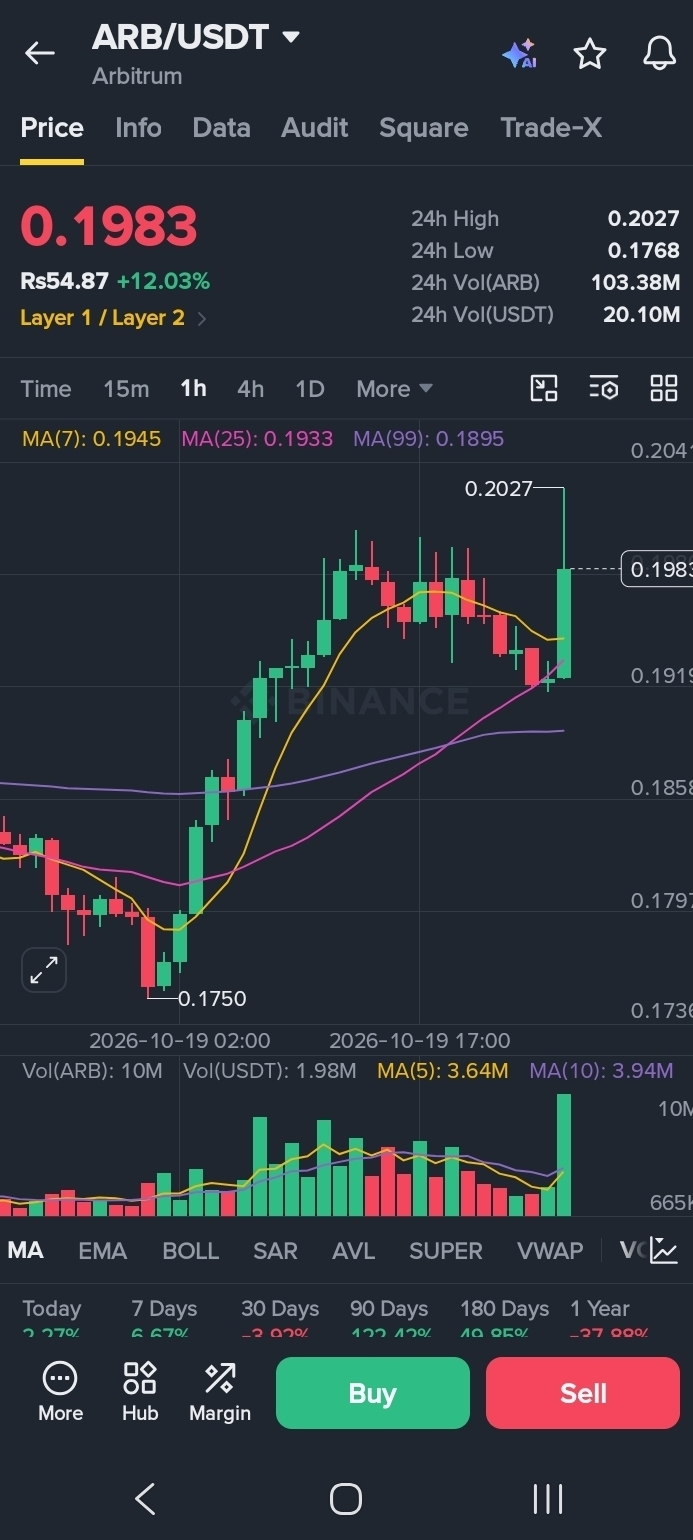
Price: 0.1983
MA(7): 0.1945
MA(25): 0.1933
MA(99): 0.1895
ARB is trading above all three hourly moving averages, suggesting positive short-term momentum. The 0.2027 level is the immediate resistance to watch. A convincing breakout with stronger volume could support further upside, while rejection may lead to a pullback.
📊 1D Chart Analysis
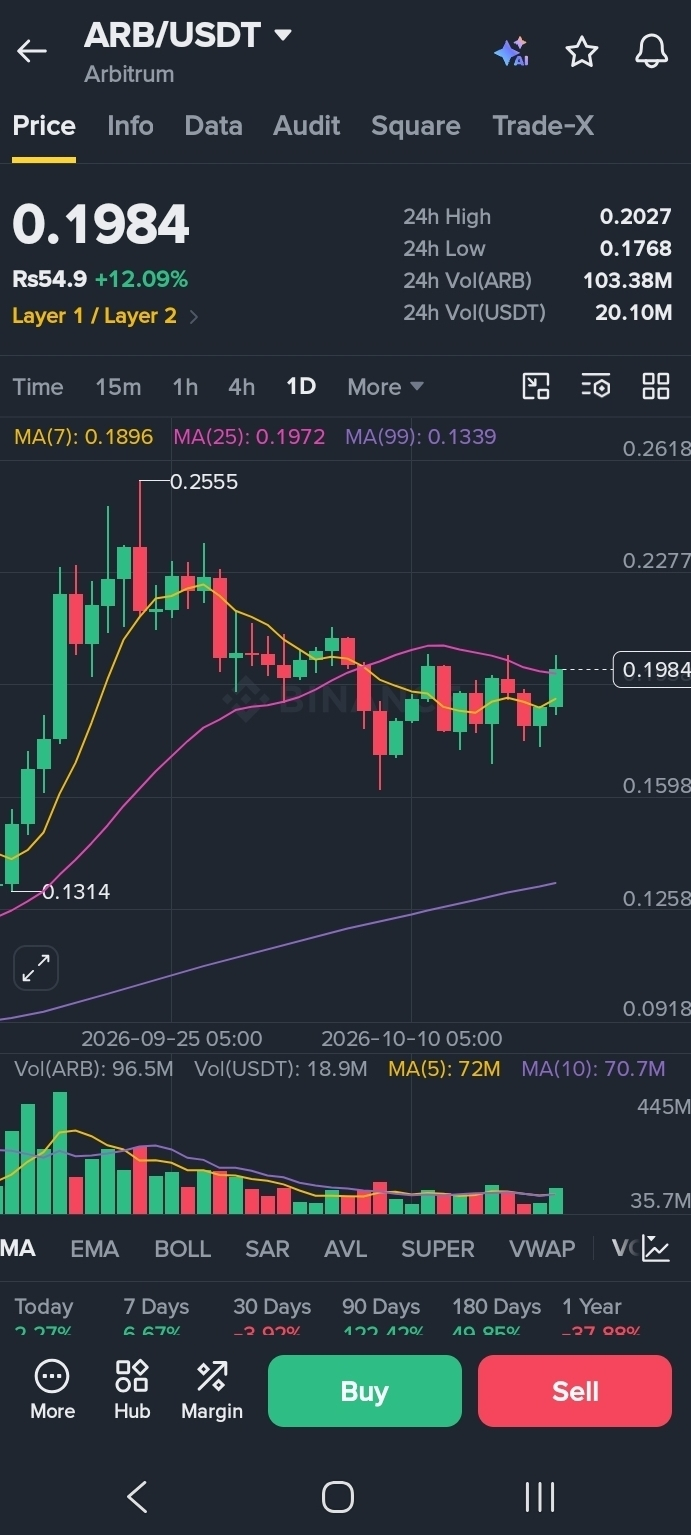
Price: 0.1984
MA(7): 0.1896
MA(25): 0.1972
MA(99): 0.1339
On the daily chart, ARB is above MA(7) and slightly above MA(25), showing improving momentum. However, a confirmed daily close above resistance would provide stronger evidence that the recovery can continue.
🎯 Key Levels to Watch
Resistance: 0.2027
Near-term support zone: 0.1970–0.1945
Additional support: 0.1933–0.1895
Bullish scenario: A breakout above 0.2027 with sustained volume may strengthen the upside setup.
Pullback scenario: If price loses the nearby support zone, a deeper correction could follow.
💡 Final View
ARB currently has a constructive short-term structure, but its recent rally makes chasing price risky. Watch the 1H momentum and 1D candle close before making a decision. These levels are based on the supplied chart snapshot and may change as the market moves.
Disclaimer: This is technical analysis for educational purposes, not financial advice. Cryptocurrency markets are volatile, and no price level or scenario guarantees a profit.
#ARB #Arbitrum #ARBUSDT #CryptoAnalysis #TechnicalAnalysis #BinanceSquare #altcoins