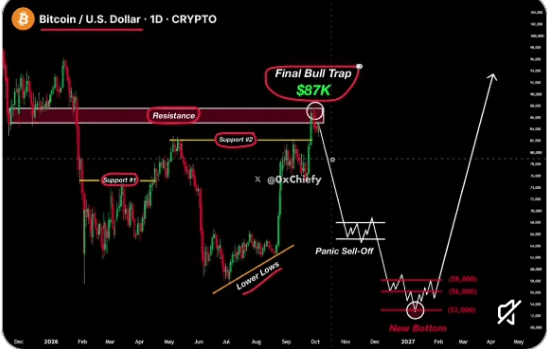

Bitcoin breaks $87,000, attracts late buyers, and then suddenly crashes before starting its next major rally?
I have been looking at this BTC/USD daily chart, and one thing stands out to me: the market may be approaching a critical decision zone where liquidity, investor psychology, institutional demand, and long-term cycle expectations collide.
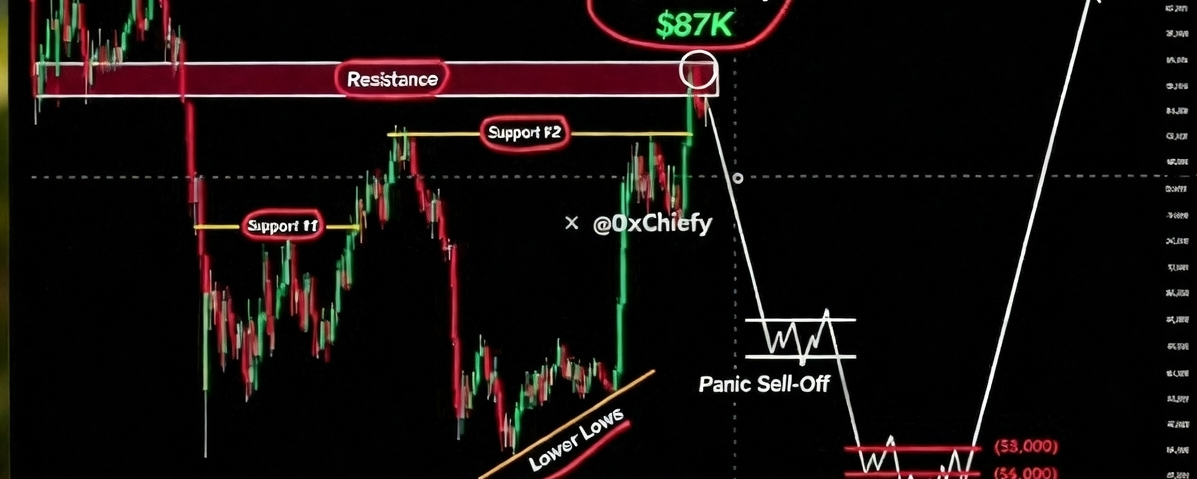
The chart presents a bearish scenario first: a rejection near $87K, a panic sell-off, and a possible bottom around $53K–$58K before a major recovery.
But is this really what the market will do?
Let’s look beyond the candles and examine on-chain data, exchange flows, institutional demand, and global expert forecasts.
1. TECHNICAL ANALYSIS: WHY $87K MATTERS
The chart highlights three important areas:
$87,000 Major resistance
This is the zone where the chart anticipates a possible bull trap. If Bitcoin breaks above resistance but fails to hold it on a daily closing basis, late buyers could become trapped.
A breakout alone is not enough. I would want to see strong spot buying, sustained volume, and a successful retest before treating it as a confirmed bullish breakout.
$80K–$82K Critical decision zone
This area is important because it can help determine whether the latest recovery is still healthy.
If buyers defend this region and reclaim resistance, Bitcoin could attempt another move higher.
However, a breakdown accompanied by rising selling volume could expose lower support levels.
$53K–$58K Deep correction scenario
The chart projects a possible decline toward this region before a long-term recovery.
But remember: these levels are a scenario drawn on the chart, not a confirmed bottom or a guaranteed price target.
A fall of that magnitude would require substantial selling pressure, deteriorating liquidity, or a major shift in investor demand.
My observation: I would not automatically call a rejection at $87K the beginning of a bear market. I would watch how Bitcoin behaves around $80K–$82K first.
2. ON-CHAIN DATA: WHAT ARE BITCOIN HOLDERS ACTUALLY DOING?
This is where the analysis becomes interesting.
Exchange flows can reveal whether investors are moving Bitcoin toward potential selling venues or withdrawing it into longer-term custody.
Recent exchange-wallet data provides an important signal.
According to tracked exchange flows, during the 30 days ending October 5, 2026, approximately 64,692 more BTC left exchanges than entered them.
Tracked exchange balances also declined from approximately 734,391 BTC on September 5 to 727,245 BTC on October 5.
What does this mean?
When coins leave exchanges, it can indicate that investors intend to hold rather than sell immediately. Falling exchange balances can also reduce readily available selling supply.
However, withdrawals alone do not prove that institutions are accumulating. Custody transfers, wallet reorganizations, and other movements can influence these figures.
I would combine exchange flows with spot demand, ETF flows, and long-term holder behavior before drawing a firm conclusion.
Are long term Bitcoin holders losing confidence?
The latest available figures suggest otherwise.
As of October 8, approximately 63.04% of Bitcoin's supply had not moved for at least one year, according to tracked holder data. That share had increased slightly over the preceding month.
This is worth watching because long term holders can provide insight into the market's underlying conviction.
But there is another side to this story.
Long term holders can distribute coins into strength, too. A rising Bitcoin price does not guarantee that every experienced holder intends to keep holding.
I would monitor whether long term holder spending accelerates during any rally toward resistance.
The real question is not simply how much Bitcoin is being held. It is whether new demand can absorb the coins that existing holders decide to sell.
3. INSTITUTIONAL DEMAND: CAN ETF BUYERS SUPPORT BTC?
Bitcoin's next major move may depend as much on traditional financial markets as on crypto-native activity.
Spot Bitcoin ETFs provide a bridge between conventional investors and Bitcoin. Their daily net flows can help us understand whether institutional and advisory demand is strengthening or weakening.
However, ETF demand can change quickly.
On October 7, U.S. spot Bitcoin ETFs recorded approximately $487.1 million in net outflows, according to reporting published by The Block on October 8. Bitcoin subsequently traded below $83,000 after recently reaching above $87,000.
This creates an important conflict:
Bullish: Exchange balances are declining, and long-term holder supply remains broadly stable.
Bearish: Recent ETF outflows suggest that institutional demand may not be strong enough to sustain every breakout.
Confirmation needed: Bitcoin must attract renewed spot demand and hold key support levels.
If ETF inflows return while exchange balances continue falling, the supply and demand picture could become more favorable for buyers.
If ETF outflows persist while price loses support, the risk of a deeper correction increases.
I would not judge institutional demand from one day's data. The trend over several sessions matters more.
4. WHAT ARE GLOBAL ANALYSTS PREDICTING?
There is no single worldwide consensus on Bitcoin's next move. Current forecasts show a meaningful difference between the near-term trading outlook and longer-term price expectations.
QCP Capital: A possible $80K–$90K trading range
QCP Capital's reported base-case outlook anticipates Bitcoin trading between $80,000 and $90,000 during the fourth quarter of 2026.
The firm identified $80K–$82K as a potential buying area and $88K–$90K as a zone to reduce exposure if ETF inflows fail to strengthen.
This view broadly aligns with the chart's resistance zone concern.
It suggests that Bitcoin could remain volatile and range bound rather than immediately beginning another sustained rally.
Citigroup: $113K over the next 12 months
Citigroup raised its 12-month Bitcoin forecast to $113,000, up from $82,000.
The bank cited stronger crypto activity, a supportive macroeconomic backdrop, and renewed ETF inflows. It also projected approximately $5 billion in Bitcoin ETF inflows over the following 12 months.
This is a longer term bullish outlook, not a prediction that Bitcoin will rise in a straight line.
A move toward $113K would likely require sustained demand and supportive market conditions.
What do these forecasts tell me?
Both outlooks can be correct over different time horizons.
Bitcoin could trade between $80K and $90K in the near term, experience a correction, and still move toward a higher level over the following year.
Equally, if demand weakens significantly, the bullish longer-term target could take longer to materialize or fail entirely.
A price target is a forecast, not evidence that the market must reach it.
5. THE GLOBAL MACRO FACTORS THAT COULD CHANGE EVERYTHING
Bitcoin no longer trades in isolation from global financial markets.
Three factors deserve particular attention.
1. Federal Reserve policy
Interest-rate expectations influence borrowing costs, bond yields, the dollar, and investor appetite for risk.
If monetary conditions become more restrictive than markets expect, Bitcoin could face additional selling pressure.
If financial conditions ease, risk assets may receive support. However, even a pause in rate hikes does not automatically guarantee a Bitcoin rally.
2. U.S. dollar and Treasury yields
A stronger dollar and rising Treasury yields can make riskier assets less attractive to some investors.
Recent market reporting has linked pressure on Bitcoin to rising yields, a stronger dollar, and geopolitical concerns.
I would watch these markets alongside BTC rather than relying only on crypto indicators.
3. Geopolitical risk and global liquidity
Unexpected geopolitical developments can trigger rapid moves across equities, commodities, currencies, and cryptocurrencies.
In a risk off environment, Bitcoin may experience forced selling even when its longer-term fundamentals remain intact.
That is why I never assume that positive on-chain data can protect the market from every macroeconomic shock.
6. THE FOUR-YEAR BITCOIN CYCLE: IS THE BULL MARKET OVER?
Bitcoin's four-year cycle remains one of the most discussed topics in crypto.
Historically, Bitcoin has experienced major advances, speculative peaks, deep corrections, and extended recovery periods around its halving events.
But there is an important limitation.
Historical cycles are useful reference points, not a reliable calendar for predicting the next top or bottom.
The current market also operates in a different environment, with spot ETFs, greater institutional participation, changing liquidity conditions, and broader connections to traditional financial markets.
I would therefore examine three factors together:
Supply: How much Bitcoin is entering the market, and how much is being distributed by existing holders?
Demand: Are spot buyers and ETFs absorbing available supply?
Liquidity: Are global financial conditions supporting or restricting investment in risk assets?
If supply remains relatively tight while demand strengthens, Bitcoin could recover even if the traditional four-year cycle model suggests that a correction is overdue.
On the other hand, if institutional demand weakens and holders begin distributing aggressively, the cycle narrative will not prevent a substantial decline.
7. MY BTC SCENARIOS: WHAT I WOULD WATCH NEXT
Based on the supplied chart and the available market evidence, these are the scenarios I would monitor.
Scenario
Important levels
What would confirm it?
Bullish continuation
$87K–$90K resistance
Strong spot demand, rising volume, and a successful breakout retest
Sideways consolidation
$80K–$90K
Mixed flows, repeated resistance rejections, and defended support
Bearish breakdown
Below $80K
Daily closes below support, sustained selling, and weakening ETF demand
Deep correction
$53K–$58K
A major deterioration in market structure and continued downside momentum
Long term recovery
After a confirmed bottom
Improving liquidity, renewed demand, and a sequence of higher highs and higher lows
The $53K–$58K region is a hypothetical downside scenario from the supplied chart. It is not my prediction that Bitcoin must revisit those prices.
Likewise, a move above $90K would not automatically confirm a new all-time high.
I would wait for price structure and demand to confirm the direction.
8. THE BIGGEST TRADING MISTAKE RIGHT NOW
Many traders see a powerful green candle and immediately assume that the market will continue upward.
Others see one rejection and immediately call for a crash.
Both approaches can be dangerous.
A breakout can attract leveraged longs. If the price reverses, liquidations can accelerate the decline. But if the market absorbs selling and quickly reclaims the breakout level, short sellers can become trapped instead.
This is why I pay attention to funding rates, open interest, liquidation levels, and spot volume together.
Rising open interest is not automatically bullish. It can reflect aggressive positioning on either side.
Similarly, negative funding does not guarantee a short squeeze.
The question is whether the price move is supported by genuine spot demand or driven mainly by leveraged speculation.
I would also avoid using excessive leverage around major resistance and support. Even a correct long-term view can lose money if the entry, position size, or liquidation risk is poorly managed.
MY FINAL THOUGHT
Looking at this chart, I understand why some traders are warning about a possible final bull trap near $87K.
But the on-chain picture is more complicated than a simple bearish prediction.
Tracked exchange flows show net withdrawals, and long term holders continue to control a substantial share of Bitcoin's supply. At the same time, recent ETF outflows show that institutional demand needs to be monitored carefully.
That combination tells me the market is at a decision point, not that the next move is already guaranteed.
My approach would be simple:
✅ Watch $87K–$90K for a confirmed breakout.
✅ Monitor $80K–$82K for support and possible breakdown signals.
✅ Track ETF flows, exchange netflows, long-term holder spending, and liquidity conditions.
Treat $53K–$58K as a downside scenario, not a guaranteed destination.
Bitcoin could surprise the bears and continue higher. It could also trap late buyers before a deeper correction.
I want to see what the market confirms before taking a strong position.
Now I want to know your opinion:
Will BTC break above $90K and continue toward $100K+, or will the market create one final bull trap before a deeper correction?
Share your scenario below. 👇

#Bitcoin #BTC #CryptoAnalysis
#SecuritizeSharesRiseOver10%AfterTokenizedStocksLaunch #TradingStrategy