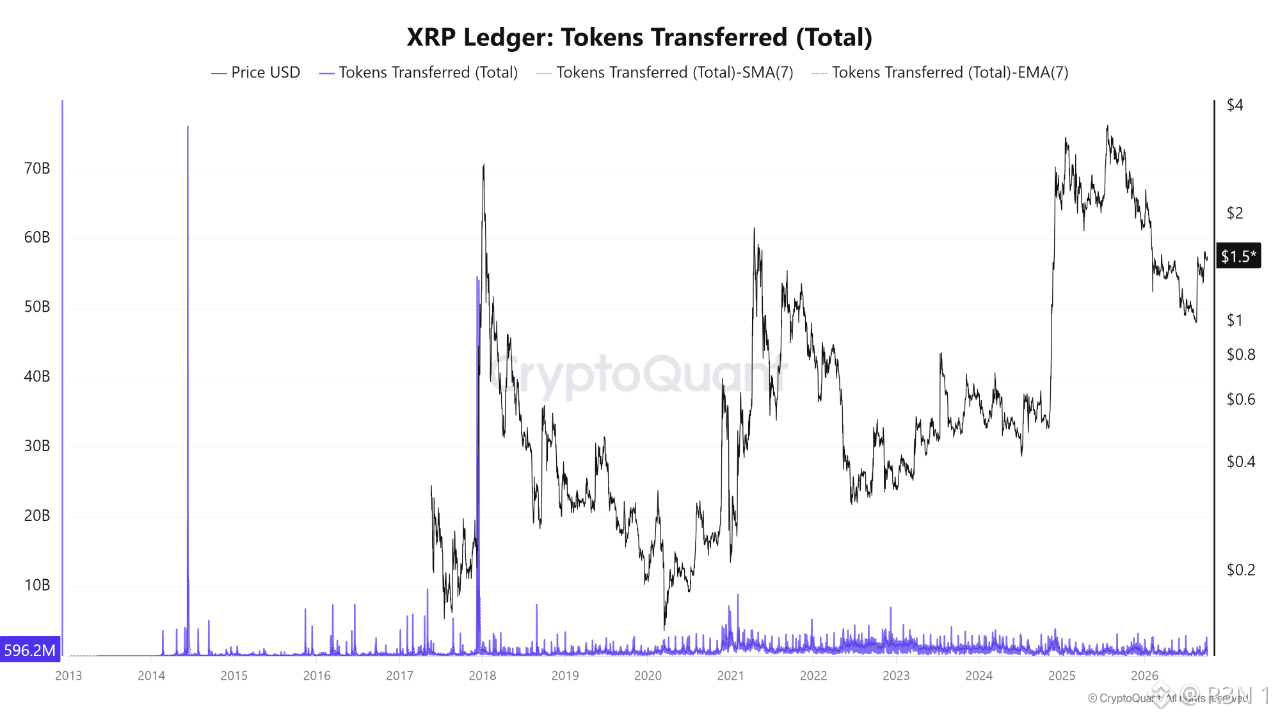
XRP's at $1.50, less than half its late-2025 high near $3.65, and the ledger's daily token transfer volume right now sits at just 596.2 million, a fraction of what it took to actually drive this price up there in the first place. Look at where the real baseline sits since late 2024. Once XRP broke out of the multi-year $0.20-0.60 range and pushed toward its highs, daily transferred volume on the smoothed average lines climbed meaningfully above the chronic low baseline that defined 2018 through most of 2024. That elevated transfer activity coincided with and arguably helped drive the breakout. Current daily volume at 596.2 million is sitting well below that elevated post-breakout baseline, closer to levels seen earlier in the move than at its peak. What stands out to me is what this chart's two genuine outlier spikes actually represent, and why they're the wrong comparison for right now. The two massive vertical spikes, mid-2014 and late-2017 into 2018, both coincided with extreme price volatility and look like one-off technical or network events rather than organic demand, they're outliers even by this chart's own standard, not a baseline to measure current activity against. The more useful read is the trend in the smoothed lines since 2024 specifically. Transfer volume has stepped up from the near-flat 2018-2023 period into a higher, noisier range alongside the price recovery, and it's holding there, elevated versus XRP's own multi-year history even with today's lower reading. The open question isn't whether network activity has genuinely increased versus XRP's dormant years, it clearly has. It's whether current transfer volume, running below the post-breakout baseline while price sits well under its highs, reflects a market cooling off after the move, or just normal day-to-day variance inside a baseline that's already structurally higher than it used to be. $XRP #BTC Price Analysis# #Altcoin Season#


نشر

--
إخلاء مسؤولية: يتضمن آراء جهات خارجية. لا تُعدّ نصيحة. يُمكن استخدام Binance AI دون أي ضمان. اطلع على الشروط والأحكام.