


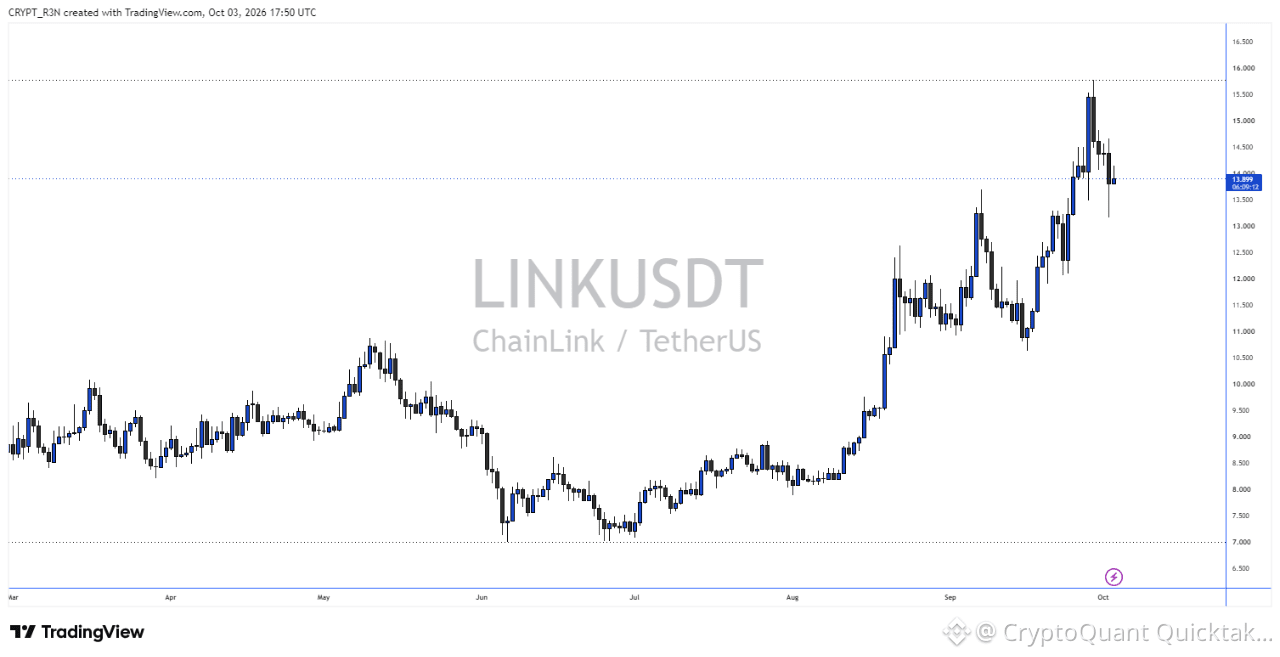
LINK broke out of a seven month $7 to $10 range starting in September, rallying to a peak above $15.50 before pulling back to its current $13.887. What makes this breakout different from several prior rallies on this same chart is what exchange reserves did, or rather, didn't do, while it happened.
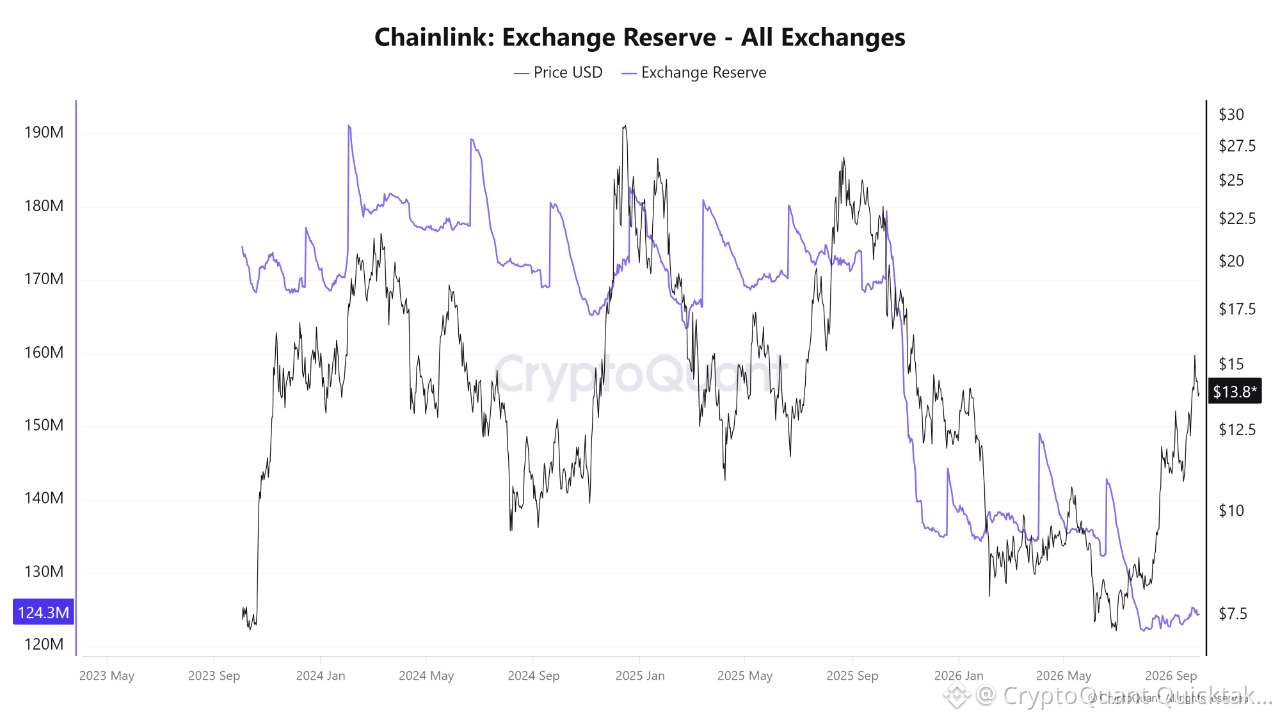
Looking at the reserve chart since late 2023, a clear sawtooth pattern repeats, reserves build gradually, then jump sharply in a single move, a pattern that's shown up at least six or seven times, early 2024, mid 2024, late 2024, early and mid 2025, and once more in early 2026. Several of those spikes land close to local price tops or precede price weakness, consistent with sudden reserve increases reflecting coins moving toward exchanges ahead of potential selling.
This latest rally breaks that pattern. Reserves have stayed essentially flat near 124 to 130M through the entire September to October move, no sharp spike accompanying this breakout the way one accompanied several prior rallies. Reserves currently sit at 124.3M, near the lowest point of the entire multi-year window shown, well below the 190M peak from early 2024.
What stands out too is the broader structural decline, reserves have fallen from that 190M peak to current levels through a mix of gradual declines and periodic spikes, a multi-year downtrend in available exchange supply persisting across multiple price cycles.
My honest read: a rally happening without the characteristic reserve spike that's marked several prior tops is a genuinely different setup, suggesting less fresh supply arriving at exchanges than in past comparable moves. Not proof the rally continues, but the absence of that historical warning sign is worth noting.
What I'm watching: whether a reserve spike eventually shows up as this rally continues or if LINK pushes back toward its recent highs, since that's been the pattern's typical trigger point historically.
Written by R3N