


The indicator in question is the Bitcoin Accumulation Trend. Traditionally, it is used to understand the behavior of different Bitcoin holder cohorts. It reveals who is buying and how many units are being accumulated or sold at a given time.
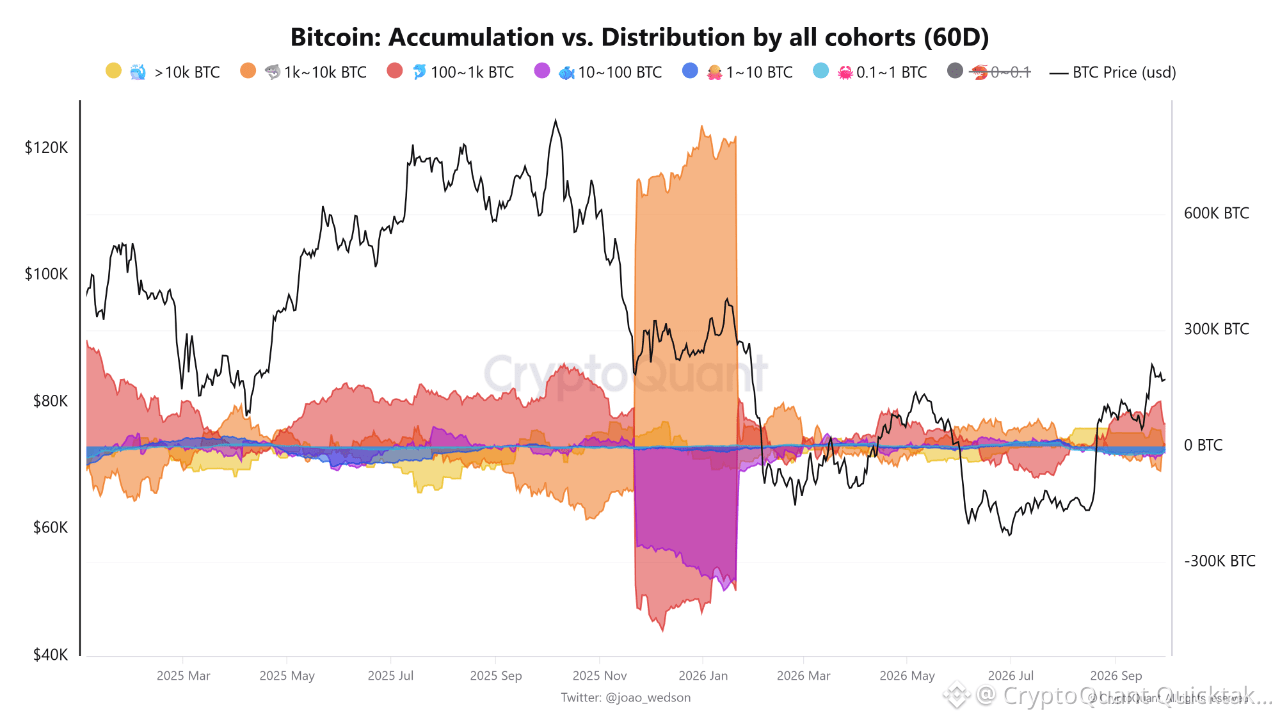
While tracking the figures, a new pattern emerges that has coincided with significant uptrends. A closer look at the chart shows several areas where the bands contracted.
Paying attention to these contractions reveals a recurring pattern: periods of significant thinning have preceded strong upward momentum. For example, the metric underwent notable contraction between April 17 and 20, 2025. During this period, Bitcoin began climbing from around $84,000 and eventually reached $109,000.
Another contraction occurred between March 5 and 8, followed shortly afterward by a notable uptrend.
The bands are contracting again on the BTC Accumulation Trend chart at the time of writing. If history is anything to go by, the apex coin may be gearing up for another significant uptrend this month.
Written by APTRekt