

ARK has been one of the strongest steady climbers on the board, grinding higher inside a clean ascending channel with a textbook Higher High / Higher Low structure. After a healthy pullback and bounce, price is once again pressing against its recent high — and the setup favors continuation as long as the channel holds.
Market Structure Overview
ARK/USDT (Perpetual Futures, Binance, 15M timeframe) has been in a persistent, well-organized uptrend:
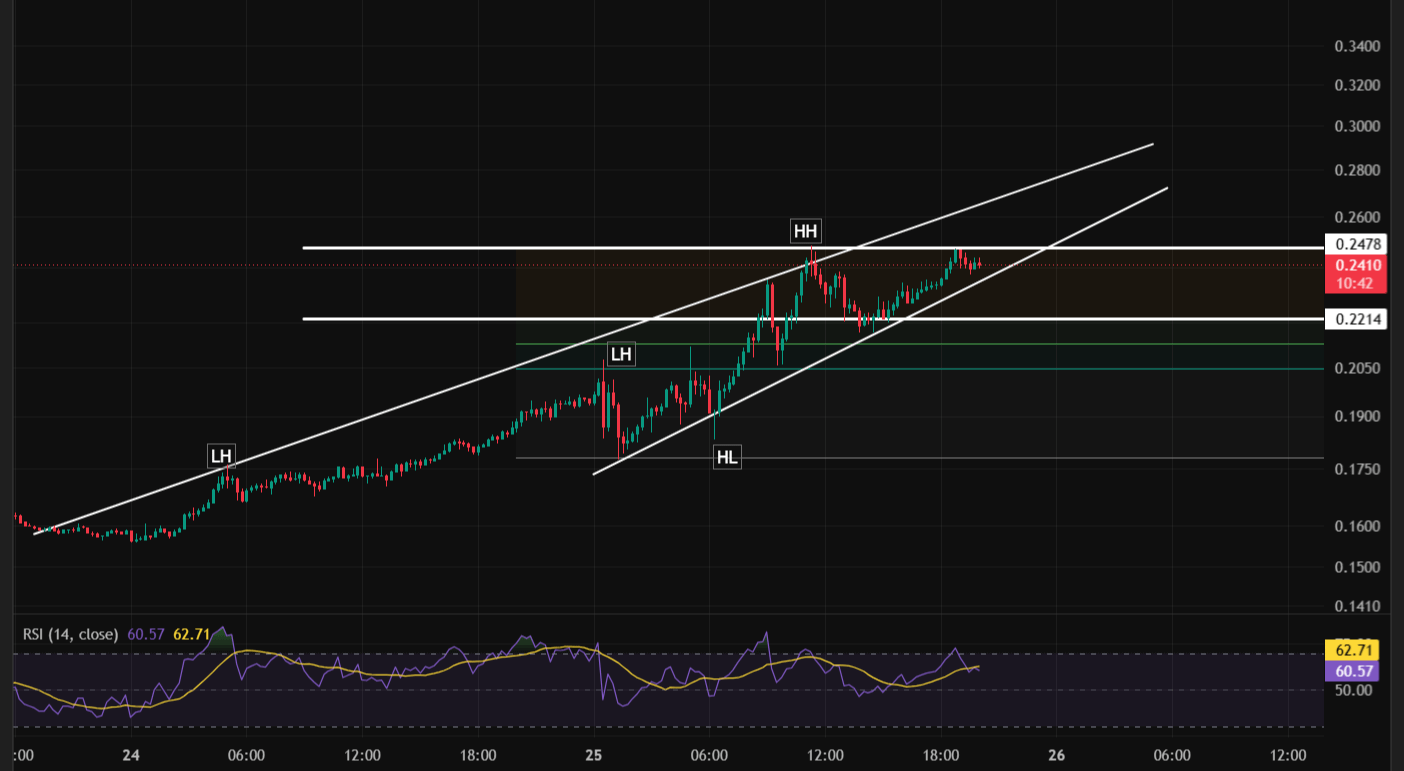
Price has advanced steadily from roughly $0.155, forming a sequence of Lower Highs turned Higher Highs as the trend matured — an early LH near $0.165, followed by another LH around $0.195, before the structure flipped decisively bullish.
A Higher Low (HL) formed near $0.175–$0.178, confirming buyers were stepping in earlier each time and building a rising floor.
From that HL, price rallied hard into a Higher High (HH) at $0.2478, before pulling back to retest the $0.2214 level — a former consolidation zone that flipped from resistance into support.
Since that retest, price has recovered strongly and is now trading at $0.2436, pressing back up toward the recent high.
The entire advance is contained within a clean ascending channel, with both boundaries sloping upward and projecting toward $0.28+ over the coming sessions if the structure holds.
This HH/HL sequence combined with a clean channel is one of the more reliable trend-continuation patterns — each pullback so far has been bought before the prior high, not below it.
The Key Zone to Watch
Two levels stand out on this chart:
$0.2478 — the current swing high (HH) and the immediate resistance to clear for continuation.
$0.2214 — the recently retested support zone, which held firm and triggered the current leg back toward the highs. This level, along with the rising channel's lower boundary, forms the key support to watch on any pullback.
A deeper support sits near $0.2050, which lines up with the base of the most recent consolidation range and marks a more conservative structural floor.
Momentum Check (RSI)
The RSI (14) is currently at 63.99, with its moving average at 62.96. This shows:
Momentum remains firmly bullish, comfortably above the 50 midline, without yet reaching overbought extremes (70+).
RSI has stayed elevated through the recent pullback and bounce, reflecting sustained buying pressure rather than a weakening trend.
There is still room for RSI to climb further before overbought conditions become a concern, supporting the case for continuation.
Trade Setup: Entry, Targets & Invalidation
Bias: Bullish continuation, favoring longs while price holds above the $0.2214–$0.2214 support shelf and the rising channel.
Entry Zone (preferred, retest-based):
$0.2200 – $0.2260, on a pullback into the support shelf and rising trendline confluence, ideally confirmed with a bullish rejection candle.
Alternative Entry (breakout-based, more aggressive):
A confirmed 15M/1H close above $0.2478 with rising volume, targeting a fresh leg higher inside the channel.
Stop-Loss / Invalidation:
Below $0.2050, beneath the deeper structural support and the base of the last consolidation range. A decisive close below this level would break the Higher-Low sequence and threaten the ascending channel.
Take-Profit Targets:
Target 1: $0.2478 — immediate resistance / current swing high.
Target 2: $0.2700 — next logical extension inside the channel.
Target 3 (extension): $0.2900 — aligns with the projected upper boundary of the ascending channel if momentum continues over the next 1–2 sessions.
Risk-to-Reward: Entering near $0.2230 with a stop at $0.2050 and a first target of $0.2478 offers roughly a 1:1.4 risk-to-reward to Target 1, improving to over 1:3.5 if price extends toward Target 3.
Key Levels Summary
Resistance: $0.2478 (HH) → $0.2700 → $0.2900 (channel extension)
Support: $0.2214 (retested support / channel line) → $0.2050 (structural invalidation)
Current Price: $0.2436
What Could Invalidate This Setup
A decisive close below $0.2050 would break the Higher-Low structure and the ascending channel, opening risk toward deeper support near $0.1900.
Repeated rejection at $0.2478 paired with fading RSI momentum could signal the trend is losing steam rather than preparing for another leg up.
Final Thoughts
ARK/USDT continues to respect one of the cleanest ascending channels on the board, with a textbook HH/HL sequence supporting the bullish case. As long as the $0.2214–$0.2260 zone holds on any dip, the path of least resistance remains upward toward a retest — and potential break — of the $0.2478 high. A confirmed close back below $0.2050, however, would be the clearest signal that the trend needs reassessment.
Disclaimer: This article is for informational and educational purposes only and does not constitute financial advice. Cryptocurrency trading, especially with leverage/perpetual futures, carries significant risk of loss. Always conduct your own research (DYOR) and consult a licensed financial advisor before making any trading decisions. It is what it is.
@Binance Square Official #QNTRises39% #EthereumBreaksAbove$2700 #BitgetBreachForgedRequestsNotStolenKeys #Binance #ChartSniper