
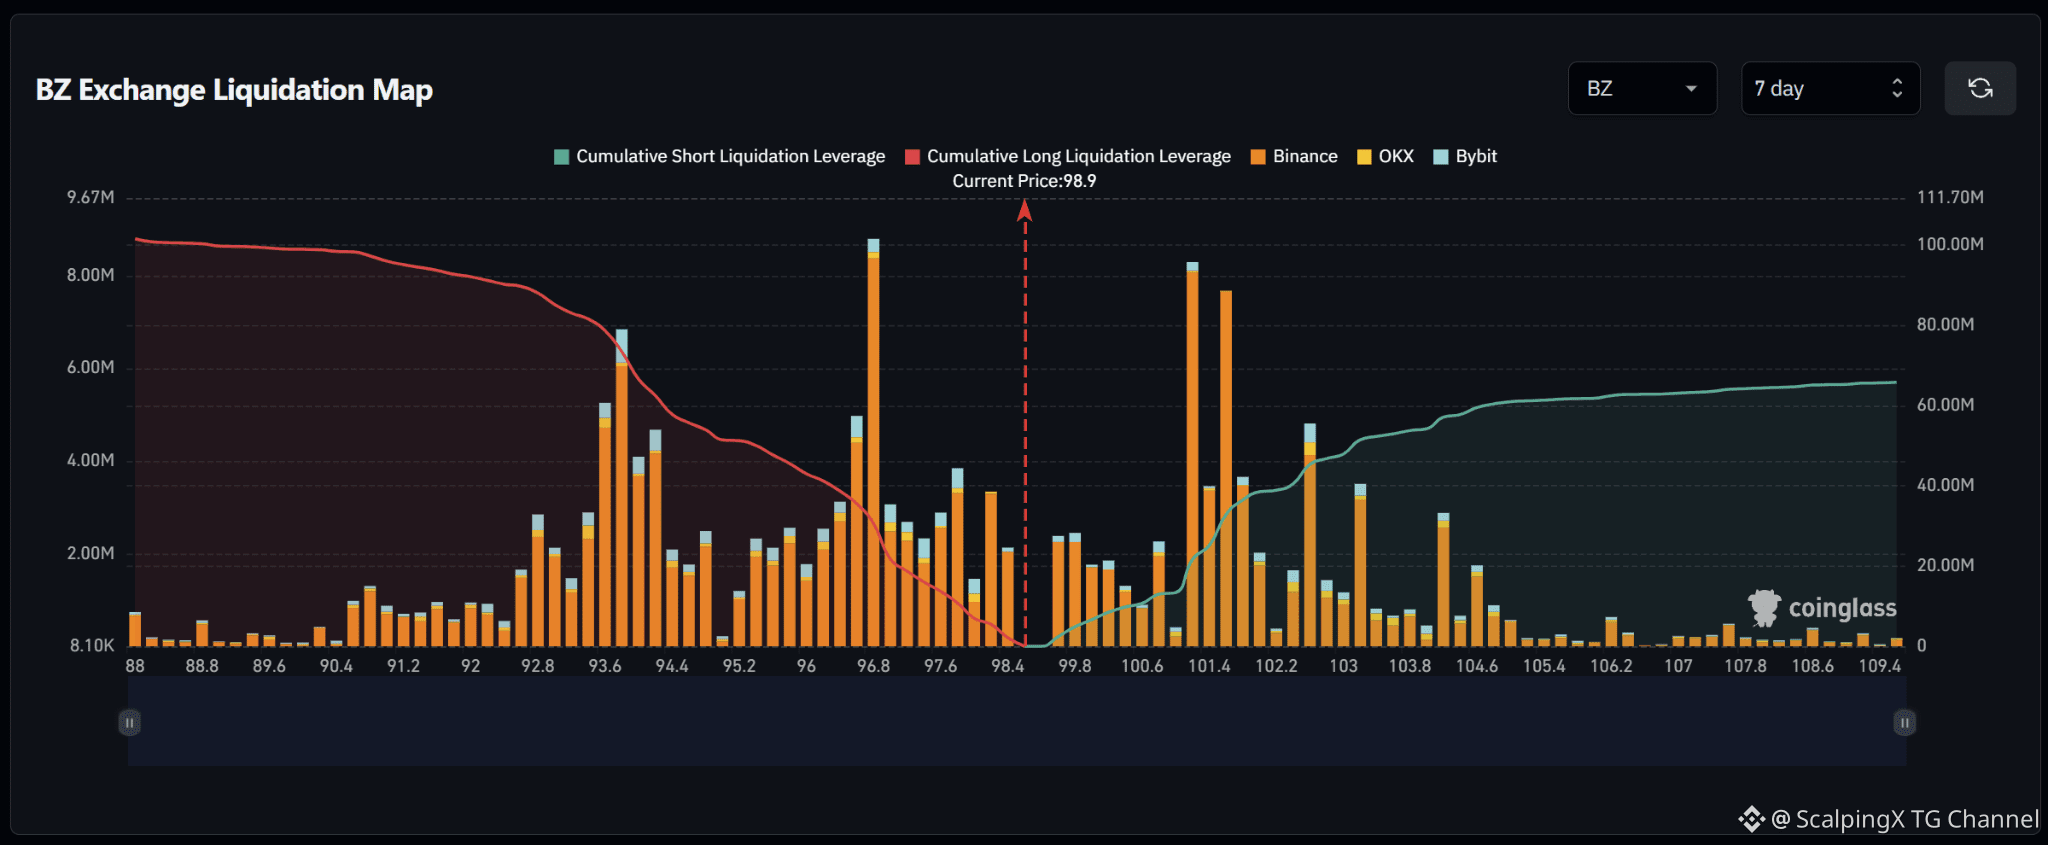
$BZ – Liquidation Map (7 Days) – Current Price 98.9 🔎 The 7-day liquidation map shows roughly 100 million USD in long liquidations below the current price, significantly exceeding approximately 65 million USD in short liquidations above. The liquidity structure therefore favors the downside, with around 1.5 times more cumulative liquidity below the market. 📉 Below the market, long-liquidation liquidity is concentrated heavily across 93.5–97.8. The strongest cluster sits around 96.7–96.9 with a bar close to 9 million USD; 93.5–94.2 also contains several bars around 4–7 million USD, while 97.5–97.8 holds another cluster near 4 million USD. Losing 98.4 would shift attention toward 97.8–96.7 and then 94.2–93.5. 📈 Above the market, short-liquidation liquidity is concentrated mainly across 101–103. The two strongest clusters sit around 101.2 and 101.6 with bars near 8 million USD, while 102.6–103.2 contains several pockets around 3–5 million USD. Further out, 104.2–104.6 still holds some notable liquidity. 🧭 The broader setup favors the downside because long-liquidation exposure below is larger. Losing 98.4 would increase the probability of a sweep toward 97.8–96.7, followed by 94.2–93.5. Breaking above 100.6 would instead expose 101.2–101.6 and then 102.6–103.2.


نشر
إخلاء مسؤولية: يتضمن آراء جهات خارجية. لا تُعدّ نصيحة. يُمكن استخدام Binance AI دون أي ضمان. اطلع على الشروط والأحكام.