

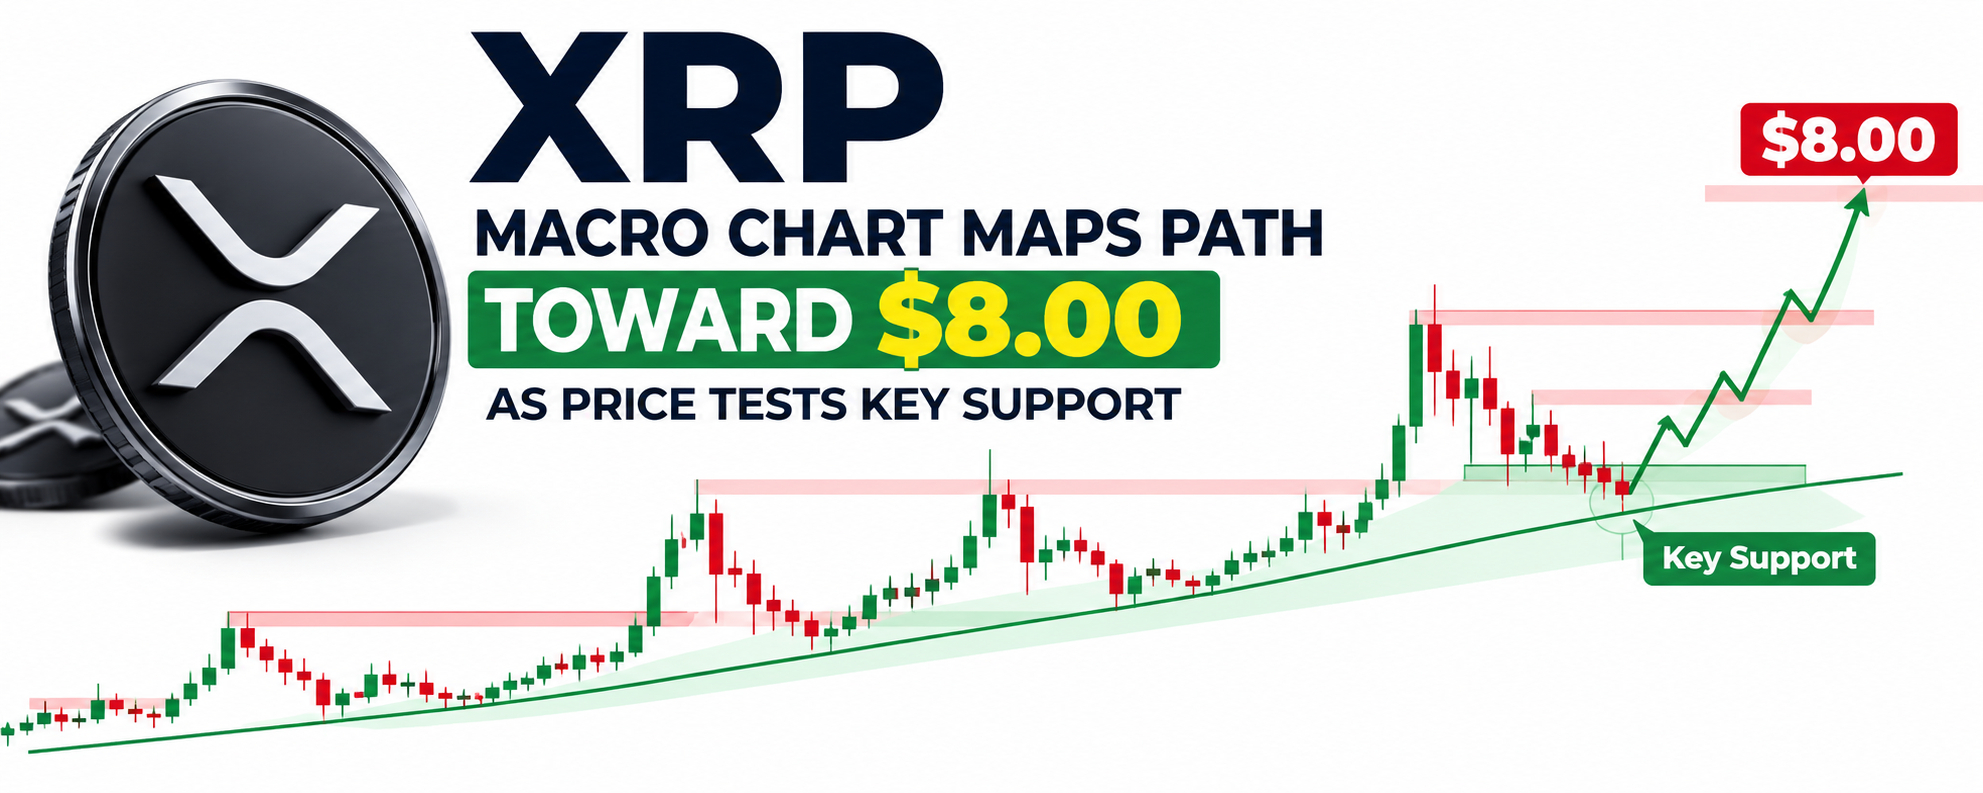


XRP is entering another important phase of its market structure.
After a sharp period of volatility, price is now trading around the $1.50 area, with the market attempting to establish whether this zone can become a durable base or merely a temporary pause before another leg of volatility.
The interesting part is that the XRP chart is no longer simply about short-term price action.
The larger question is whether XRP can transition from a recovery asset into a broader institutional and liquidity-driven trade.
That distinction matters because an $8 XRP price would require much more than a technical breakout.
It would require a combination of stronger crypto liquidity, sustained institutional demand, continued XRP Ledger development, expanding real-world activity and a market willing to assign XRP a substantially larger valuation.
The chart can map the potential path.
The fundamentals and macro environment determine whether that path can actually be traveled.
The Current XRP Setup
Recent market data places XRP near $1.53–$1.56, while the recent daily range shows a major increase in volatility.
On September 21, XRP gained roughly 8.9%, moving from around $1.41 to above $1.57 before consolidating. The following sessions produced a mixture of gains and declines, with September 23 seeing a roughly 4.5% decline before XRP recovered toward the $1.50 area.
That sequence is important.
It shows that buyers have been willing to defend the lower-$1.40 area, but it also shows that sellers remain active around the upper part of the current range.
The immediate technical battle is therefore concentrated between support around $1.45–$1.50 and resistance around $1.55–$1.65.
A clean break of the upper boundary would change the technical conversation.
A sustained loss of support would do the opposite.
The First Level That Matters: $1.45–$1.50
The $1.45–$1.50 region has become an important short-term decision zone.
CoinMarketCap's current technical analysis identifies approximately $1.45–$1.48 as near-term support, while $1.56 is highlighted as an important resistance area. A break below $1.45 could expose approximately $1.35.
This creates a relatively clear framework.
If XRP repeatedly holds this region and buyers continue stepping in during pullbacks, the market can continue building a higher-timeframe base.
If price loses it decisively, the market could revisit lower support before attempting another recovery.
The distinction between a temporary intraday wick and a confirmed structural breakdown is critical.
Crypto markets frequently move below obvious support levels, trigger liquidations and then reclaim those same levels.
Therefore, the reaction after a support test may be more informative than the initial breakdown itself.
The Bigger Defensive Zone: $1.25
Below the immediate $1.45–$1.50 area sits a much more significant structural zone around $1.25.
One current daily framework places $1.25 as the more important defensive line, with approximately $0.99 representing the lower boundary of the three-month range.
This creates two different technical situations.
Above $1.25, XRP can still be viewed within a broad recovery/consolidation structure.
A sustained move below $1.25 would weaken that structure substantially and potentially expose the lower end of the broader range.
That makes $1.25 an important level for anyone analyzing the macro chart rather than simply watching intraday candles.
What the Indicators Are Saying
Current daily technical readings provide a mixed but constructive picture.
CoinLore currently shows XRP trading above its 10-, 20-, 30-, 50-, 100- and 200-day simple moving averages. Its listed daily EMAs are also below the current price, while the daily RSI is around 63.
That combination suggests that the broader daily structure has not been destroyed by the recent volatility.
But RSI around the low 60s also tells us something important:
XRP is not sitting in an extreme oversold condition waiting for an automatic rebound.
The market already recovered significantly from recent lows.
Consequently, the next phase needs confirmation through price structure and volume rather than simply relying on the argument that XRP has fallen enough.
The Breakout Zone
The $1.55–$1.65 region is where the chart becomes particularly interesting.
A move through $1.55 would put XRP back above a nearby resistance level identified by current technical analysis.
But $1.65 is arguably more important because it corresponds with the upper boundary of the recent three-month range identified in current market analysis.
A decisive move above $1.65 would therefore represent something more meaningful than a normal intraday bounce.
It would suggest that XRP is attempting to leave the current consolidation range.
From there, the next psychological and technical zones would need to be established progressively rather than assuming an immediate move to $8.
A possible long-term sequence could look like:
$1.50 → $1.65 → $2.00 → $3.00 → $4.00 → $5.00 → $6.00 → $8.00
These are scenario levels, not guaranteed targets.
The market would have to establish acceptance at each major region.
Why $2 Is More Important Than It Looks
The $2 level is likely to become an important psychological checkpoint if XRP successfully escapes its current range.
The reason is simple.
A move from approximately $1.50 to $2 would represent a gain of roughly one-third.
At the same time, reclaiming $2 would move XRP back toward a valuation level that the market has previously been willing to assign to the asset.
The important question would then become whether $2 acts as resistance or becomes support.
A failed breakout around $2 could produce another consolidation.
A successful reclaim followed by sustained trading above it could create the foundation for another expansion.
That is how a potential $8 path would need to develop: through multiple successful structural transitions rather than one uninterrupted vertical rally.
The $3–$4 Zone
Above $2, the $3–$4 region becomes increasingly important from a historical perspective.
XRP has previously traded significantly higher than its current price, but its historical all-time high remains below $4, according to recent market reporting.
That means a move toward $4 would not simply be another percentage rally.
It would represent a major attempt to establish a new valuation regime.
At these levels, market capitalization becomes increasingly important.
With approximately 62.7 billion XRP circulating, recent analysis estimates that a $10 XRP price would correspond to roughly $627 billion in market capitalization.
An $8 price using that same approximate circulating-supply figure would imply roughly:
$8 × 62.7 billion XRP ≈ $501.6 billion market capitalization
That is a massive valuation.
Therefore, an $8 scenario cannot reasonably be explained by chart patterns alone.
The market would need to absorb a valuation of roughly half a trillion dollars at the cited circulating supply.
What Could Drive That Repricing?
This is where the XRP story becomes more interesting than the chart itself.
XRP is connected to the XRP Ledger, Ripple's payment infrastructure and a growing ecosystem involving stablecoins, tokenized assets and institutional financial applications.
Recent reporting on XRPL showed a notable change in network activity.
During Q2, order-book trading volume reportedly increased approximately 79% year over year even though the number of accounts initiating trades fell around 41%. At the same time, average tokenized-asset and RLUSD balances reportedly climbed to approximately $4.26 billion.
That creates a more nuanced picture.
Network participation was not uniformly increasing across every metric.
But the value moving through certain parts of the ecosystem was becoming significantly larger.
For investors watching XRP, this distinction matters.
More users do not automatically mean more token value.
Likewise, larger transaction values do not automatically translate into higher XRP prices.
The key question is whether increasing ecosystem activity eventually creates persistent demand for XRP itself.
Institutional Demand Is Another Major Variable
Institutional access is becoming another important part of the XRP market structure.
CoinDesk reported that U.S. spot XRP exchange-traded funds experienced 11 consecutive sessions of net inflows, bringing approximately $170 million during that streak and approximately $1.68 billion since their November launch. The same report noted institutional holders including Goldman Sachs, Jane Street and Millennium in regulatory filings.
This does not guarantee higher XRP prices.
ETF flows can change.
Institutions can hedge.
Investors can reduce exposure.
And market-wide risk appetite can overwhelm asset-specific developments.
But structurally, spot investment products can make it easier for traditional investors to obtain XRP exposure without directly interacting with crypto exchanges or self-custody infrastructure.
That expands the potential investor base.
The next question is whether those flows remain persistent through both rising and falling markets.
The Macro Variable Cannot Be Ignored
XRP does not trade in isolation.
Liquidity conditions, Bitcoin's trend, interest-rate expectations, dollar strength, institutional risk appetite and overall crypto market capitalization can all influence the amount of capital available for altcoins.
A strong XRP-specific story can therefore struggle during a broad crypto deleveraging event.
Conversely, a favorable macro environment can amplify XRP-specific catalysts.
This is why the $8 thesis should be viewed as a macro-plus-fundamental scenario rather than simply a technical prediction.
If global liquidity expands and risk appetite returns to higher-beta crypto assets, XRP could receive an additional tailwind.
If liquidity tightens and investors move toward defensive assets, even strong XRP fundamentals may not prevent significant drawdowns.
What an $8 XRP Scenario Would Actually Require
For XRP to reach $8, several conditions would likely need to align.
1. XRP must reclaim major technical levels
The market would first need to recover and hold levels such as $1.65, followed by progressively higher resistance zones.
2. The $2 region would need to become support
A sustainable move above $2 would provide evidence that the market is accepting a higher valuation.
3. XRP would need to break through its previous major price structure
A move toward and beyond the $3–$4 region would require significant buying pressure.
4. Institutional demand would need to remain meaningful
ETF flows are potentially important because they provide an accessible route for institutional and traditional-market exposure.
5. XRPL activity would need to continue developing
Growth in tokenized assets, stablecoin activity, payments and institutional infrastructure could strengthen the broader ecosystem.
But the crucial distinction remains:
XRPL growth is not automatically equivalent to XRP price growth.
The economic connection between network activity and XRP demand needs to remain visible.
6. The broader crypto market would likely need to cooperate
A $500 billion-scale XRP valuation would be easier to sustain within a much larger and liquid digital-asset market than during a broad crypto contraction.
The Bull-Case Structure
The constructive scenario begins with XRP continuing to defend the $1.45–$1.50 region.
From there, buyers would need to reclaim $1.55 and eventually break the $1.65 resistance area.
A confirmed breakout could shift the chart from consolidation into expansion.
The next major psychological checkpoints would then be $2, $3 and eventually the previous major highs around the $3–$4 region.
If XRP were able to establish a new high above its historical range, the market could begin pricing a completely different valuation framework.
That is where the path toward $5, $6 and potentially $8 becomes technically conceivable.
But each level would need confirmation.
The market does not owe XRP a straight-line move.
The Bear Case Cannot Be Ignored
The biggest mistake would be to focus only on the $8 scenario.
If XRP loses $1.45 and fails to reclaim it, the market could revisit approximately $1.35.
If the deeper $1.25 support zone also breaks, the broader structure would deteriorate significantly.
A move toward the lower end of the broader range around $0.99 would then become technically relevant.
This is why support levels matter.
They are not simply numbers on a chart.
They tell us where the market's previous balance between buyers and sellers changed.
The Most Important Question: Is This Accumulation or Distribution?
That is ultimately what the XRP chart needs to answer.
If price repeatedly tests support but refuses to break lower, while volume expands during advances and institutional flows remain positive, the market could be demonstrating absorption.
If price repeatedly fails at resistance while selling volume increases and support levels disappear one by one, the interpretation changes.
The next several structural breaks will therefore be more important than any single prediction.
XRP's Supply Structure Also Matters
Unlike proof-of-work assets with ongoing mining issuance, XRP has a fixed maximum supply of 100 billion tokens.
However, the distinction between maximum supply and circulating supply is important when calculating valuation.
Recent market analysis uses approximately 62.7 billion XRP in circulation for its valuation calculations.
That means the headline $8 price target must always be viewed alongside supply.
At approximately 62.7 billion circulating XRP:
$1 = ~$62.7B market cap
$2 = ~$125.4B
$3 = ~$188.1B
$4 = ~$250.8B
$5 = ~$313.5B
$6 = ~$376.2B
$8 = ~$501.6B
These calculations illustrate why $8 is a substantial macro-market scenario rather than an ordinary technical target.
Future changes in circulating supply would also affect the exact market-cap calculation.
The Real XRP Thesis
The strongest version of the XRP thesis is not simply:
“XRP can go to $8.”
The more useful thesis is:
Can XRP evolve into an asset whose valuation is supported by institutional access, increasing financial infrastructure on XRPL, persistent market liquidity and sustained demand for the token itself?
That is the question the market is currently trying to answer.
The chart provides the framework.
The fundamentals provide the potential catalysts.
Macro liquidity provides the fuel.
And market participants ultimately decide whether the valuation is justified.
Final Outlook
XRP is currently sitting at a technically important point.
The immediate structure is centered around the $1.45–$1.50 support region, while $1.55–$1.65 represents the important upside resistance band.
Above $1.65, the chart could begin transitioning into a larger expansion structure.
Below $1.45, the market would need to defend lower levels.
Below $1.25, the broader recovery structure would become substantially weaker.
The path toward $8 therefore should not be viewed as one prediction.
It is a chain of conditions:
Hold support → reclaim resistance → establish $2 → break the previous major range → sustain institutional demand → expand XRPL activity → maintain favorable macro liquidity → build a much larger XRP valuation.
Only if those conditions progressively align does the $8 scenario become increasingly relevant.
For now, the most important thing is not the final number.
It is what XRP does at the levels immediately in front of it.
The market is testing support.
The next major move will tell us whether this is simply another consolidation phase—or the beginning of a much larger repricing cycle.
This is market analysis, not financial advice. Price targets such as $8 are scenario-based and highly speculative, not guarantees. Crypto assets can experience extreme volatility and substantial losses.