


Holder, derivatives, and ETF data all point the same direction. Here's what the daily red candle is hiding.
🚀 Open a 24-hour chart of XRP right now and you'd think something went wrong.
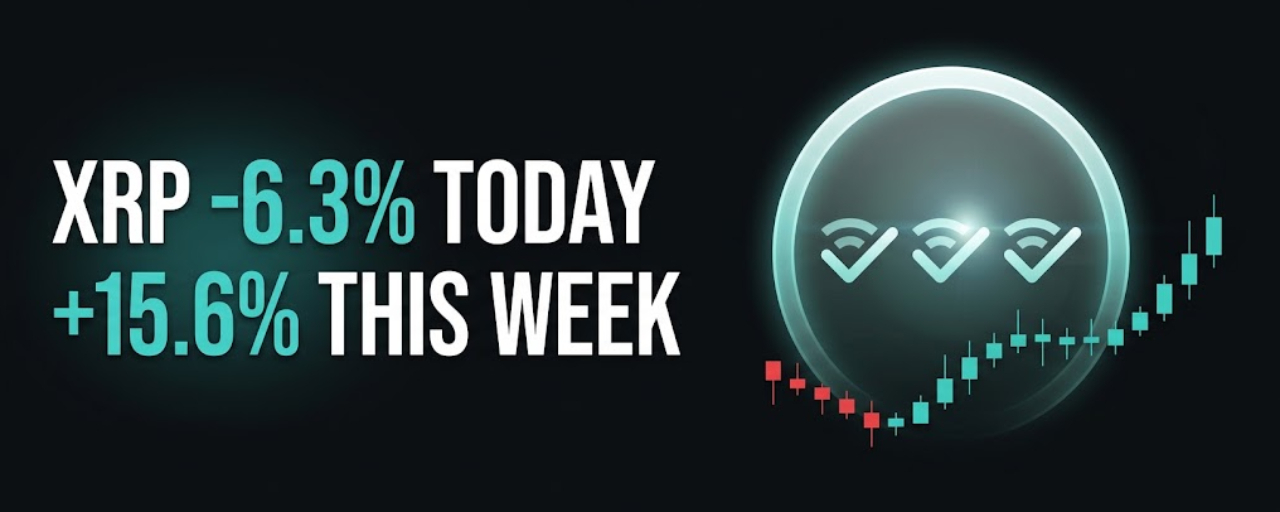
XRP fell about 6.3% over the past day, trading near $1.50. On its own, that's the kind of red candle that gets people nervous. But zoom out to the weekly view and the story flips entirely, XRP is still up more than 15.6% over the past seven days. The daily drop isn't the trend; it's a pullback inside a stronger move.
🕵️ Here's why that distinction actually matters.
A single bad day inside a strong week is one of the most common (and most misread) patterns in crypto. Traders who only check the 24-hour number see red and assume the run is over. Traders who check the week see a token still holding most of its recent gains, and start asking a different question, is this a healthy cooldown, or the start of something worse?
🔐 So what's actually supporting XRP beneath the daily noise?
The bullish case here isn't built on one data point, it's built on three separate categories lining up: holder behavior, derivatives positioning, and ETF flows. Large XRP holders have historically tended to accumulate during pullbacks like this rather than sell into them, a pattern that shows up repeatedly in on-chain data when the weekly trend stays positive. Derivatives markets, futures and options activity, tend to reflect real conviction rather than just spot speculation, since traders there are putting capital behind a directional view, not just reacting to headlines. And ETF flow data has become one of the clearest institutional signals available for XRP specifically, sustained inflows tend to mean real capital is entering, not just short-term momentum chasing.
🧠 Why does this three-part framework matter more than the price alone?
Because price alone doesn't tell you who's driving the move. A 6.3% daily drop on thin, retail-driven selling looks very different from the same drop with holders accumulating, derivatives staying constructive, and ETF inflows continuing underneath it. The former is often just noise. The latter tends to mean the pullback is being absorbed by stronger hands, not signaling a trend reversal.
📅 There's also a seasonal wrinkle worth knowing.
CryptoRank data shows XRP has actually closed October lower in eight of the past 13 years. That's not a reason to panic, seasonality is a soft pattern, not a rule, but it's a useful piece of context heading into next month. If XRP holds its current strength through a historically weaker month, that itself would be a meaningful signal.
✅ What this means for you
If you're holding XRP, don't let a single red day override what the weekly and structural data are showing. Check whether the three signals, holder accumulation, derivatives positioning, and ETF flows, are still pointing the same direction before reacting to one day's price action.
If you're on the sidelines, remember that a 6.3% daily pullback inside a 15.6% weekly gain isn't automatically a buying opportunity or a warning sign on its own. Watch whether the underlying signals hold up over the next several sessions, that tells you more than the daily candle does.
If you're building a habit of reading crypto data well, this is a clean example of why timeframe matters as much as direction. The same price move can look completely different depending on whether you're looking at 24 hours or 7 days, and the more durable signals usually live in the slower-moving data.
🟢 Bullish scenario
Holder accumulation continues, derivatives positioning stays constructive, and ETF inflows keep coming in, confirming this was a healthy pullback inside a longer uptrend, one that holds up even through XRP's historically weaker October.
🔴 Risk scenario
The daily weakness extends, holders start distributing instead of accumulating, and ETF flows slow or reverse, turning what looked like a pullback into the start of a real reversal, right as XRP enters a seasonally difficult month.
👀 Three things to watch
1️⃣ Holder behavior over the next week
Do large wallets keep accumulating through this dip, or does distribution start showing up in the data?
2️⃣ ETF flow direction
Do inflows continue at a healthy pace, or does the pace slow as October approaches?
3️⃣ Whether XRP breaks its October pattern
Does XRP hold its weekly strength into next month, or does it follow the historical trend of closing October lower?
💡 The key takeaway
A 6.3% daily drop looks alarming in isolation. A 15.6% weekly gain, backed by holder accumulation, constructive derivatives data, and continued ETF inflows, tells a very different story.
The real question isn't whether XRP had a red day, it clearly did. It's whether the three underlying signals keep holding up through a month that's historically been unkind to the token.
That is the part worth watching.
This post is for informational and educational purposes only and is not financial advice. Crypto markets are volatile. Always conduct your own research before making financial decisions.
#BinanceSquare #XRP #Crypto #Altcoins #ETF
