📈 RSI: WHAT DOES IT REALLY TELL US?
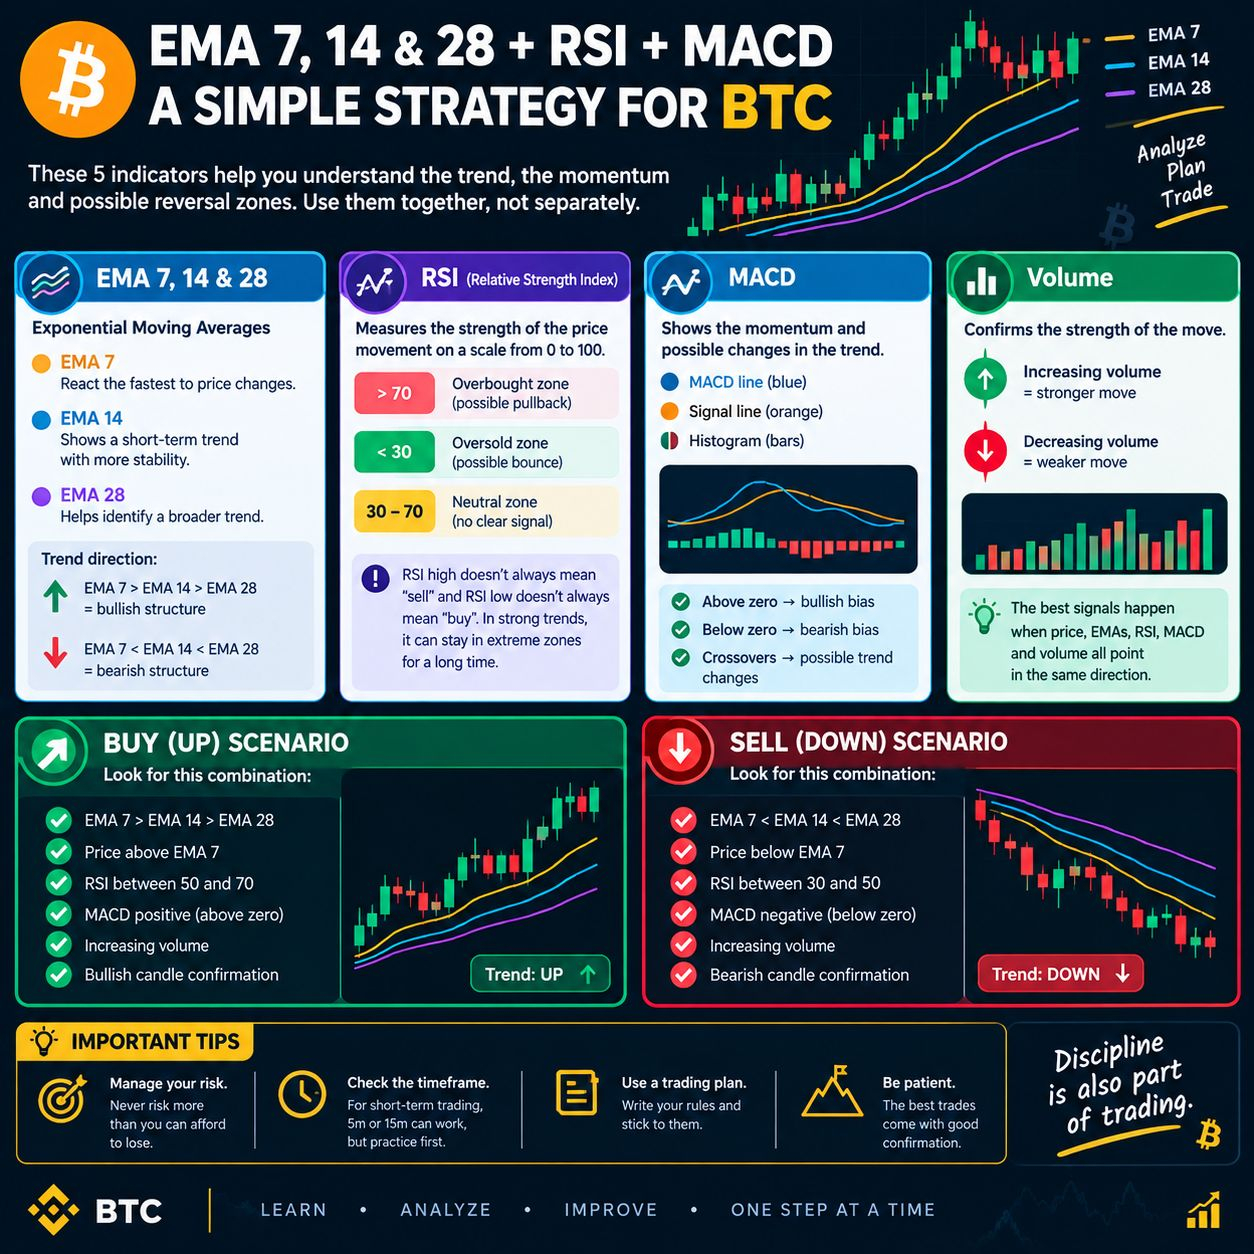
The Relative Strength Index (RSI) measures price momentum on a scale from 0 to 100.
🔴 Above 70 → potentially overbought
🟢 Below 30 → potentially oversold
🟡 30–70 → neutral range
But there is an important point:
⚠️ RSI above 70 does NOT automatically mean “SELL”.
⚠️ RSI below 30 does NOT automatically mean “BUY”.
During strong trends, RSI can remain overbought or oversold for a long time.
That is why I prefer to combine RSI with trend direction, EMAs, MACD and volume.
Do you use RSI when analyzing BTC? 👇
#US30YearYieldHighestSince2004 $GOOGL.US #BitcoinForecast #RSIHeatmap #TradingTopics #BinanceWillListHyperliquid(HYPE)
The Relative Strength Index (RSI) measures price momentum on a scale from 0 to 100.
🔴 Above 70 → potentially overbought
🟢 Below 30 → potentially oversold
🟡 30–70 → neutral range
But there is an important point:
⚠️ RSI above 70 does NOT automatically mean “SELL”.
⚠️ RSI below 30 does NOT automatically mean “BUY”.
During strong trends, RSI can remain overbought or oversold for a long time.
That is why I prefer to combine RSI with trend direction, EMAs, MACD and volume.
Do you use RSI when analyzing BTC? 👇
#US30YearYieldHighestSince2004 $GOOGL.US #BitcoinForecast #RSIHeatmap #TradingTopics #BinanceWillListHyperliquid(HYPE)