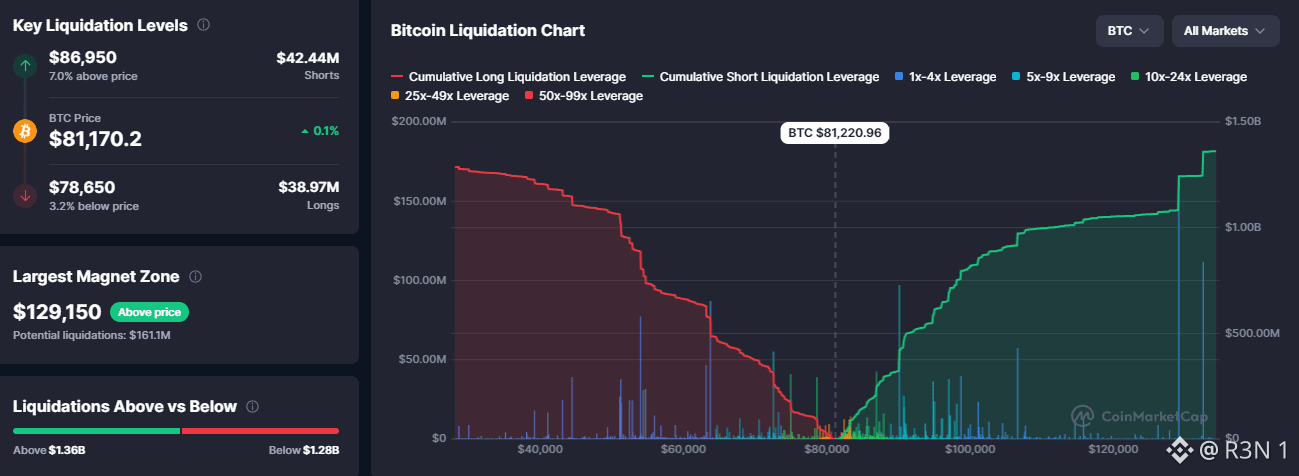
$1.36 billion in potential liquidations sitting above current price, $1.28 billion below. That's a genuinely balanced liquidation map, not the kind of lopsided setup that usually points toward an obvious squeeze in one direction. $BTC sits at $81,170.20, barely moving, up just 0.1%. The nearest real levels on either side are close by percentage terms but similar in size, $86,950 is 7% above price with $42.44M in short liquidations clustered there, while $78,650 sits 3.2% below with $38.97M in longs exposed. Those two numbers being close despite the asymmetric distance is worth noting, leverage looks fairly evenly distributed on both sides near current price, not concentrated heavily on one side waiting to get run. The more interesting level on this chart is further out. $129,150 is flagged as the largest magnet zone, with $161.1M in potential liquidations stacked there, well above current price and well beyond either of the nearer levels. That's a real concentration of leveraged longs sitting far overhead, the kind of zone that tends to act as a magnet during strong trending moves, though getting there from $81,000 is a substantial move, not a near term target. My honest read: with liquidations roughly balanced above and below at current price, this map doesn't argue strongly for a squeeze in either direction right now. The picture only gets genuinely interesting if price starts trending hard enough to actually approach either the $86,950 or $78,650 clusters, or eventually that much larger $129,150 zone further out. What I'm watching: whether price pushes toward $86,950 and tests that short cluster, or breaks down toward $78,650 instead, since either move would start clarifying which side of this balanced map actually gets triggered first. #BTC Price Analysis# #Macro Insights# #Meme Alpha#

نشر

--
إخلاء مسؤولية: يتضمن آراء جهات خارجية. لا تُعدّ نصيحة. يُمكن استخدام Binance AI دون أي ضمان. اطلع على الشروط والأحكام.