


Bitcoin’s latest price cooldown is not being accompanied by a comparable deterioration in underlying network activity.
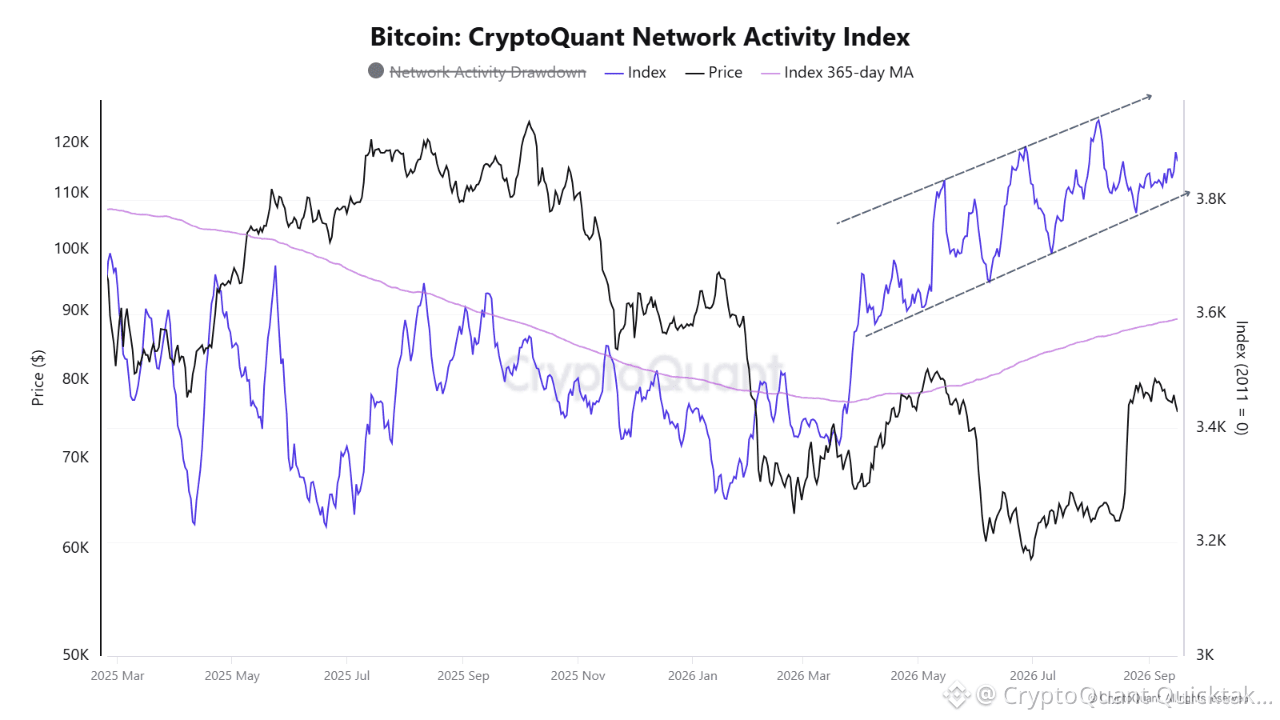
The CryptoQuant Network Activity Index has been developing a clear sequence of higher highs and higher lows since the March–April area. The index is now trading around 3.8K, comfortably above its 365-day moving average near 3.6K, while that long-term average itself has started to turn higher.
BTC has lost momentum following its latest upside leg, yet network activity has remained elevated and continues to operate inside an ascending structure. In other words, the correction in price has so far looked more like a cooldown in market valuation than a contraction in Bitcoin’s underlying on-chain activity.
The divergence is particularly interesting because network activity began strengthening months before the most recent price recovery. Since roughly April, the index has moved from the 3.4K–3.5K region toward 3.8K+, while its 365-day MA has transitioned from declining to rising. That suggests the improvement is becoming more structural rather than simply reflecting a short-lived spike in activity.
From a market-regime perspective, this is constructive. Price is consolidating, but the network is not showing the same loss of momentum. If activity continues producing higher lows while remaining above its long-term trend, it would indicate that Bitcoin’s underlying usage and settlement activity are still expanding beneath the correction.
The important distinction, however, is that strong network activity does not automatically imply an immediate price reversal. It provides confirmation of underlying resilience, not a timing signal.
Written by MorenoDV_