


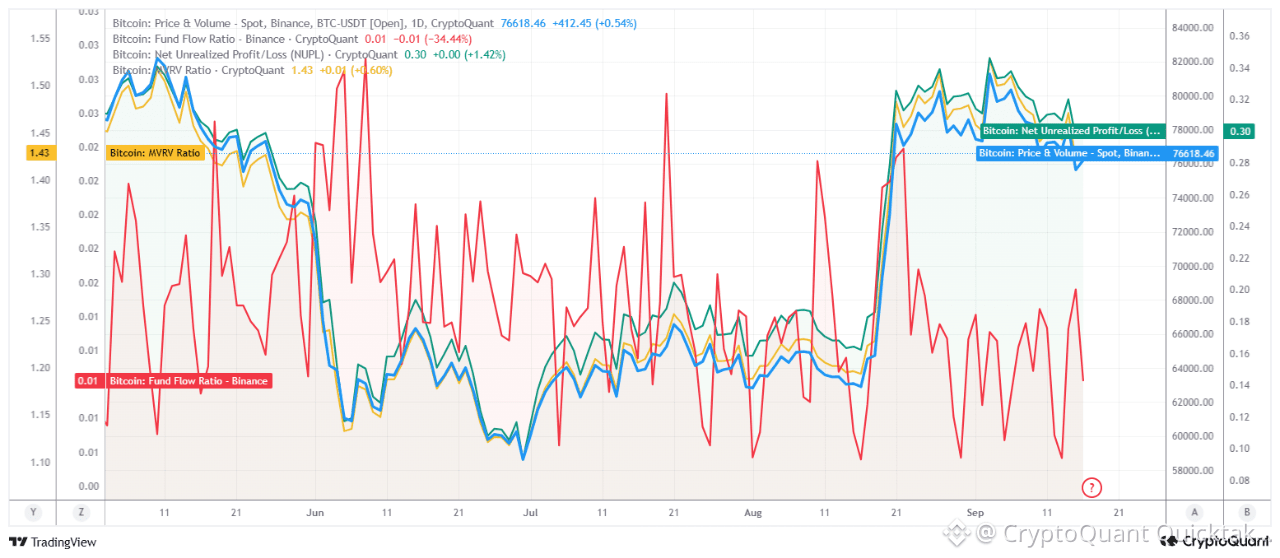
BTC’s price is around $76,618. Following the sharp rise in mid August from the $64,000 range to the $80,000-$82,000 area, it pulled back and moved sideways in the $76,000-$79,000 range.
Fund Flow Ratio is 0.01, with an approximately 34% daily decline. This indicates that a smaller portion of on-chain BTC transfers is associated with inflows and outflows from Binance; exchange driven trading appetite and immediate liquidity are low. This metric is more about activity context than direction.
NUPL 0.30 Hhis shows that the market is overall in unrealized profit, but not in an extreme euphoria zone. There is a risk of profit taking, but at the level shown on the chart, there is no classic peak-panic signal.
MVRV 1.43 means that the market value is approximately 43% above the average investor’s cost basis. This also points to a profitable market structure; historically, it is not an extreme level that would be considered overvaluation on its own. However, this profitability can lead to panic selling. After reading all this data, we can draw some conclusions in terms of price impact.
First of all, although the decline in Binance inflows and outflows may seem positive, the fact that exchange reserves have reached historical highs as I mentioned in my previous analyses is an important signal. Inflows and outflows to the exchange are low, but the amount of BTC on the exchange is so high that this leads to selling within the exchange.
Especially considering that the market’s unrealized profit ratio is high, we can say that these sales can happen easily.
Nearly half of investors are above their average BTC cost basis, which means that the 43% of BTC investors on Binance will not hesitate to sell at all.
In addition, considering the Fed’s interest rate hiking policy, it is not surprising that investors are selling. I still think the price is expensive for manyinvestors to buy. So, it would not be surprising to see the market decline for a while longer.
Written by PelinayPA