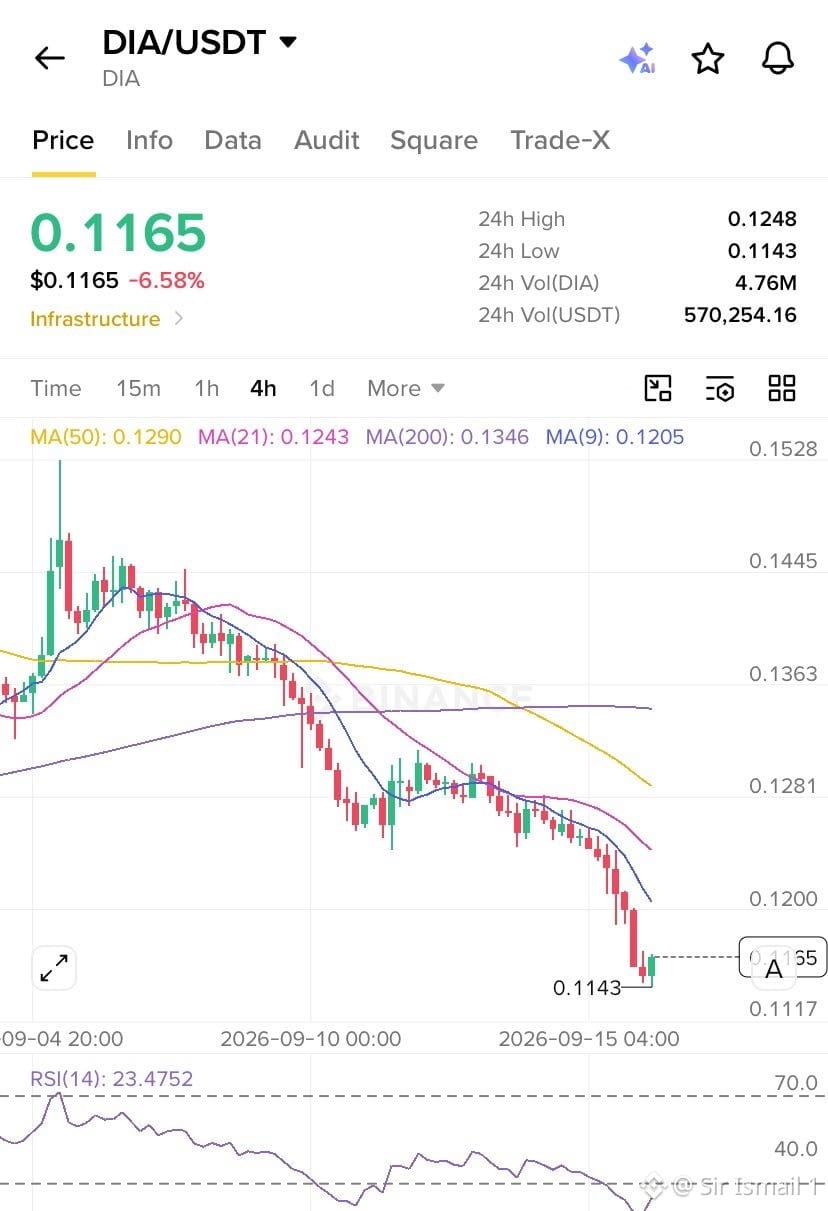
One thing I’m watching on the $DIA chart
After the recent pullback, I’m less interested in chasing candles and more interested in market structure.
For me, the key question is:
Can DIA establish a higher low and reclaim the previous resistance zone?
If buyers step in around support and price starts making:
Higher low → higher high → resistance reclaim
…that would give the chart a much healthier structure.
Until then, I’m treating the current move as a period of price discovery and consolidation, not assuming the next move.
And while the chart develops, the fundamental side is still worth tracking:
DIA currently supports 20,000+ assets, 65+ blockchains and 250+ dApps, with feeds covering digital assets, RWAs and fundamental asset data.
Chart + adoption guys!
That’s what I’m watching.
Stay bullish
After the recent pullback, I’m less interested in chasing candles and more interested in market structure.
For me, the key question is:
Can DIA establish a higher low and reclaim the previous resistance zone?
If buyers step in around support and price starts making:
Higher low → higher high → resistance reclaim
…that would give the chart a much healthier structure.
Until then, I’m treating the current move as a period of price discovery and consolidation, not assuming the next move.
And while the chart develops, the fundamental side is still worth tracking:
DIA currently supports 20,000+ assets, 65+ blockchains and 250+ dApps, with feeds covering digital assets, RWAs and fundamental asset data.
Chart + adoption guys!
That’s what I’m watching.
Stay bullish