
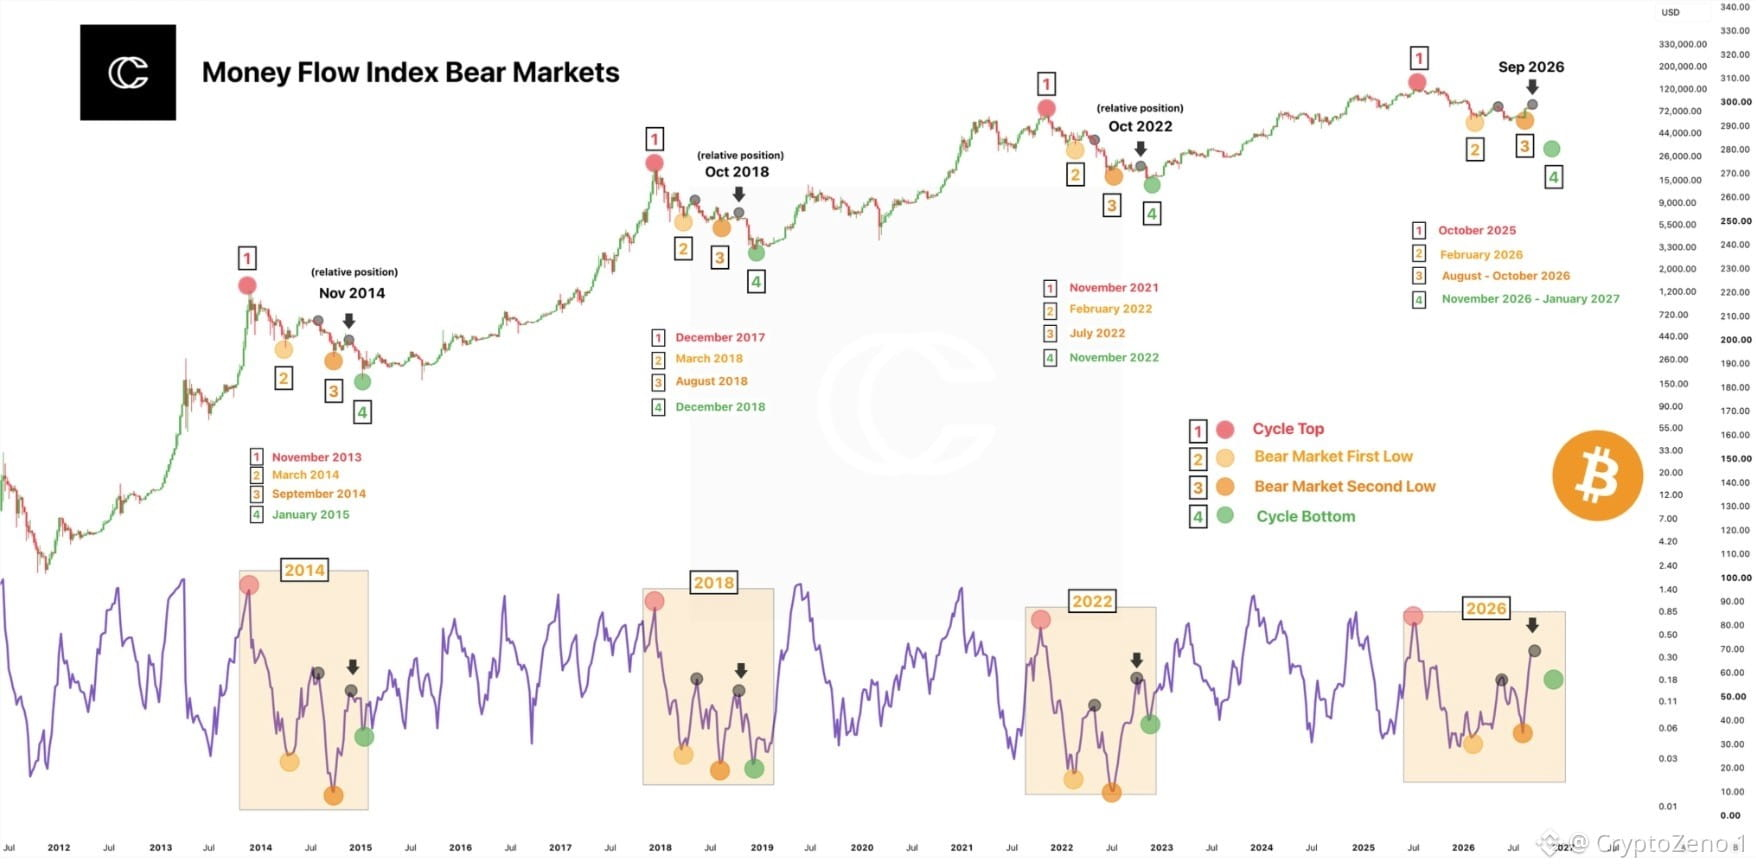
💥 $BTC Money Flow Cycle Is Flashing A Dangerous Historical Pattern The Money Flow Index is showing a striking repetition across previous Bitcoin bear market structures. In 2014, 2018 and 2022, the indicator followed a similar sequence: a cycle top, a first major liquidity flush, a second low, then a final cycle bottom. Each phase developed while BTC was moving through increasingly weak capital flows rather than simply following price alone. The current structure is now entering the most critical part of that historical sequence. The October 2025 peak is marked as the cycle top, followed by the February 2026 first low. The chart then places August to October 2026 around the second low zone, suggesting that the current weakness may be part of a broader distribution and capital withdrawal phase rather than an isolated correction. What makes this setup interesting is the behavior of the MFI itself. After the 2025 peak, the indicator collapsed sharply and has remained compressed near the lower portion of its historical range. Previous cycles show that the second low often develops after a rebound fails to restore strong money flow, creating another wave of selling pressure before the indicator eventually reaches its deepest cycle exhaustion. If this historical rhythm continues, the chart projects the potential cycle bottom between November 2026 and January 2027. This is not a guaranteed BTC bottom, but the repeated MFI structure makes this window one of the most important areas to monitor. A sustained recovery in money flow could invalidate the bearish sequence, while another sharp MFI breakdown would strengthen the case for a final capitulation phase. #BTC Price Analysis# #Macro Insights# #Meme Alpha#

نشر
إخلاء مسؤولية: يتضمن آراء جهات خارجية. لا تُعدّ نصيحة. يُمكن استخدام Binance AI دون أي ضمان. اطلع على الشروط والأحكام.