🚀 $HEMI Analysis: Pullback or Next Breakout?
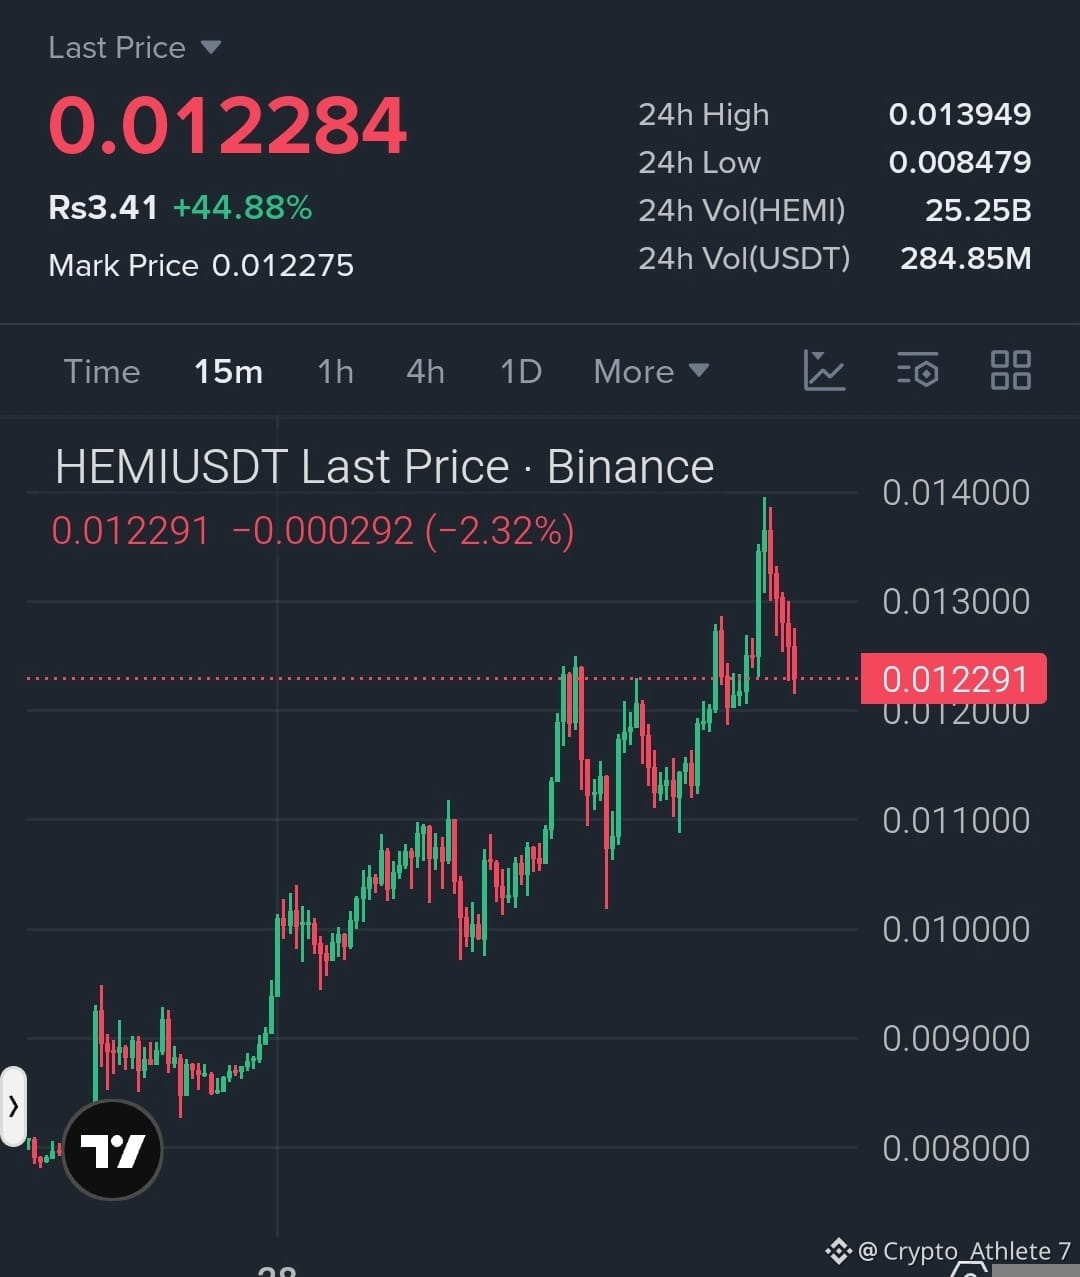
HEMI has been showing a strong bullish move, climbing from around $0.008 toward the $0.014 area. However, after touching the $0.0139 high, sellers stepped in and pushed the price back toward $0.0122.
📌 Key levels to watch:
🟢 Support: $0.0120 — holding this area could keep the bullish structure alive.
🟢 Next support: $0.0110
🔴 Resistance: $0.0130
🔴 Major resistance: $0.0140
If HEMI holds $0.0120 and buyers return, another attempt toward $0.0130–$0.0140 could be possible. A clear break above $0.0140 would show stronger momentum.
For now, the trend remains bullish, but the chart is showing a short-term pullback.
What do you think — will $HEMI reclaim $0.0140? 👀
$HEMI #CryptoAnalysis #tradingtips #cryptotrading
HEMI has been showing a strong bullish move, climbing from around $0.008 toward the $0.014 area. However, after touching the $0.0139 high, sellers stepped in and pushed the price back toward $0.0122.
📌 Key levels to watch:
🟢 Support: $0.0120 — holding this area could keep the bullish structure alive.
🟢 Next support: $0.0110
🔴 Resistance: $0.0130
🔴 Major resistance: $0.0140
If HEMI holds $0.0120 and buyers return, another attempt toward $0.0130–$0.0140 could be possible. A clear break above $0.0140 would show stronger momentum.
For now, the trend remains bullish, but the chart is showing a short-term pullback.
What do you think — will $HEMI reclaim $0.0140? 👀
$HEMI #CryptoAnalysis #tradingtips #cryptotrading