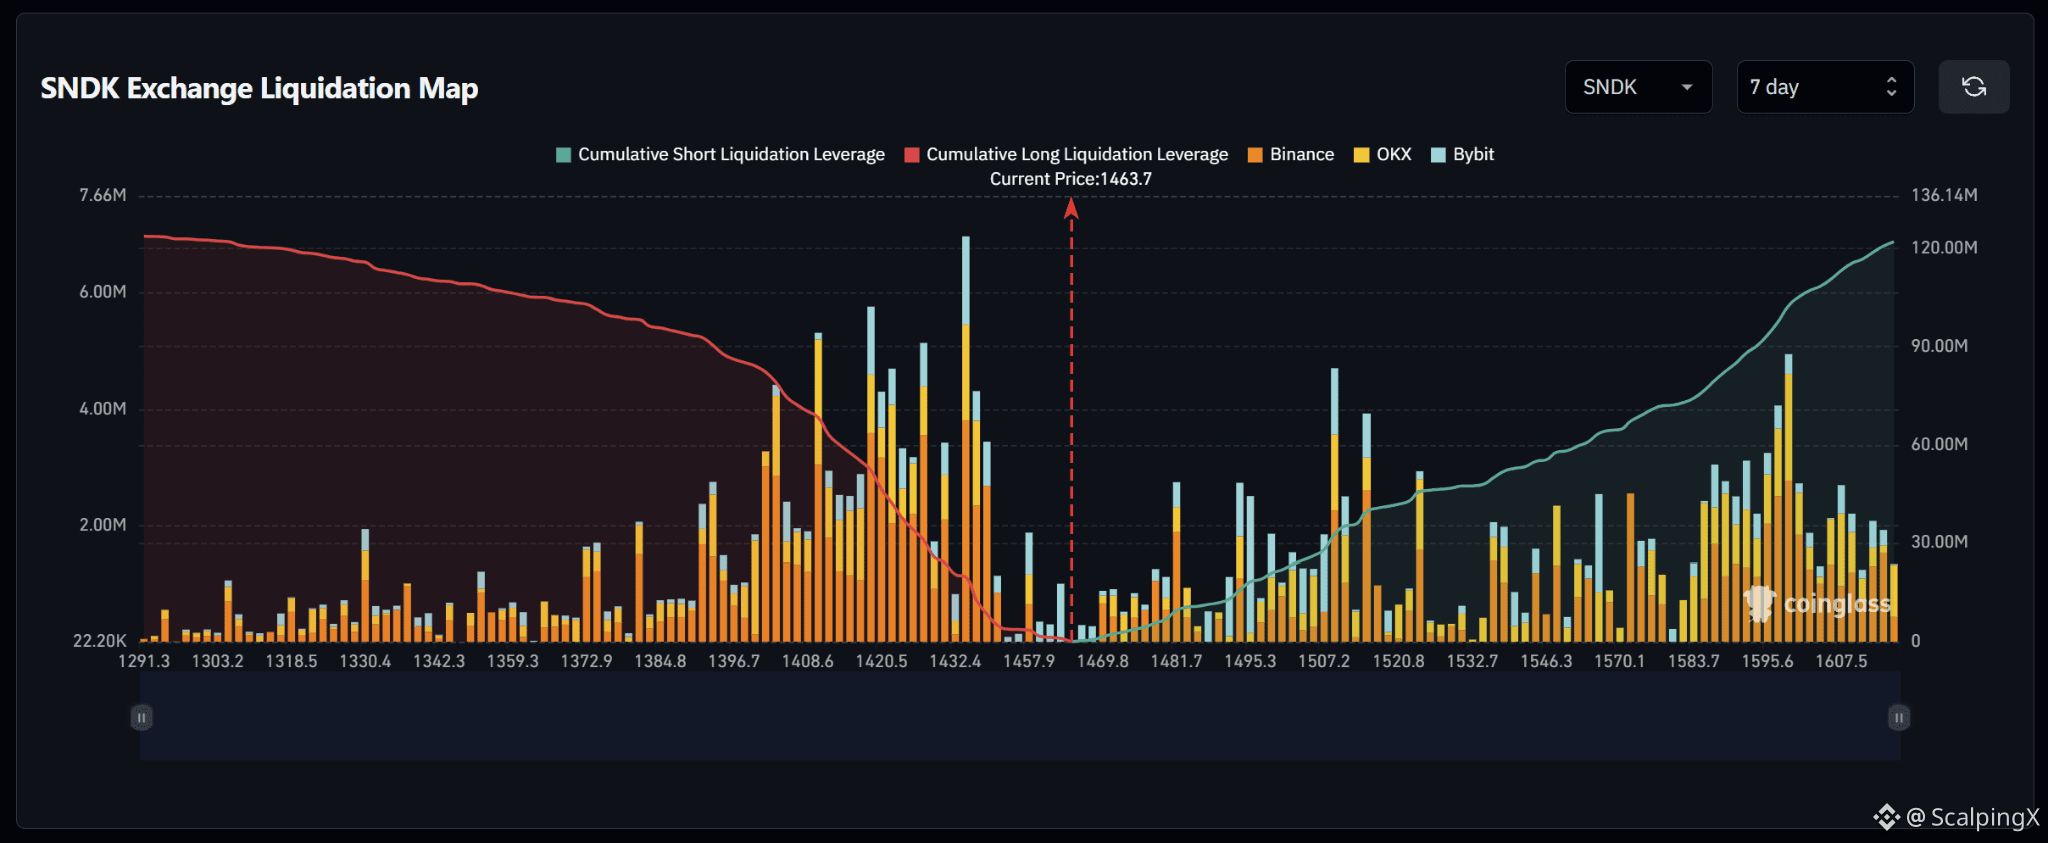
$SNDK – Liquidation Map (7 Days) – Current Price 1,463.7
🔎 The 7-day liquidation map shows a relatively balanced liquidity structure, with both long liquidations below and short liquidations above sitting around $120 million. The overall gap is small, so near-term direction may depend more on which nearby liquidity cluster is triggered first.
📉 Below the market, nearby long-liquidation liquidity is concentrated around 1,457.9–1,432.4, with 1,432.4 standing out as a major cluster. Further down, 1,420.5–1,408.6 also contains substantial liquidity. Losing 1,457.9 would increase the probability of a sweep toward 1,445–1,432.4.
📈 Above the market, short-liquidation liquidity begins building around 1,469.8 and becomes denser across 1,481.7–1,507.2. Additional major clusters appear around 1,507.2–1,520.8, while 1,583.7–1,595.6 forms one of the strongest concentrations further out. A break above 1,469.8 would bring 1,481.7–1,495.3 into focus first.
🧭 The broader setup is currently fairly balanced. Breaking 1,469.8 would increase the probability of a short-liquidation sweep toward 1,481.7–1,495.3, while losing 1,457.9 would shift attention toward 1,445–1,432.4.
#LiquidationMap
🔎 The 7-day liquidation map shows a relatively balanced liquidity structure, with both long liquidations below and short liquidations above sitting around $120 million. The overall gap is small, so near-term direction may depend more on which nearby liquidity cluster is triggered first.
📉 Below the market, nearby long-liquidation liquidity is concentrated around 1,457.9–1,432.4, with 1,432.4 standing out as a major cluster. Further down, 1,420.5–1,408.6 also contains substantial liquidity. Losing 1,457.9 would increase the probability of a sweep toward 1,445–1,432.4.
📈 Above the market, short-liquidation liquidity begins building around 1,469.8 and becomes denser across 1,481.7–1,507.2. Additional major clusters appear around 1,507.2–1,520.8, while 1,583.7–1,595.6 forms one of the strongest concentrations further out. A break above 1,469.8 would bring 1,481.7–1,495.3 into focus first.
🧭 The broader setup is currently fairly balanced. Breaking 1,469.8 would increase the probability of a short-liquidation sweep toward 1,481.7–1,495.3, while losing 1,457.9 would shift attention toward 1,445–1,432.4.
#LiquidationMap