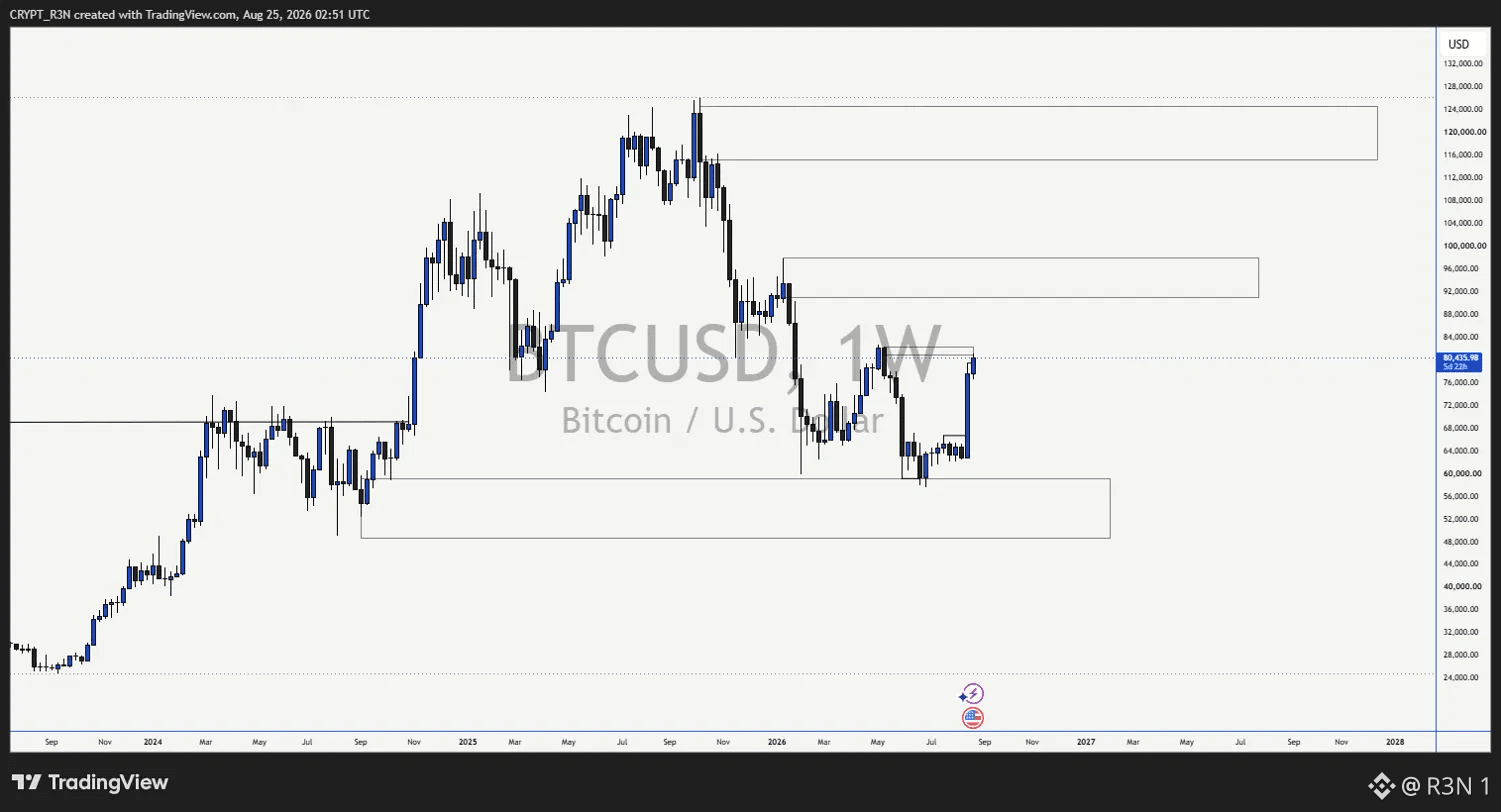
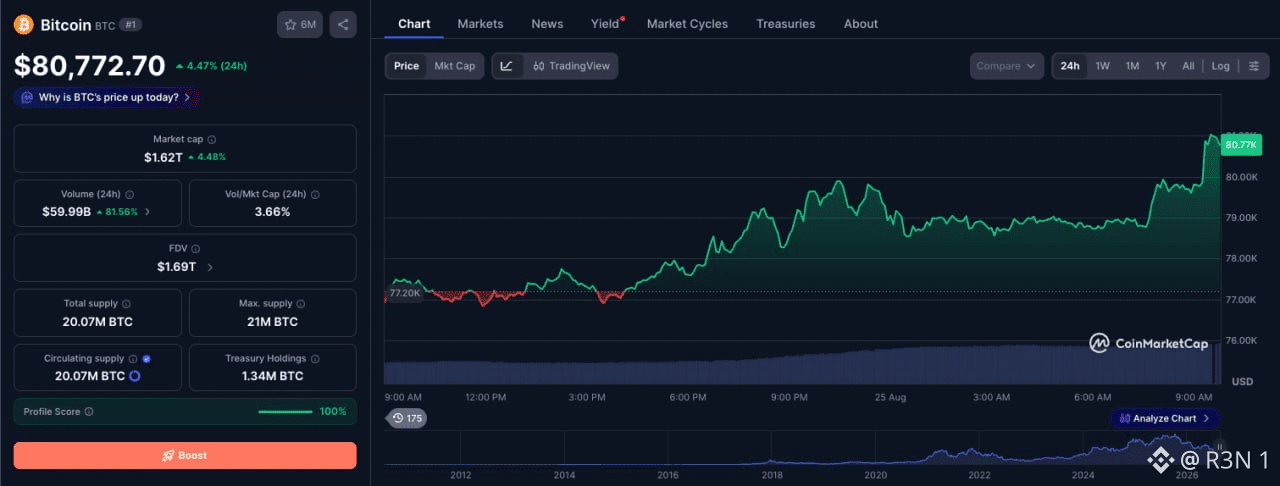
Bitcoin's back above $80K for the first time in three months, and the weekly chart shows exactly what it took to get there. Zoom out and this is the third distinct leg of a bigger structure. Price ran from lows near $16K through 2023 into a peak just above $124K last year, then spent this year working through a drawdown that bottomed in the low $60Ks, a real correction, not a shallow pullback. From that base, price has now pushed back through $80K, clearing a supply zone that had capped every prior bounce attempt since the top. What matters more than the round number is the level it just cleared. There's a shelf sitting right around $76-80K that price tested and rejected from multiple times on the way down and the way back up, visible as the tightest resistance box on the chart. Breaking through that on this move is the first real structural signal that the correction phase might be transitioning into a new leg higher, rather than just another bounce inside the same range. Above current price, the next real test isn't far off. There's a wider supply zone around $92-96K, the area price broke down through on its way to the yearly low, and above that, the $116-124K zone marking the prior all time high region. Both of those are going to matter a lot more than $80K does going forward, since $80K was a level that's already been tested and lost by sellers multiple times this year, while those higher zones haven't been challenged since the top. So the honest read: reclaiming $80K is real progress and clears a level that mattered, but it's still well below the highs, and the more meaningful confirmation of trend change sits at those untested zones above, not at the psychological round number everyone's celebrating right now. $BTC #Meme Alpha# #Bitcoin Price Prediction: What is Bitcoins next move?#

نشر

--
إخلاء مسؤولية: يتضمن آراء جهات خارجية. لا تُعدّ نصيحة. يُمكن استخدام Binance AI دون أي ضمان. اطلع على الشروط والأحكام.