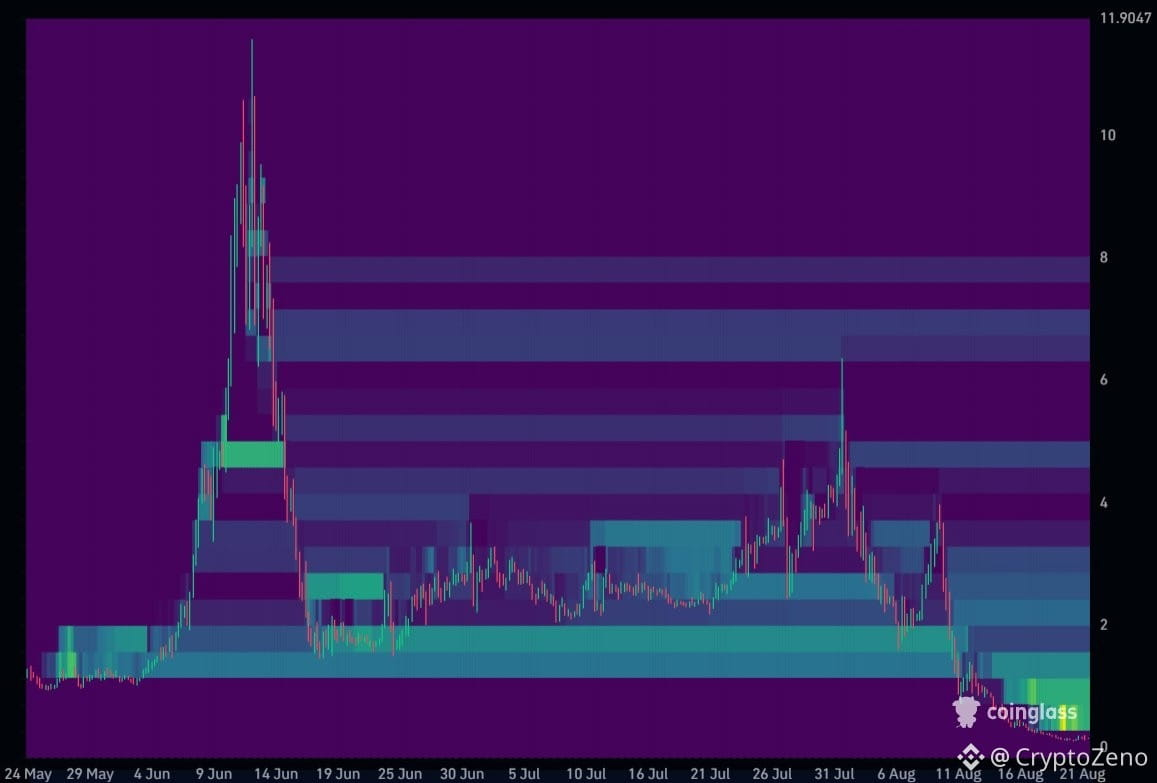
$BEAT من 11 إلى 0.1649، ويجب قراءة قفزة اليوم بنسبة 36% في هذا السياق.
البنية هنا متناقضة، تستحق المرور على كل جزء.
العقود الآجلة/السعر الفوري عند 31.5x، واحدة من أكثر النِّسب تطرفًا التي رأيناها. حجم التداول الفوري هو 26.08 مليون دولار، والآجلة 821.39 مليون دولار. السعر هنا عبارة عن قصة رافعة مالية تقريبًا بالكامل؛ الفوري بالكاد يشارك.
الحشد طويل بقوة، لكن المتلقّين (الذين يشترون/يُدخلون السيولة) يبيعون. L/S عند 2.61، ونسبة حساب أفضل متداول عند 2.82؛ كلاهما يميل إلى الصعود من حيث عدد الحسابات. لكن نسبة مركز أفضل المتداول هي 1.35 فقط، ما يعني أن حجم ما يحملونه محافظ أكثر بكثير. شراء/بيع المتلقّي هو 0.79، والجانب الأكثر عدوانية يبيع صافيًا. لذا بينما يرتفع السعر 36%، فإن من يضرب السوق في الواقع يبيع داخله. المشترون جالسون بشكل سلبي، والبائعون هم من يسحبون الزناد.
تمت تصفية 2.81 مليون دولار خلال 24 ساعة، وهو رقم كبير مقارنة بالقيمة السوقية؛ وهذه الحركة لم تكن بلا ألم.
الصورة الأكبر
BEAT بلغ القمة قرب 11 في منتصف يونيو، ثم في كل ارتداد منذ ذلك الحين تم تسجيل قمة أدنى. حركة إلى حوالي 6 في أواخر يوليو، ثم المزيد من التآكل. السعر الآن عند قاع هذا الانخفاض الكامل، منخفضًا بأكثر من 98% من القمة.
هذا يعيد تأطير حركة اليوم. الأمر ليس بداية اتجاه صعودي جديد؛ بل هو ارتداد بعد هبوط طويل بطيء.
المستويات على خريطة التصفية
توجد مجموعتان متميزتان: 1.76 مليون دولار عند 0.29، و1.73 مليون دولار عند 0.73. كلاهما أعلى بكثير من السعر الحالي.
هذا يشير إلى منطقتي وقود مكدستين أعلى. إذا بدأ السعر بالتحرك نحو 0.29، فإن تلك المراكز المتراكمة ستُفعَّل ويمكن أن تغذي الحركة نفسها. 0.73 هي خطوة أكبر بكثير إلى الخارج.
سواء انعكس تدفق المتلقّي إلى المشترين، وإذا بقي بائعًا بشكل أكبر، فسيظل هذا الارتداد ضعيفًا.
سواء تراجعت العقود الآجلة/السعر الفوري؛ فالمشاركة الحقيقية تعني أن الفوري سيلحق الركب.
كيف ستُستقبل المحاولة الأولى للوصول إلى 0.29.
يمكنك متابعة هذه البيانات في الوقت الحقيقي في المجموعة الخاصة. منشور مثبت للتفاصيل.
البنية هنا متناقضة، تستحق المرور على كل جزء.
العقود الآجلة/السعر الفوري عند 31.5x، واحدة من أكثر النِّسب تطرفًا التي رأيناها. حجم التداول الفوري هو 26.08 مليون دولار، والآجلة 821.39 مليون دولار. السعر هنا عبارة عن قصة رافعة مالية تقريبًا بالكامل؛ الفوري بالكاد يشارك.
الحشد طويل بقوة، لكن المتلقّين (الذين يشترون/يُدخلون السيولة) يبيعون. L/S عند 2.61، ونسبة حساب أفضل متداول عند 2.82؛ كلاهما يميل إلى الصعود من حيث عدد الحسابات. لكن نسبة مركز أفضل المتداول هي 1.35 فقط، ما يعني أن حجم ما يحملونه محافظ أكثر بكثير. شراء/بيع المتلقّي هو 0.79، والجانب الأكثر عدوانية يبيع صافيًا. لذا بينما يرتفع السعر 36%، فإن من يضرب السوق في الواقع يبيع داخله. المشترون جالسون بشكل سلبي، والبائعون هم من يسحبون الزناد.
تمت تصفية 2.81 مليون دولار خلال 24 ساعة، وهو رقم كبير مقارنة بالقيمة السوقية؛ وهذه الحركة لم تكن بلا ألم.
الصورة الأكبر
BEAT بلغ القمة قرب 11 في منتصف يونيو، ثم في كل ارتداد منذ ذلك الحين تم تسجيل قمة أدنى. حركة إلى حوالي 6 في أواخر يوليو، ثم المزيد من التآكل. السعر الآن عند قاع هذا الانخفاض الكامل، منخفضًا بأكثر من 98% من القمة.
هذا يعيد تأطير حركة اليوم. الأمر ليس بداية اتجاه صعودي جديد؛ بل هو ارتداد بعد هبوط طويل بطيء.
المستويات على خريطة التصفية
توجد مجموعتان متميزتان: 1.76 مليون دولار عند 0.29، و1.73 مليون دولار عند 0.73. كلاهما أعلى بكثير من السعر الحالي.
هذا يشير إلى منطقتي وقود مكدستين أعلى. إذا بدأ السعر بالتحرك نحو 0.29، فإن تلك المراكز المتراكمة ستُفعَّل ويمكن أن تغذي الحركة نفسها. 0.73 هي خطوة أكبر بكثير إلى الخارج.
سواء انعكس تدفق المتلقّي إلى المشترين، وإذا بقي بائعًا بشكل أكبر، فسيظل هذا الارتداد ضعيفًا.
سواء تراجعت العقود الآجلة/السعر الفوري؛ فالمشاركة الحقيقية تعني أن الفوري سيلحق الركب.
كيف ستُستقبل المحاولة الأولى للوصول إلى 0.29.
يمكنك متابعة هذه البيانات في الوقت الحقيقي في المجموعة الخاصة. منشور مثبت للتفاصيل.