$TUT
USDT — تحليل فني 15 دقيقة
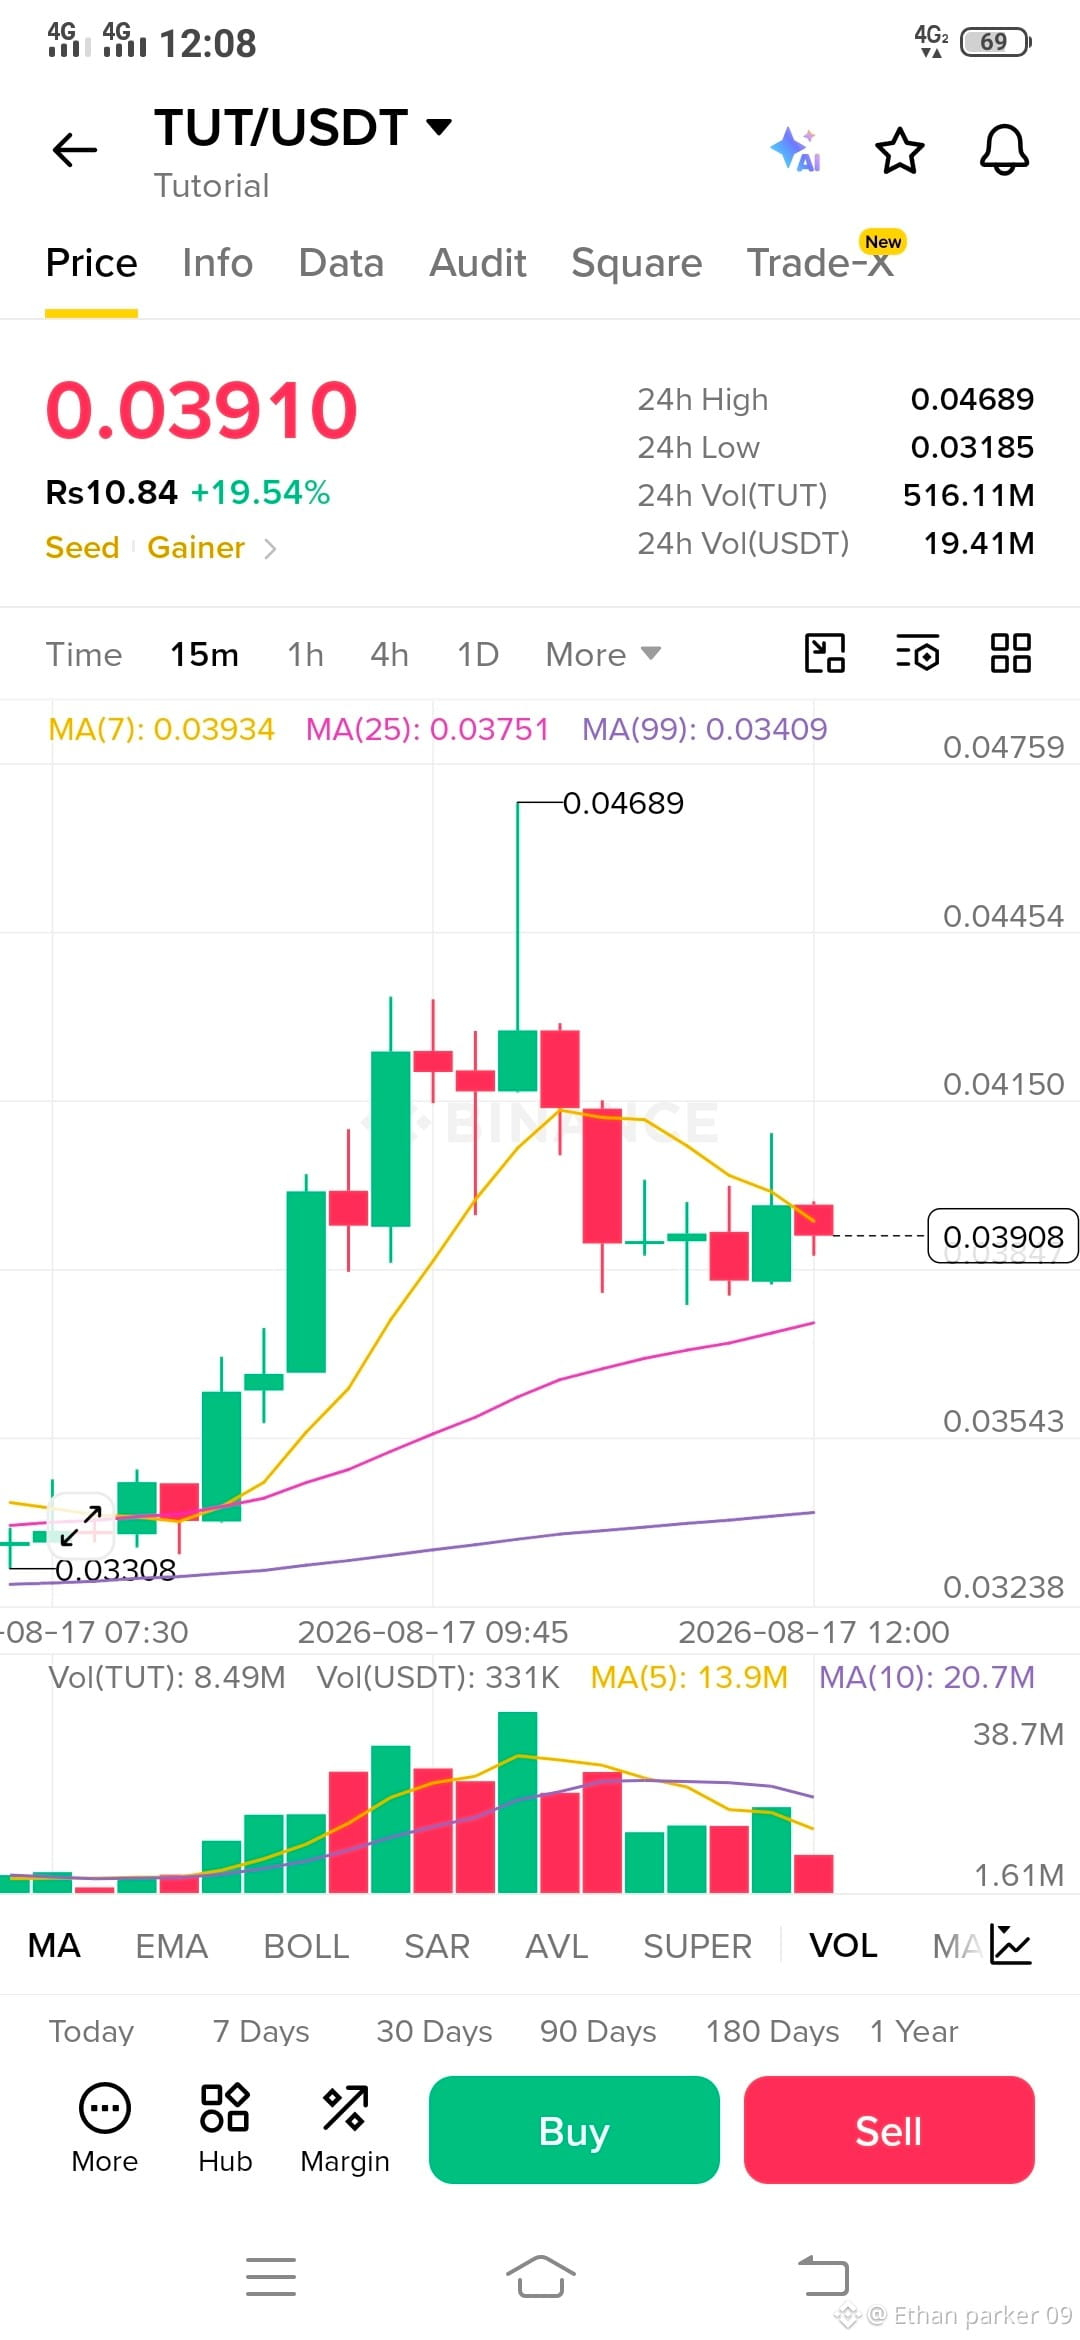
يُظهر TUT تعافيًا قويًا على المدى القصير، لكن الرسم البياني الآن يدخل منطقة تجميع بعد الحركة الحادة من 0.03308 → 0.04689.
السعر الحالي: 0.03910
أعلى سعر خلال 24 ساعة: 0.04689
أدنى سعر خلال 24 ساعة: 0.03185
MA(7): 0.03934
MA(25): 0.03751
MA(99): 0.03409
البنية: يبقى السعر فوق MA25 وMA99، مما يحافظ على هيكل 15 دقيقة صعوديًا. ومع ذلك، السعر أقل قليلًا من MA7، ما يعني أن الزخم الفوري قد هدأ.
المقاومة:
0.0405–0.0415 → المنطقة الأولى المهمة
0.0445 → المقاومة التالية
0.04689 → الاختراق/القمة الرئيسية
الدعم:
0.0380–0.0375 → دعم رئيسي قريب الأجل
0.0354 → دعم أعمق
0.0341 → MA99 / دعم هيكلي
السيناريو الصعودي: إذا استعاد TUT 0.0405–0.0415 بحجم تداول قوي، فقد تصبح حركة باتجاه 0.0445 وحتى 0.0469 ممكنة.
السيناريو الهبوطي: فقدان 0.0375 قد يؤدي إلى تصحيح أعمق باتجاه 0.0354–0.0341.
رؤية المتداول: أنصح بتجنب المطاردة عند 0.039–0.040. الإعداد الأكثر وضوحًا هو إما اختراق مؤكد فوق 0.0415 أو تراجع مضبوط يمسك مستوى 0.0375. حجم التداول هو التأكيد الأساسي لأن الضخة الأولية قد هدأت بشكل كبير.
#CardanoSplitsDijkstraUpgradeIntoTwoPhases
#SECCancelsCryptoRulemakingMeeting
#SECReviewsSix3xLeveragedCommodityETFs
USDT — تحليل فني 15 دقيقة
يُظهر TUT تعافيًا قويًا على المدى القصير، لكن الرسم البياني الآن يدخل منطقة تجميع بعد الحركة الحادة من 0.03308 → 0.04689.
السعر الحالي: 0.03910
أعلى سعر خلال 24 ساعة: 0.04689
أدنى سعر خلال 24 ساعة: 0.03185
MA(7): 0.03934
MA(25): 0.03751
MA(99): 0.03409
البنية: يبقى السعر فوق MA25 وMA99، مما يحافظ على هيكل 15 دقيقة صعوديًا. ومع ذلك، السعر أقل قليلًا من MA7، ما يعني أن الزخم الفوري قد هدأ.
المقاومة:
0.0405–0.0415 → المنطقة الأولى المهمة
0.0445 → المقاومة التالية
0.04689 → الاختراق/القمة الرئيسية
الدعم:
0.0380–0.0375 → دعم رئيسي قريب الأجل
0.0354 → دعم أعمق
0.0341 → MA99 / دعم هيكلي
السيناريو الصعودي: إذا استعاد TUT 0.0405–0.0415 بحجم تداول قوي، فقد تصبح حركة باتجاه 0.0445 وحتى 0.0469 ممكنة.
السيناريو الهبوطي: فقدان 0.0375 قد يؤدي إلى تصحيح أعمق باتجاه 0.0354–0.0341.
رؤية المتداول: أنصح بتجنب المطاردة عند 0.039–0.040. الإعداد الأكثر وضوحًا هو إما اختراق مؤكد فوق 0.0415 أو تراجع مضبوط يمسك مستوى 0.0375. حجم التداول هو التأكيد الأساسي لأن الضخة الأولية قد هدأت بشكل كبير.
#CardanoSplitsDijkstraUpgradeIntoTwoPhases
#SECCancelsCryptoRulemakingMeeting
#SECReviewsSix3xLeveragedCommodityETFs