
📊 تدفقات رأس المال في العملات المشفرة
— ملخص أسبوعي للسوق
انعكست تدفقات المؤسسات بقوة: بعد أقوى أسبوع لصناديق الاستثمار المتداولة (ETFs) منذ يونيو، أعادت صناديق BTC ما يقرب من نصف ذلك خلال خمسة أيام، بينما ظلت صناديق ETH على حالها دون تغيير، وتحوّلت تدفقات البورصات على السلسلة إلى تدفقات صافية للـBTC، وهي إشارة تحذير من جانبين.
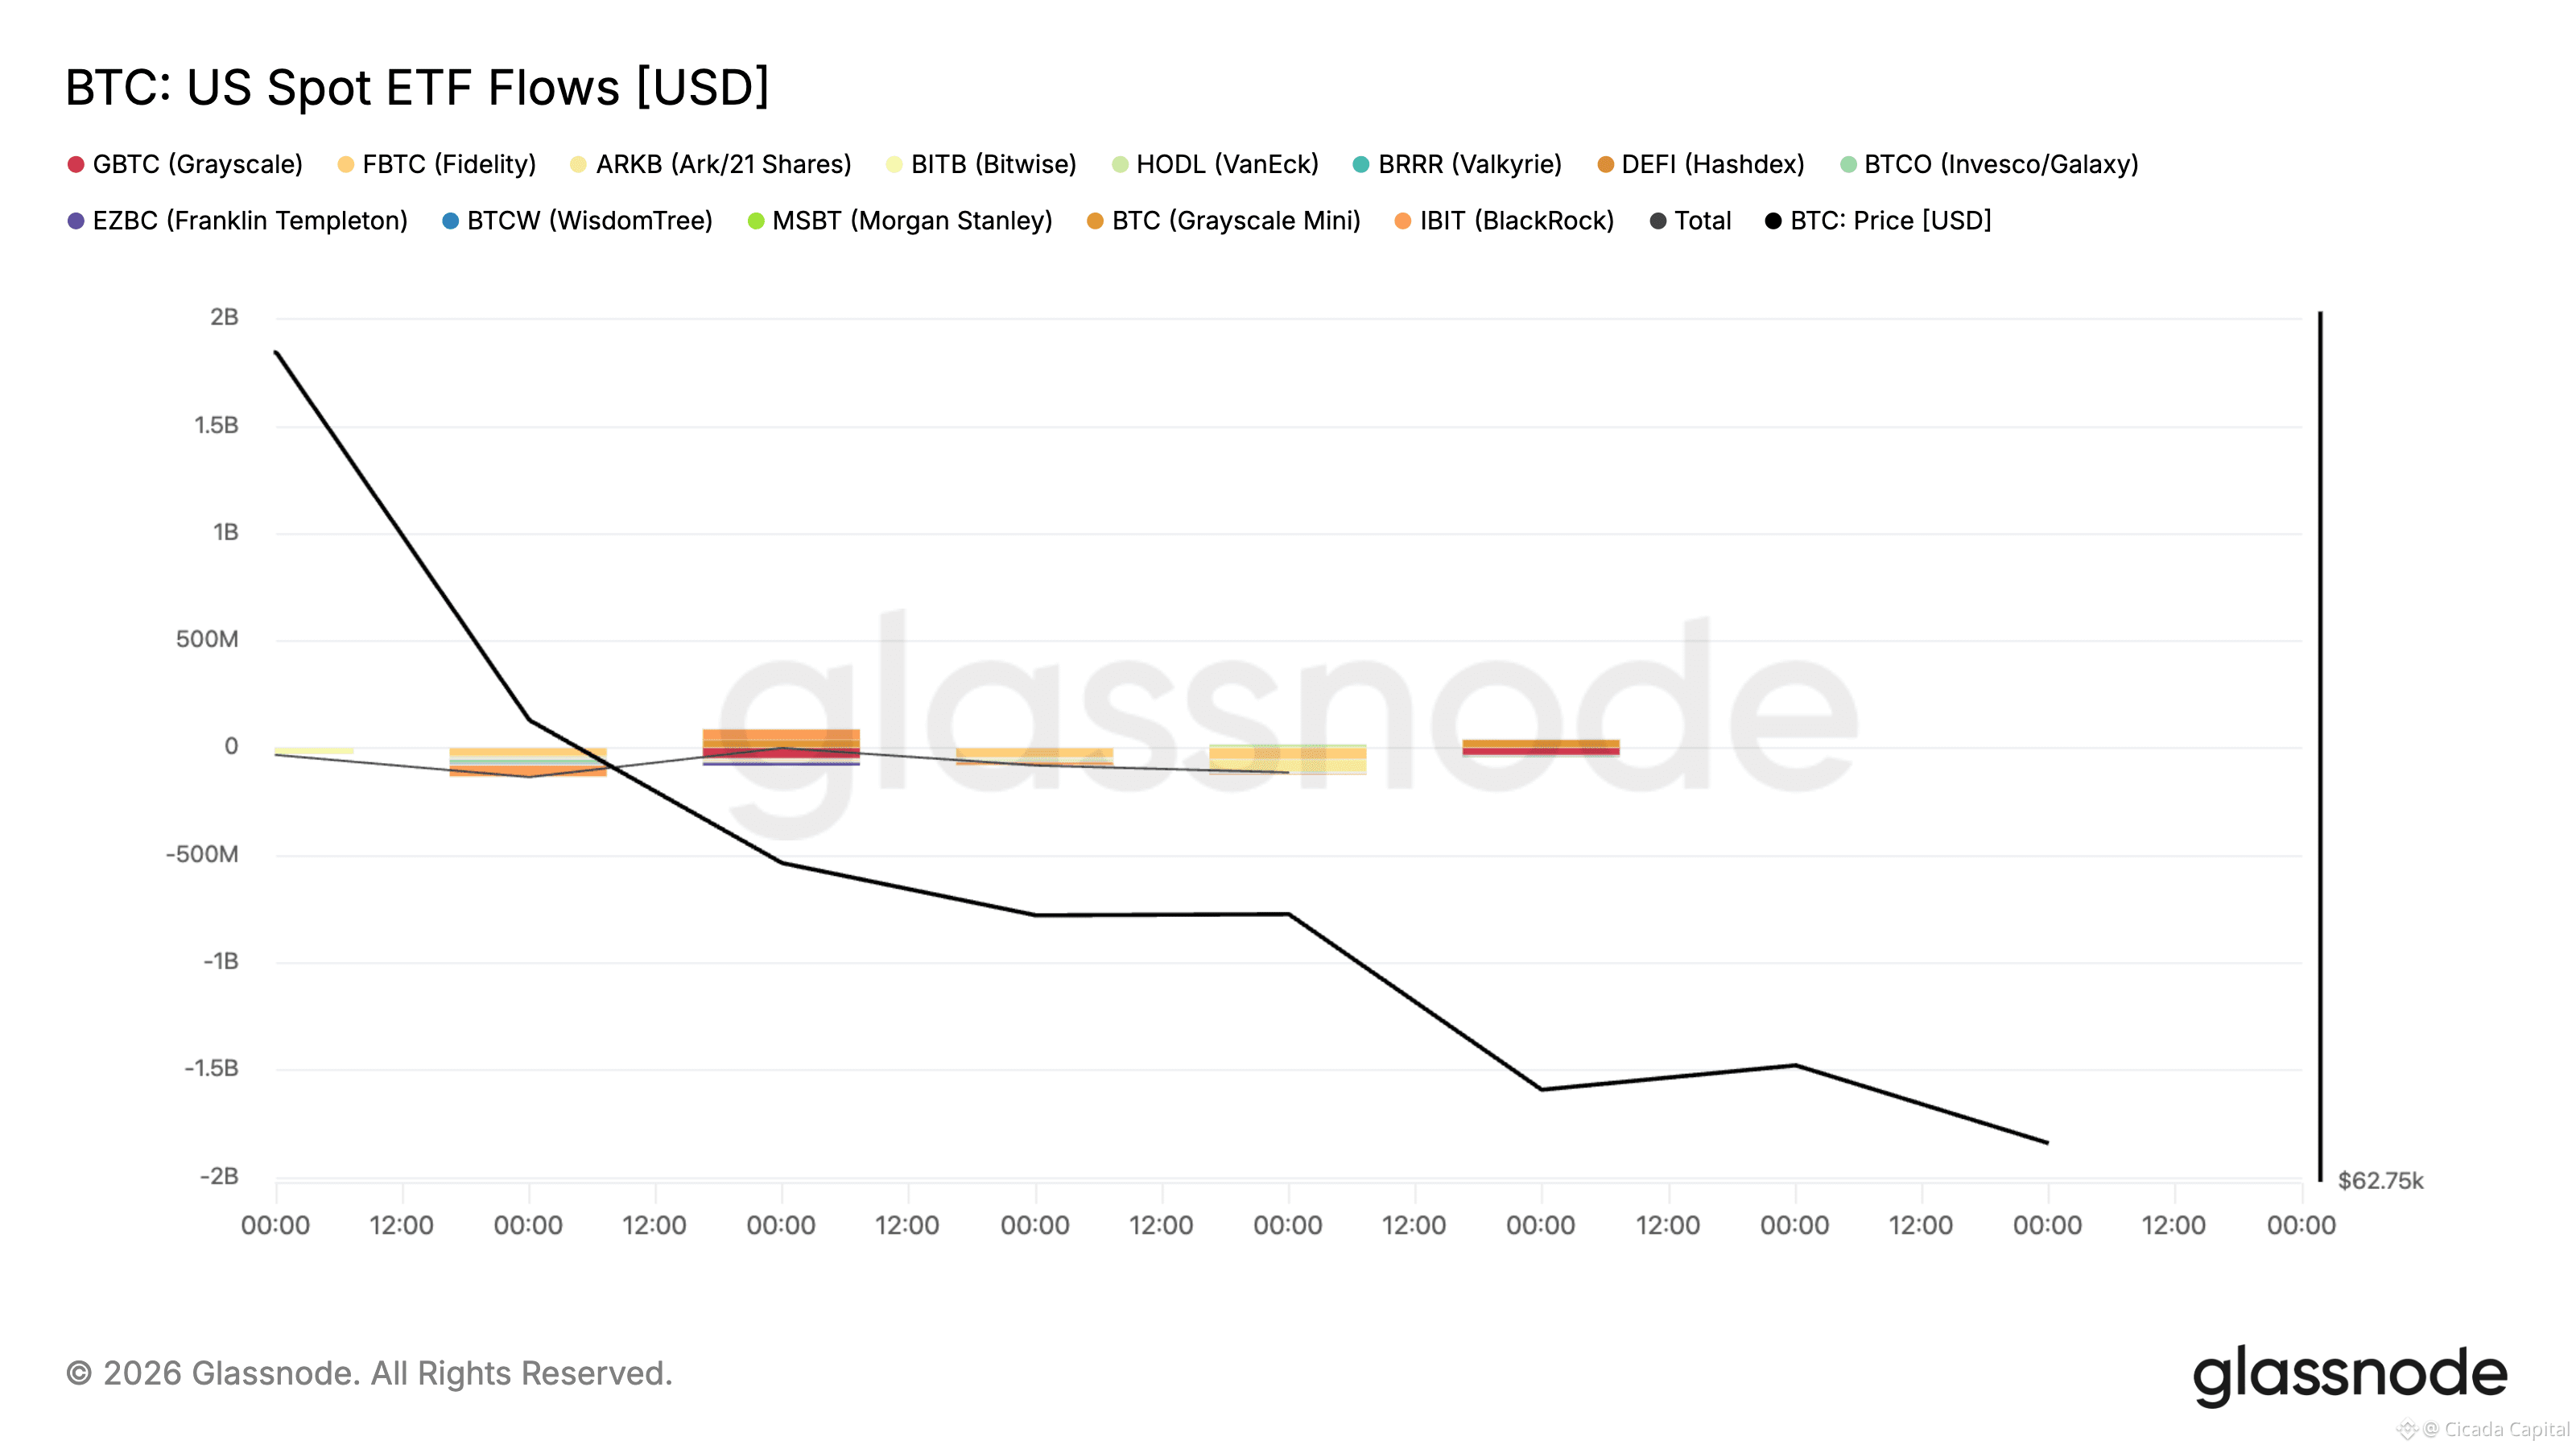
• $BTC تدفقات صناديق الاستثمار المتداولة: بدأ الأسبوع عند -144.6 مليون دولار في 10 أغسطس، ثم +7.8 مليون دولار في 11 أغسطس، وبعدها -61.1 مليون دولار في يوم مؤشر CPI بتاريخ 12 أغسطس، و-131.1 مليون دولار في 13 أغسطس و-56.2 مليون دولار في 14 أغسطس.
الصافي الأسبوعي: قرابة -385.2 مليون دولار، أول أسبوع سلبي منذ أسبوع 28 يوليو (اجتماع لجنة السوق المفتوحة FOMC) وأضعف أداء خلال فترة التعافي. ومن اللافت أن عمليات الخروج جاءت في أسبوع من أخبار اقتصادية كلية جيدة، ما يوحي بأن البيع كان مدفوعاً بالتمركزات أكثر من كونه هروباً بسبب الاقتصاد.
• $ETH تدفقات صناديق الاستثمار المتداولة: حافظت الإيثيريوم على تماسك أفضل بكثير: -14.6 مليون دولار، -1.7 مليون دولار، +7.4 مليون دولار، +5.9 مليون دولار، وكان صِفراً تقريباً في 14 أغسطس، لتبلغ صافيًا قرابة -3.0 مليون دولار، محايداً عملياً بعد طفرة الأسبوع الماضي التي بلغت +244 مليون دولار. توقفت سردية تدوير ETH لكن لم تنكسر؛ فقد تفوقت ETH الفورية على BTC خلال الأسبوع.
صافي تدفق البورصات: تحولت بيانات السلسلة إلى السالب للـBTC: نحو +16.5 ألف BTC تدفقت صافية إلى البورصات خلال الفترة من 10 إلى 16 أغسطس، وهو أكبر تدفق أسبوعي إلى الداخل منذ موجة التصفية، ما يشير إلى تحرك المعروض نحو سيولة جانب البيع.
بالنسبة للـETH: رسمت صورة شبه ثابتة عند +5.1 ألف ETH مع أسبوع حاد من جانبين: كان رقم خروج -55.8 ألف تقريباً مُعوَّضاً بالكامل بواسطة يوم تدفق وارد +43.0 ألف.
تغيّر فسيفساء التدفقات عن الأسبوع الماضي: لم يعد طلب صناديق الاستثمار المتداولة يمتص تدفقات البورصات الواردة. يأتي الآن العرض/الطلب المعاكس من الشركات: دفعت BitMine رصيدها من ETH إلى 5.81M ETH، ما رفع إجمالي ممتلكات الشركات المدرجة من ETH إلى 7.82M ETH، وكذلك من تقارير متواصلة عن ضعف ETH الفوري في الولايات المتحدة: تشير AMBCrypto إلى وجود Coinbase Premium سالب ممتد كتحذير لمدة 90 يوماً على الطلب الأمريكي.
— ملخص أسبوعي للسوق
انعكست تدفقات المؤسسات بقوة: بعد أقوى أسبوع لصناديق الاستثمار المتداولة (ETFs) منذ يونيو، أعادت صناديق BTC ما يقرب من نصف ذلك خلال خمسة أيام، بينما ظلت صناديق ETH على حالها دون تغيير، وتحوّلت تدفقات البورصات على السلسلة إلى تدفقات صافية للـBTC، وهي إشارة تحذير من جانبين.
• $BTC تدفقات صناديق الاستثمار المتداولة: بدأ الأسبوع عند -144.6 مليون دولار في 10 أغسطس، ثم +7.8 مليون دولار في 11 أغسطس، وبعدها -61.1 مليون دولار في يوم مؤشر CPI بتاريخ 12 أغسطس، و-131.1 مليون دولار في 13 أغسطس و-56.2 مليون دولار في 14 أغسطس.
الصافي الأسبوعي: قرابة -385.2 مليون دولار، أول أسبوع سلبي منذ أسبوع 28 يوليو (اجتماع لجنة السوق المفتوحة FOMC) وأضعف أداء خلال فترة التعافي. ومن اللافت أن عمليات الخروج جاءت في أسبوع من أخبار اقتصادية كلية جيدة، ما يوحي بأن البيع كان مدفوعاً بالتمركزات أكثر من كونه هروباً بسبب الاقتصاد.
• $ETH تدفقات صناديق الاستثمار المتداولة: حافظت الإيثيريوم على تماسك أفضل بكثير: -14.6 مليون دولار، -1.7 مليون دولار، +7.4 مليون دولار، +5.9 مليون دولار، وكان صِفراً تقريباً في 14 أغسطس، لتبلغ صافيًا قرابة -3.0 مليون دولار، محايداً عملياً بعد طفرة الأسبوع الماضي التي بلغت +244 مليون دولار. توقفت سردية تدوير ETH لكن لم تنكسر؛ فقد تفوقت ETH الفورية على BTC خلال الأسبوع.
صافي تدفق البورصات: تحولت بيانات السلسلة إلى السالب للـBTC: نحو +16.5 ألف BTC تدفقت صافية إلى البورصات خلال الفترة من 10 إلى 16 أغسطس، وهو أكبر تدفق أسبوعي إلى الداخل منذ موجة التصفية، ما يشير إلى تحرك المعروض نحو سيولة جانب البيع.
بالنسبة للـETH: رسمت صورة شبه ثابتة عند +5.1 ألف ETH مع أسبوع حاد من جانبين: كان رقم خروج -55.8 ألف تقريباً مُعوَّضاً بالكامل بواسطة يوم تدفق وارد +43.0 ألف.
تغيّر فسيفساء التدفقات عن الأسبوع الماضي: لم يعد طلب صناديق الاستثمار المتداولة يمتص تدفقات البورصات الواردة. يأتي الآن العرض/الطلب المعاكس من الشركات: دفعت BitMine رصيدها من ETH إلى 5.81M ETH، ما رفع إجمالي ممتلكات الشركات المدرجة من ETH إلى 7.82M ETH، وكذلك من تقارير متواصلة عن ضعف ETH الفوري في الولايات المتحدة: تشير AMBCrypto إلى وجود Coinbase Premium سالب ممتد كتحذير لمدة 90 يوماً على الطلب الأمريكي.